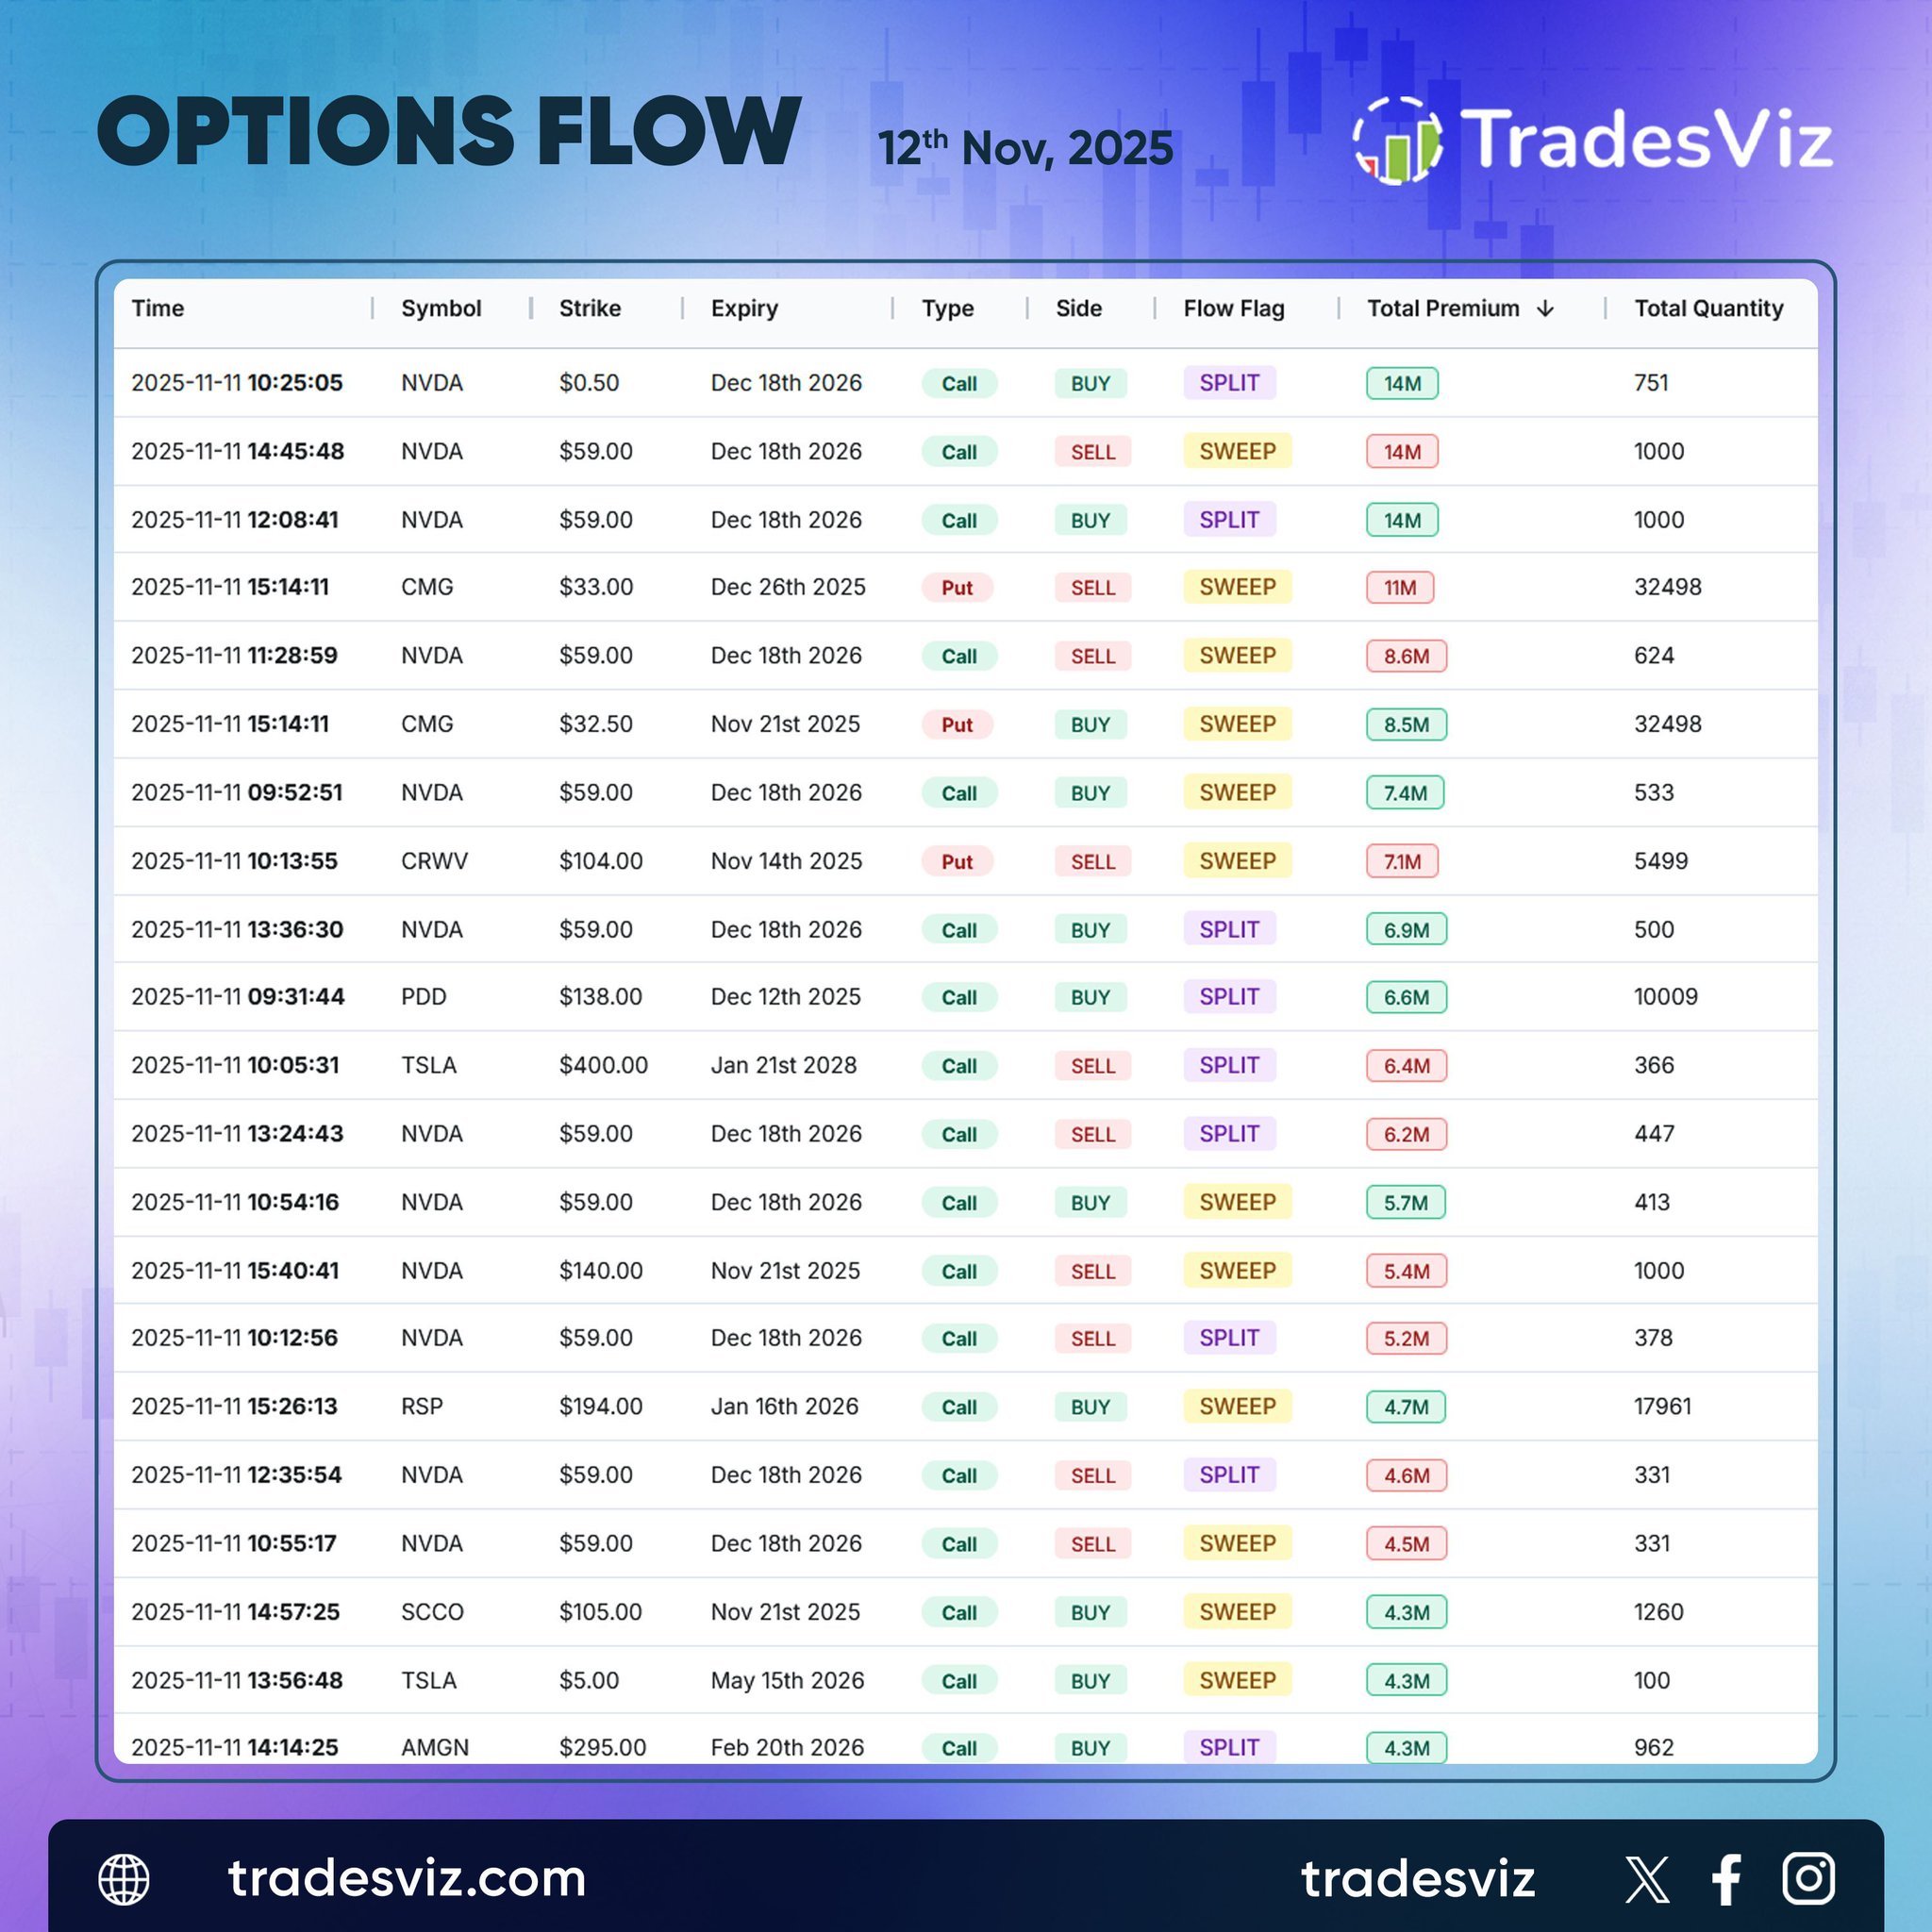
The options flow for November 12, 2025, shows strong multi-sector activity dominated by high-value trades in $NVDA, reflecting continued institutional focus on large-cap technology.
$NVDA led with multiple trades between the $0.50 and $140 strike range across expiries in December 2026 and November 2025. Both call buys and call sells appeared, with premiums ranging from $4.6M to $14M, signaling two-way positioning as traders balance long-term bullish exposure against short-term profit-taking.
Other large flows included $CMG with two put sell sweeps worth $11M and $8.5M, suggesting selective downside hedging in consumer names. $CRWV recorded a $7.1M put sell sweep for November 2025, showing activity in smaller-cap growth stocks, while $PDD saw a $6.6M call buy sweep at a $138 strike, reflecting bullish interest in Chinese equities.
$TSLA had notable split trades, including a $6.4M call sell at the $400 strike expiring in January 2026, showing premium harvesting while maintaining exposure to longer-term moves. $AMGN closed the list with a $4.3M call buy split at $295 expiring February 2026, marking selective participation in healthcare.
Overall, the November 12 flow reveals a balanced tone, with heavy positioning in $NVDA and mixed flows across consumer, industrial, and healthcare names as traders fine-tune exposure heading into mid-month.
The stock screener for November 12, 2025, highlights a continuation of upward momentum in small and mid-cap names, with several stocks extending multi-day rallies alongside early signals of bullish technical crossovers.
In the “Continuous higher highs + green for 5 days” list, $HUHU led with a 57.8 percent gain on 24.7K volume, maintaining consistent strength despite a minor volume dip. $NGL rose 46.7 percent with a 164.4 percent volume increase, while $ESTA and $HAE gained 41.6 and 40.2 percent respectively, both supported by high turnover.
$TERN advanced 36.3 percent even with lightened volume, signaling steady demand. Other movers included $ARMP up 28.6 percent, $GTE up 26.1 percent, and $SNDA climbing 25.7 percent, with all showing strong relative momentum. $FACO stood out with a 25.4 percent increase and a massive 30,650 percent surge in trading volume.
In the “Bullish golden (50–200 SMA) crossover” group, $KMT posted the biggest rise at 22 percent, followed by $COKE up 11.1 percent with a 111 percent volume boost. $GPOR added 5.7 percent and $TC gained 4.2 percent, both reflecting trend confirmation through increased participation.
The options flow screener for November 12, 2025, highlights symbols showing moderate divergence on the 30-minute timeframe in the last trading day, suggesting early signs of trend exhaustion or potential reversals.
The list includes $AAPL, $ADBE, $AMAT, $AMD, $AVGO, $BA, $BABA, $BIDU, $CORZ, and $CRCL — with most exhibiting mixed flow momentum relative to short-term price action. This type of divergence often reflects either diminishing selling pressure in downtrending stocks or reduced buying strength after strong rallies.
The chart of $AAPL shows clear intraday divergence between price and aggregate premium flow, with bullish and bearish activity forming distinct patterns around the $275 level. Option volume picked up through midday, even as price began stabilizing, hinting at accumulating interest for a potential rebound.
Overall, the November 12 screener indicates moderate divergence across major tech and industrial tickers, signaling possible short-term rotation or consolidation opportunities as option flows begin to diverge from price momentum.
The earnings calendar for November 12, 2025, features a strong lineup across technology, finance, entertainment, and manufacturing sectors, providing a key mix of market-moving reports.
Pre-market releases include $TDG with a $72B market cap and a $9.61 EPS estimate, $CRCL at $23B with $0.17 EPS, $TME at $33B with $0.20 EPS, $ONON at $22B with $0.20 EPS, and $GFS at $19B with a $0.31 EPS estimate. These reports cover industrials, fintech, semiconductors, and consumer retail trends critical for gauging economic momentum.
After hours will feature major updates from $CSCO with a $284B market cap and a $0.80 EPS estimate, and $MFC at $56B with a $0.74 EPS projection, both representing key insights into networking demand and global financial performance. $FLUT at $40B with a $0.17 EPS estimate and $PAAS at $13B with $0.49 EPS will bring in entertainment and mining data, while $ASND rounds out the day at $11B with an expected -$0.41 EPS.
Overall, the November 12 earnings lineup spans all major sectors, offering a broad snapshot of corporate health and investor sentiment heading into mid-November.
Simple, complex - it's all in your mind and super subjective.
😤 TradesViz gives you 100% control over what you want to see.
Would you rather be locked to a fixed, non-editable, overpriced journal? 😮💨
Or, have the freedom to do what you want?
You choose.
Rewind your trades. Redefine your exits. 📊
The Stop Loss & Profit Target Simulator in TradesViz lets you replay historical trades, adjust SL/TP levels, and instantly see how new parameters would have performed.
No predictions - just precise, data‑backed outcomes that refine your decision‑making and improve future execution.
Smarter exits start with simulation.
Precision meets practice. ⚙️📊
The Trading Simulator in TradesViz replicates real market execution with second‑by‑second data replay.
Test entries, stops, and scaling decisions for every symbol, just like live trading.
Track PnL, duration, and execution metrics dynamically to refine strategy without risking capital.
Turn observation into mastery.
Explore the Trading Simulator in TradesViz 👇
Clarity begins with numbers that speak for themselves. 📈
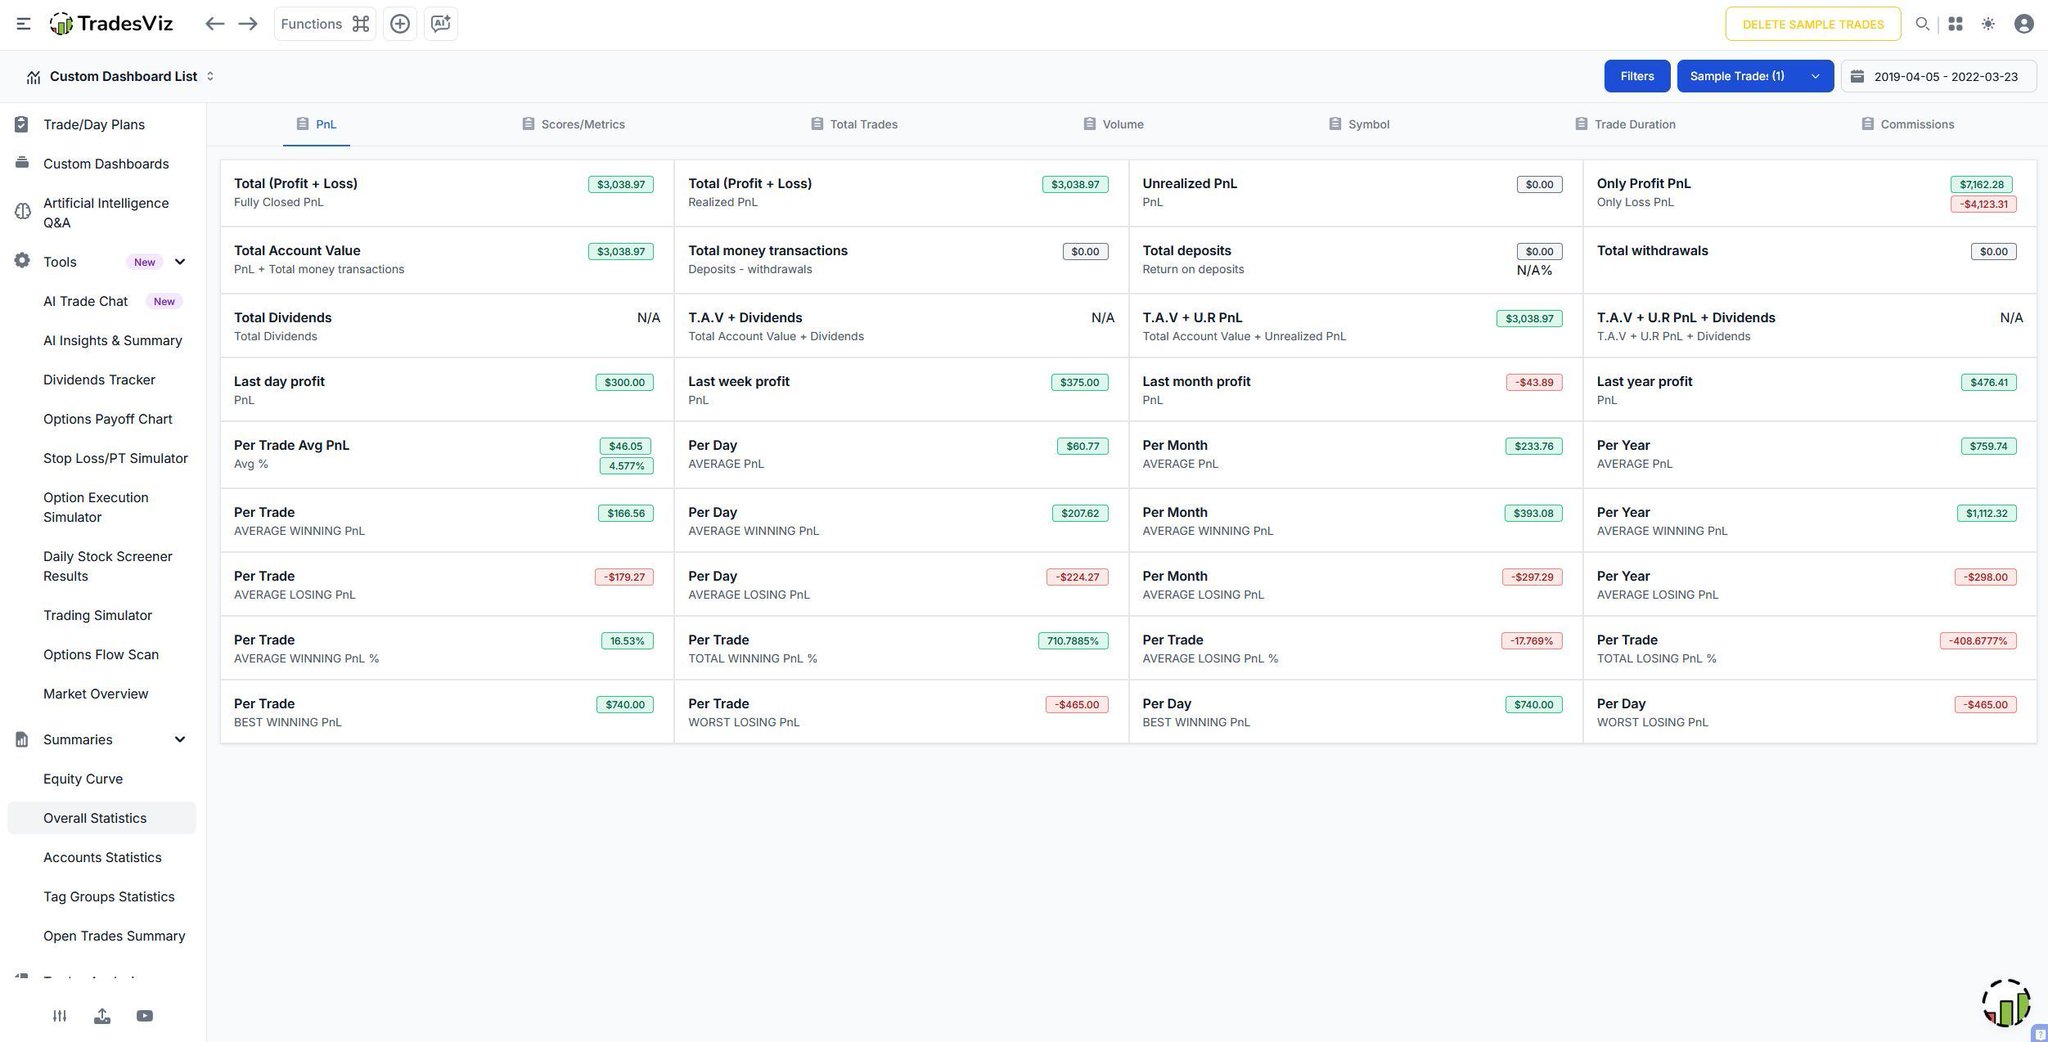
The Overall Statistics Dashboard in TradesViz brings every dimension of your performance together - total PnL, win‑loss ratios, trade frequency, and averages by day, month, and year.
One glance reveals where consistency builds and where volatility creeps in, helping refine both execution and strategy.
Analyze results, not guesses.
So what's the deal with candlestick patterns? hot or not?
We did a small test with a few patterns using TradesViz's backtester (powered by @ezstockscreener) and found a few interesting observations 👀
Read on to learn more!
This includes 10+ tests, screener codes + examples