Still leagues apart from the competition. 📉📈
While others give you static charts, we give you a Pivot Grid engine that rivals Excel.
While others track just PnL, we track options flow, seasonality, and trends.
TradesViz isn't just a journal. It's your trading HQ.
Daily trading performance — visualized with total clarity. 📅
The Day View in TradesViz brings every metric into one structured layout — PnL, win rate, execution count, and detailed running PnL graphs for each trading day.
Review patterns across days, identify volatility spikes, and link day‑level outcomes directly to your trades and strategies.
See your progress unfold — one session at a time.
Compare results, not guesses. 📊
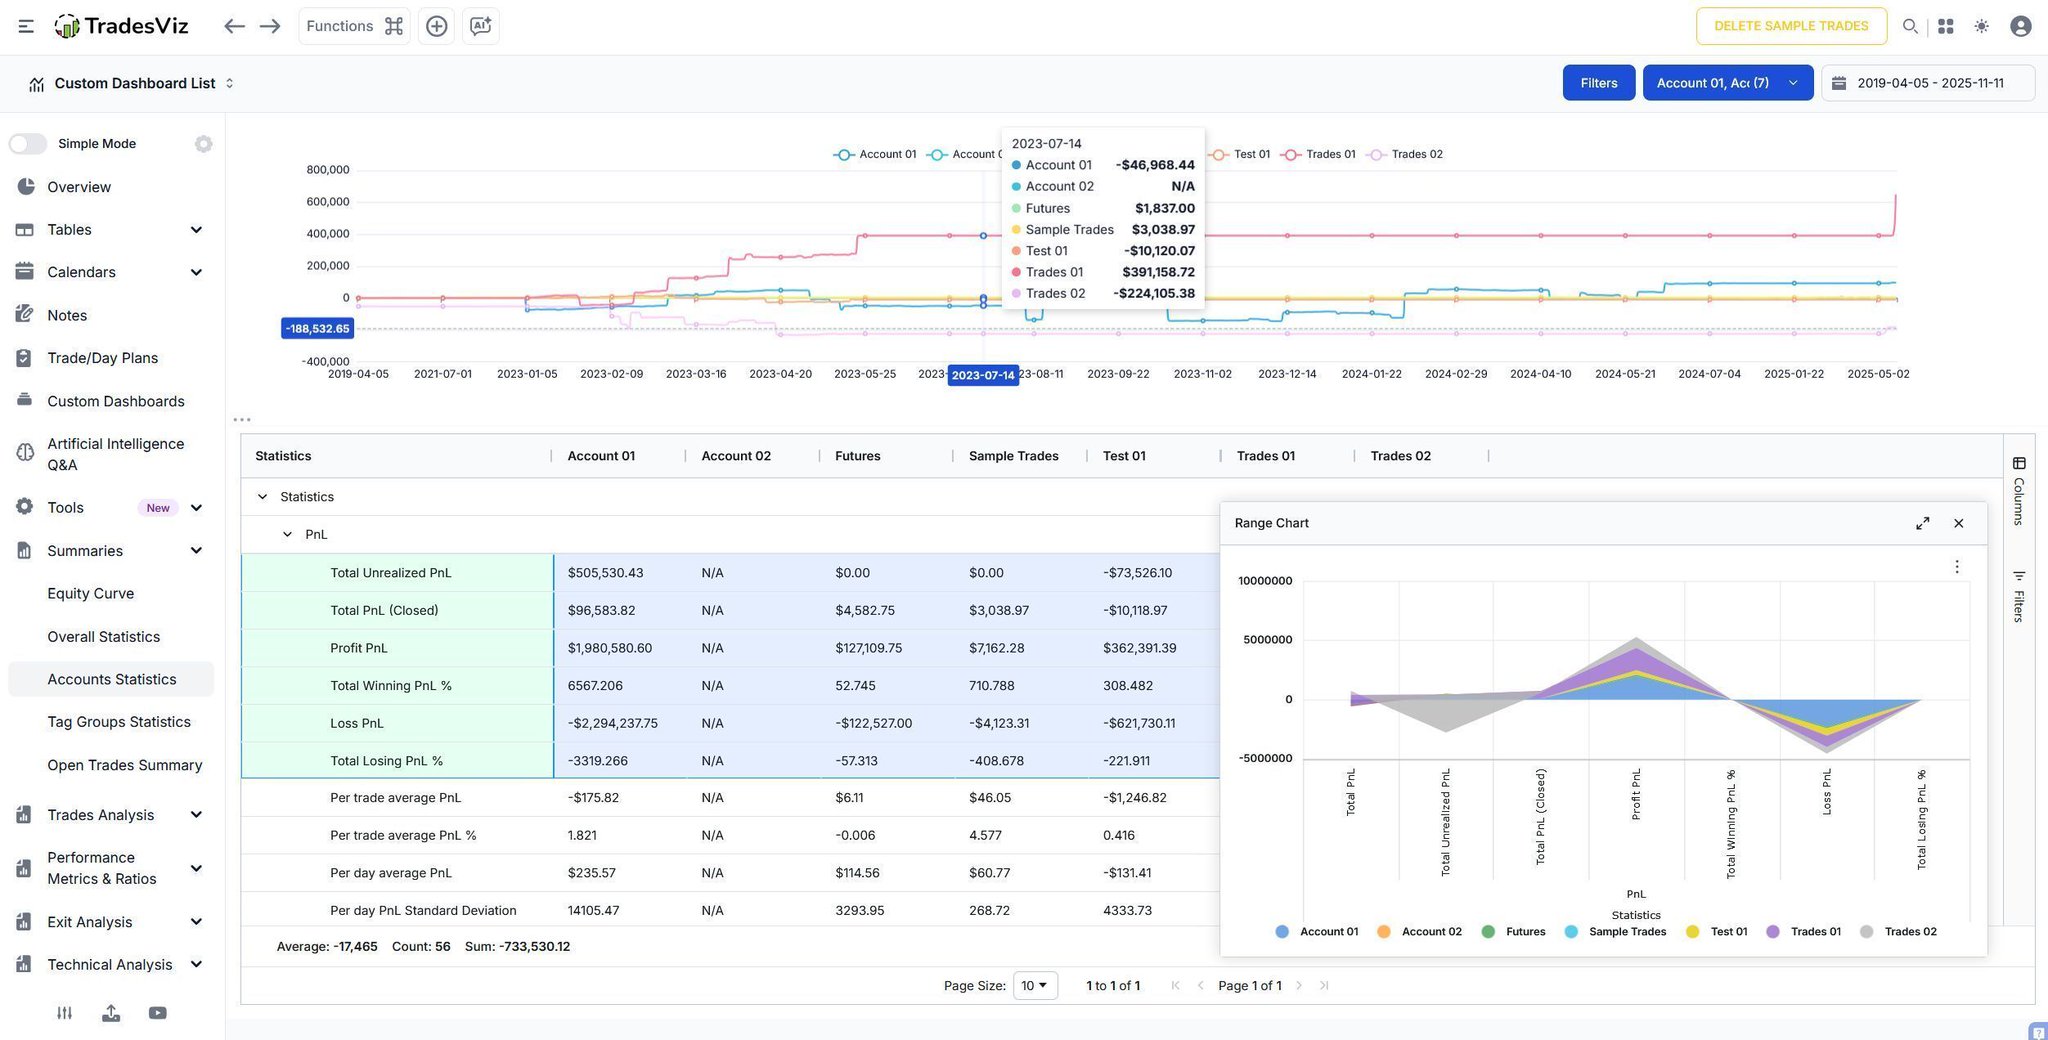
The new Account Statistics 2.0 in TradesViz brings multi‑account clarity to your trading data
View PnL, win rate, exposure, and profit‑loss distributions for every linked account in a single snapshot.
Quickly spot which account drives consistency, which carries risk, and how performance aligns across time frames and symbols.
Real numbers. Real transparency.
Unlock the full Accounts Statistics view on TradesViz 👇
Instead of spending 100s of hrs trying to get a magic AI bot trade for you, why not spend a few minutes giving it the data you've generated for anlaysis?..
Advantages:
1. Find things that were not obvious
2. Fast feedback
3. Run across 100s of trades
TradesViz has ALL of this.
🎉 BLACK FRIDAY! 🎟️ TVBF25 : 50% Total Off + Free Screener!
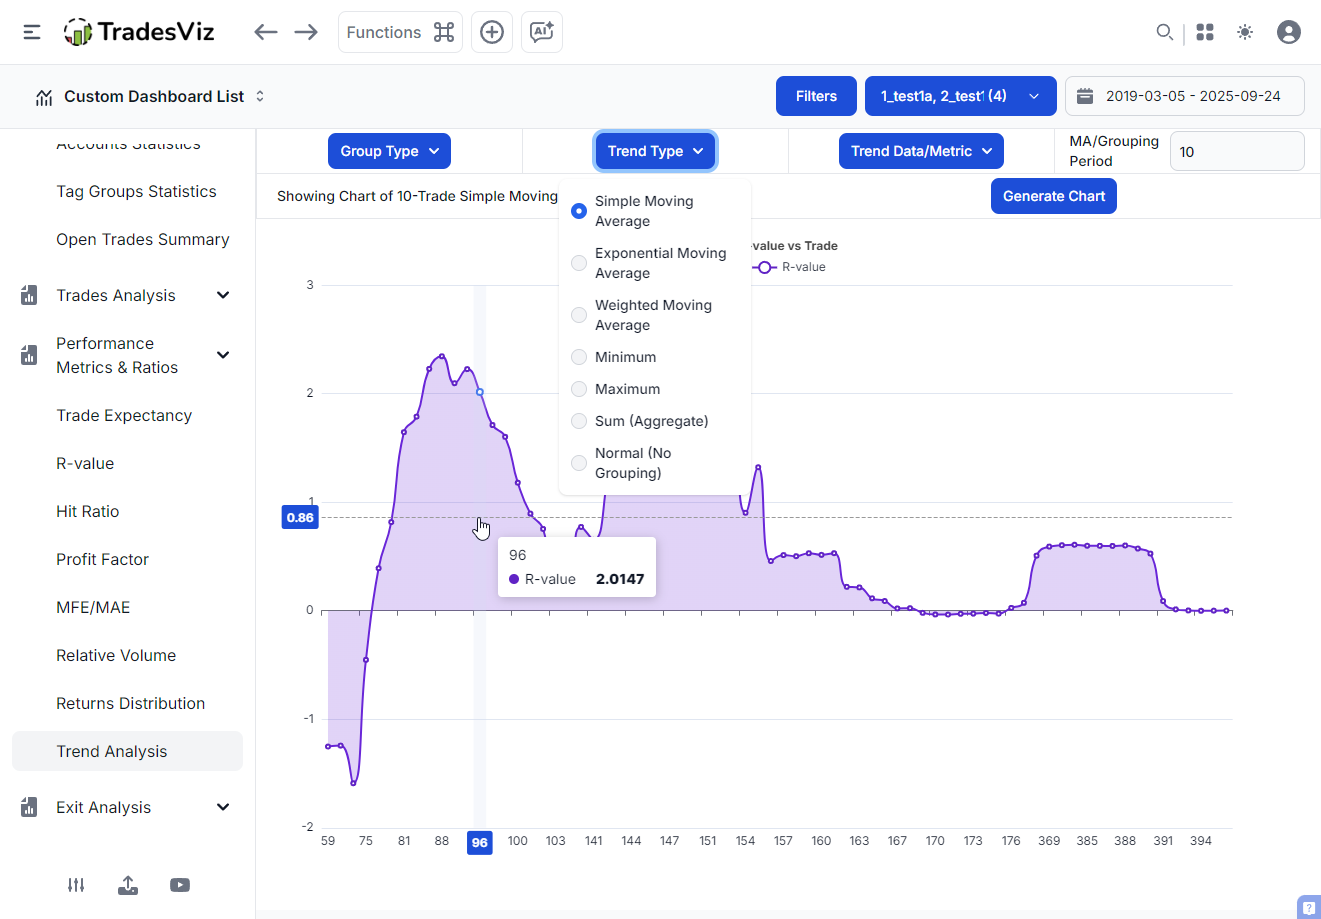
Just a simple moving average of your trading metrics can reveal a lot about the *trends* of your trading :)
It's not just for trading, but also for analyzing your trading!
TradesViz's trend anlaysis can do this.
If you need more custom versions, check AI Q&A!
The stock screener for November 18, 2025, highlights strong momentum across small and mid-cap tickers, with several names showing outsized single-day gains and sustained volume growth over the past week.
In the “More than 20% increase in price in the last 1 day” category, $CDTX led with a massive 105.4 percent surge on 17.28M volume, marking a 2,541.3 percent volume spike. $CYCU followed with a 51.2 percent jump and 33.91M shares traded, while $DOWAD gained 47.5 percent and $KYIVW advanced 37.3 percent with volume up 44.8 percent. $CMCT rose 36.4 percent, $IVVD climbed 32.8 percent with an impressive 5,241.6 percent surge in volume, and $TRDTF gained 31.8 percent amid steady trading activity. $GSNR, $TOI, and $CNTB rounded out the list, each rising between 26 and 30 percent, signaling broad-based strength.
In the “Continuous volume increase for 5 days” group, $TRDTF again led with a 121.6 percent price gain, confirming strong follow-through. $CORD jumped 63.8 percent as volume rose 167.7 percent, and $FLYT advanced 30.8 percent with volume up 1,017.9 percent, reflecting strong breakout momentum. $PRLD, $ETQ, and $ETHD posted double-digit gains, along with $OWLT, $LVLU, $REKT, and $CURI, all showing consistent volume expansion over several sessions.
The earnings lineup for November 18, 2025, features reports from major global companies across consumer, industrial, technology, and financial sectors, offering key insights into international market performance.
Pre-market highlights include $HD with a $360B market cap and a $3.81 EPS estimate, setting the tone for consumer retail and housing trends. $PDD follows with a $185B market cap and $1.99 EPS, along with other major Chinese tech names like $BIDU at $39B with $0.91 EPS and $FUTU at $23B with $1.61 EPS, providing a broad view of the Chinese e-commerce and fintech landscape.
$MDT brings healthcare focus with a $122B market cap and $1.31 EPS estimate, while $KLAR reports with a $24B cap and a -$0.33 EPS estimate, reflecting ongoing fintech developments. $ESLT at $21B and $2.75 EPS, and $AS at $16B with $0.25 EPS add industrial and sporting goods exposure, rounding out the pre-market group.
After hours, $SQM at $15B market cap with $0.68 EPS and $BZ at $8B with $0.23 EPS will report, offering additional updates from chemicals and HR tech names.
Put your TradesViz journal's AI to work in finding ideas, useful summaries, reviewing trades, and more.
But remember that this is not a replacement for the thinking that happens.
This is just assistance. A boost for your existing thought process.
Track every payout with precision. 💰
🎉 BLACK FRIDAY! 🎟️ TVBF25 : 50% Total Off + Free Screener!
The Dividends Tracker in TradesViz consolidates all dividend earnings across your portfolio with cumulative charts, frequency summaries, and symbol‑wise breakdowns.
Monitor total income, average yields, and monthly or yearly returns while visualizing contribution by each stock through an interactive pie and timeline chart.
Whether quarterly, monthly, or one‑time distributions, every detail is automatically organized for performance clarity.
Understand where your trading volume truly moves. 📊
The Volume Dashboard in TradesViz visualizes activity across multiple dimensions including duration, price, time of day, day, month, and year.
Overlay PnL and trade counts to uncover when liquidity peaks, where most capital flows, and which sessions deliver the strongest returns.
From intraday spikes to annual trends, every layer of volume tells a story about your execution behavior.
Turn activity patterns into performance insight with the Volume Dashboard in TradesViz 👇