Trading is the only profession where the rules are simple, but following them feels impossible. 🧠
You know you should "Plan BEFORE you trade" (#1). You know you should "Never rely on a single confirmation" (#3).
Yet, in the heat of the moment, you flush these rules down the toilet.
Why? Because you don't Journal (#5). If you don't track the pain of breaking rules, you will never respect them.
Discipline requires data. Start tracking.
The options flow screener for December 17, 2025 shows a sharp and continuous rise in the put call ratio of premium across multiple sectors over the last two days, signaling a shift toward hedging and defensive setups as traders adjust short term exposure.
$VEEV recorded the largest jump with a 23,840.35 percent increase, reaching a last value of 71, followed by $EQT up 18,660.87 percent at 29. $IGV rose 534.51 percent to 7.3 and $KKR climbed 423.87 percent to 7.2, reflecting elevated options activity tied to market volatility. $PEP increased 1,311.55 percent to 6.2, and $QURE along with $TTWO held steady at 5.8 after solid gains of 508.91 and 194.82 percent respectively. $T advanced 617.54 percent to 5.7, $ADI gained 4,944.16 percent also reaching 5.7, while $XLI moved up 764.65 percent to 5.5, highlighting broad based sector participation.
The chart for $KKR shows steady upward movement in the ratio, with notable price consolidation and volume spikes near key support levels, indicating cautious yet active trading behavior.
The options flow for December 17, 2025 shows concentrated institutional activity in large cap tech stocks, particularly $NVDA, with significant call buying and selling across multiple expirations, indicating active positioning near year end.
$NVDA dominated the tape with repeated trades at the 100 and 160 strikes expiring between January 2026 and January 2027. The largest was a 54M call sell sweep at the 100 strike for January 2026, followed by several 20M split trades for both buy and sell orders at the 160 strike for January 2027. Additional mid sized orders between 6M and 8.5M appeared at similar strikes, suggesting rotation and risk adjustment around current levels.
$TSLA also recorded strong action, including a 11M call buy split at the 600 strike expiring February 2026 and a 9.2M call buy sweep at 457.50 expiring December 2025. There were also call sell sweeps of 5.6M and 5.4M for March and December expirations, signaling mixed sentiment as traders manage exposure near short term resistance.
$META saw two key sell sweeps totaling 7.8M at the 5 strike expiring in January 2028, while $LLY posted a 7.3M call split at the 900 strike expiring in December 2025. $UNH attracted an 18M put buy sweep at the 450 strike expiring January 2026, showing selective defensive activity.
The stock screener for December 17, 2025 shows persistent bullish momentum across small and mid cap names, with several tickers maintaining strong multi day rallies supported by massive volume surges.
In the list of stocks up more than 30 percent in the last five days, $SCZMF led with a 362.3 percent rise to 9.43, followed by $FNMCF up 304.3 percent to 1.33 and $PLTZ up 290.7 percent to 24.03. $AFJK climbed 281.4 percent, while $BEAT gained 229.2 percent to 2.63 with a 1047.3 percent jump in volume. $MST advanced 212.8 percent, $SVRE rose 196.2 percent, and $ASTI increased 123 percent driven by a 1395.7 percent volume spike. $CLYM gained 110.5 percent and $ARTV advanced 104.5 percent, both supported by heavy trading activity.
In the continuous higher highs and green for five days group, $BEAT and $CLYM again led with 229.2 and 110.5 percent gains, showing notable multi day consistency. $CAMP followed with an 84.9 percent rise on strong participation, while $ANL, $GLIBR, and $GMGMF posted steady gains between 39 and 69 percent. $EVCM and $LUNG both rose more than 38 percent with healthy volume trends, and larger name $ANF posted a 23.7 percent increase, suggesting momentum spreading into broader sectors.
Using Linear regression/rend -> V-shape recovery: $LHX $LMT $MKTX $NOC
SMA 50-100-200 Weakening?... $BE $BELFB $BLTE $BNKU
Check @tradesviz for options screeners!
P.S. We hope you are using the daily stock screeners on TradesViz powered by EZstockscreener 😎
$NVDA $TSLA $META - back at the top of options flow stats.
But the volume of one of these is almost the other 2 combined ;)
$META has shown a clear divergence yesterday.
Check more in-depth stats on TradesViz's options flow dashboard - updated everyday!
The earnings calendar for December 17, 2025 features a diverse lineup spanning technology, industrials, and consumer goods, with both pre market and after hours reports expected to drive volatility across key sectors.
In the after hours session, $MU leads with a 266B market cap and a 3.67 EPS consensus estimate, providing a major read on the semiconductor industry. $WS follows with a 1B market cap and 0.48 EPS, representing the industrial metals space. $EPAC at 2B with a 0.38 EPS and $MLKN at 1B with a 0.41 EPS will also post results, highlighting trends within manufacturing and design-focused industries. $OPXS rounds out the after hours group with a 98M cap as a smaller defense and optics play.
In the pre market session, $JBL reports first with a 23B market cap and a 2.27 EPS estimate as a key indicator for electronics manufacturing. $GIS at 25B with a 1.02 EPS estimate and $TTC at 7B with a 0.86 EPS estimate represent the consumer staples and industrial equipment segments. $ABM with a 2B cap and 1.10 EPS estimate and $SPIR at 310M complete the list, offering insight into service and aerospace sectors.
Economic events for the day include remarks from an FOMC member at 07:15 and a scheduled speech from the U.S. president at 20:00, both likely to influence sentiment and add to evening volatility.
Weekly
Monthly
Yearly
3 views that are toggleable in a single click on TradesViz trading journal.
The *perfect* year-end trading review tabs. 👌
Import and start reviewing your trading trends.
Get ready for a STRONG 2026! 💪
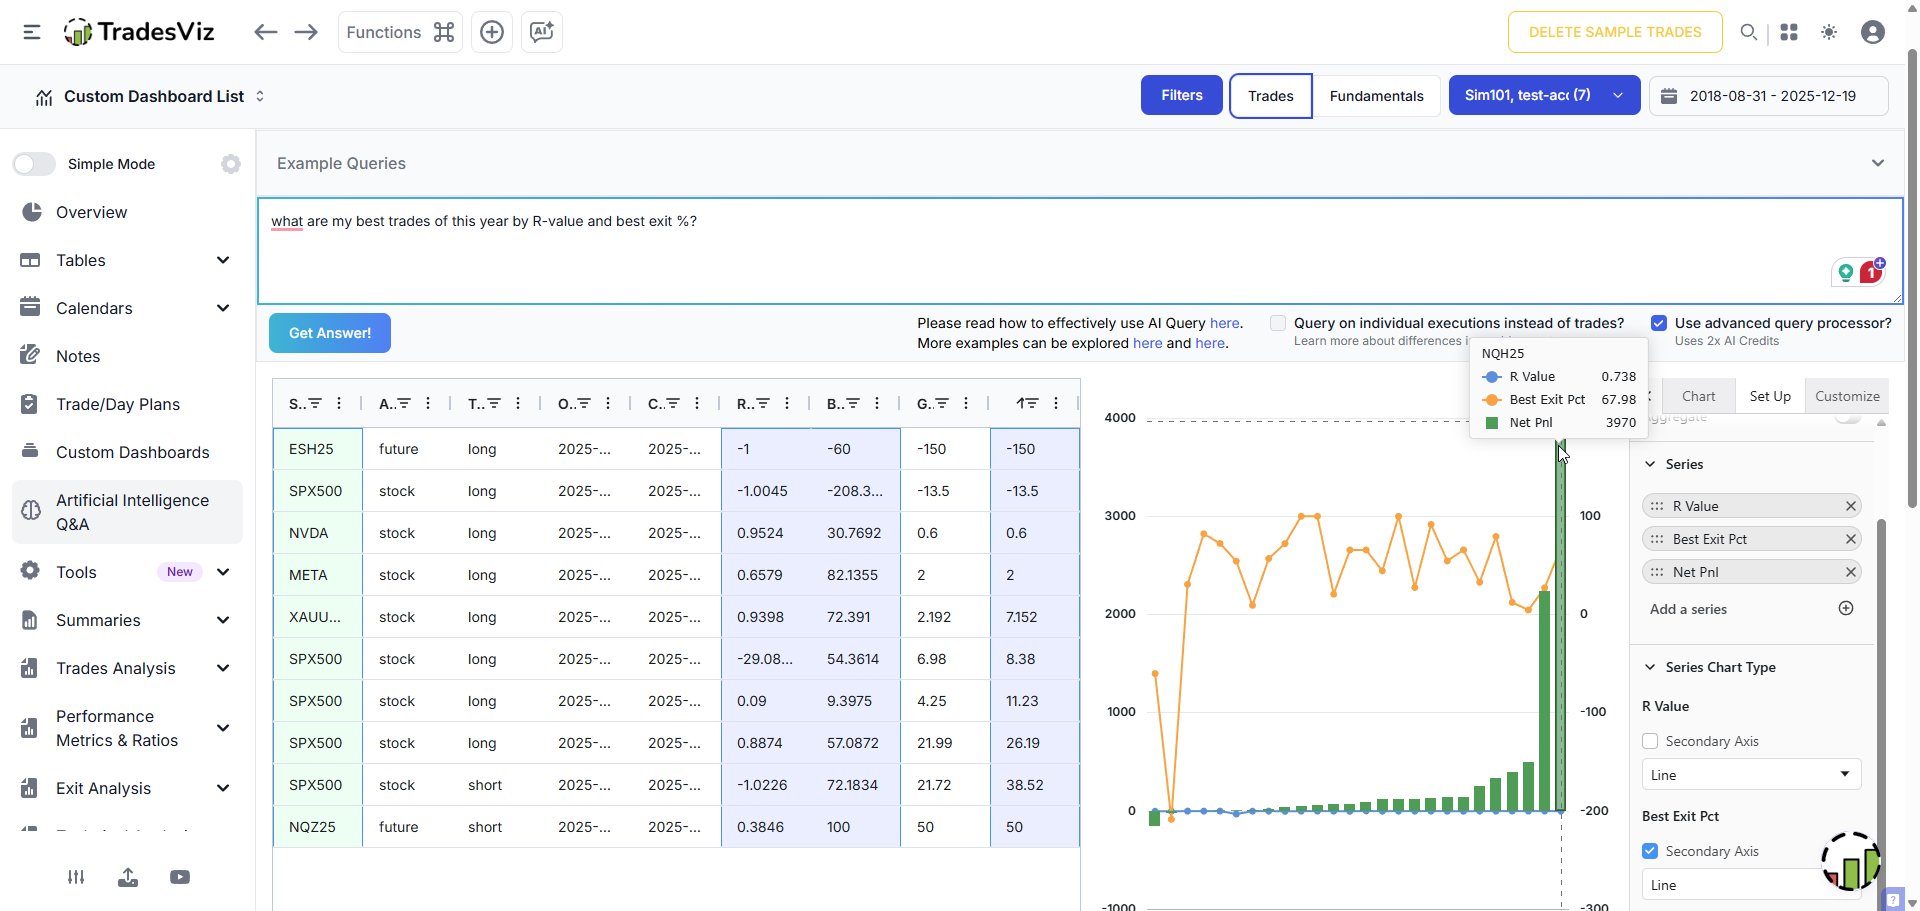
You have *zero* excuses to NOT use AI Q&A on TradesViz.
The only working, useful AI feature in the trade journaling world is with 100% privacy.
You can do your entire yearly summary with just a few questions on TradesViz.
Make AI work for you. This is just one example.