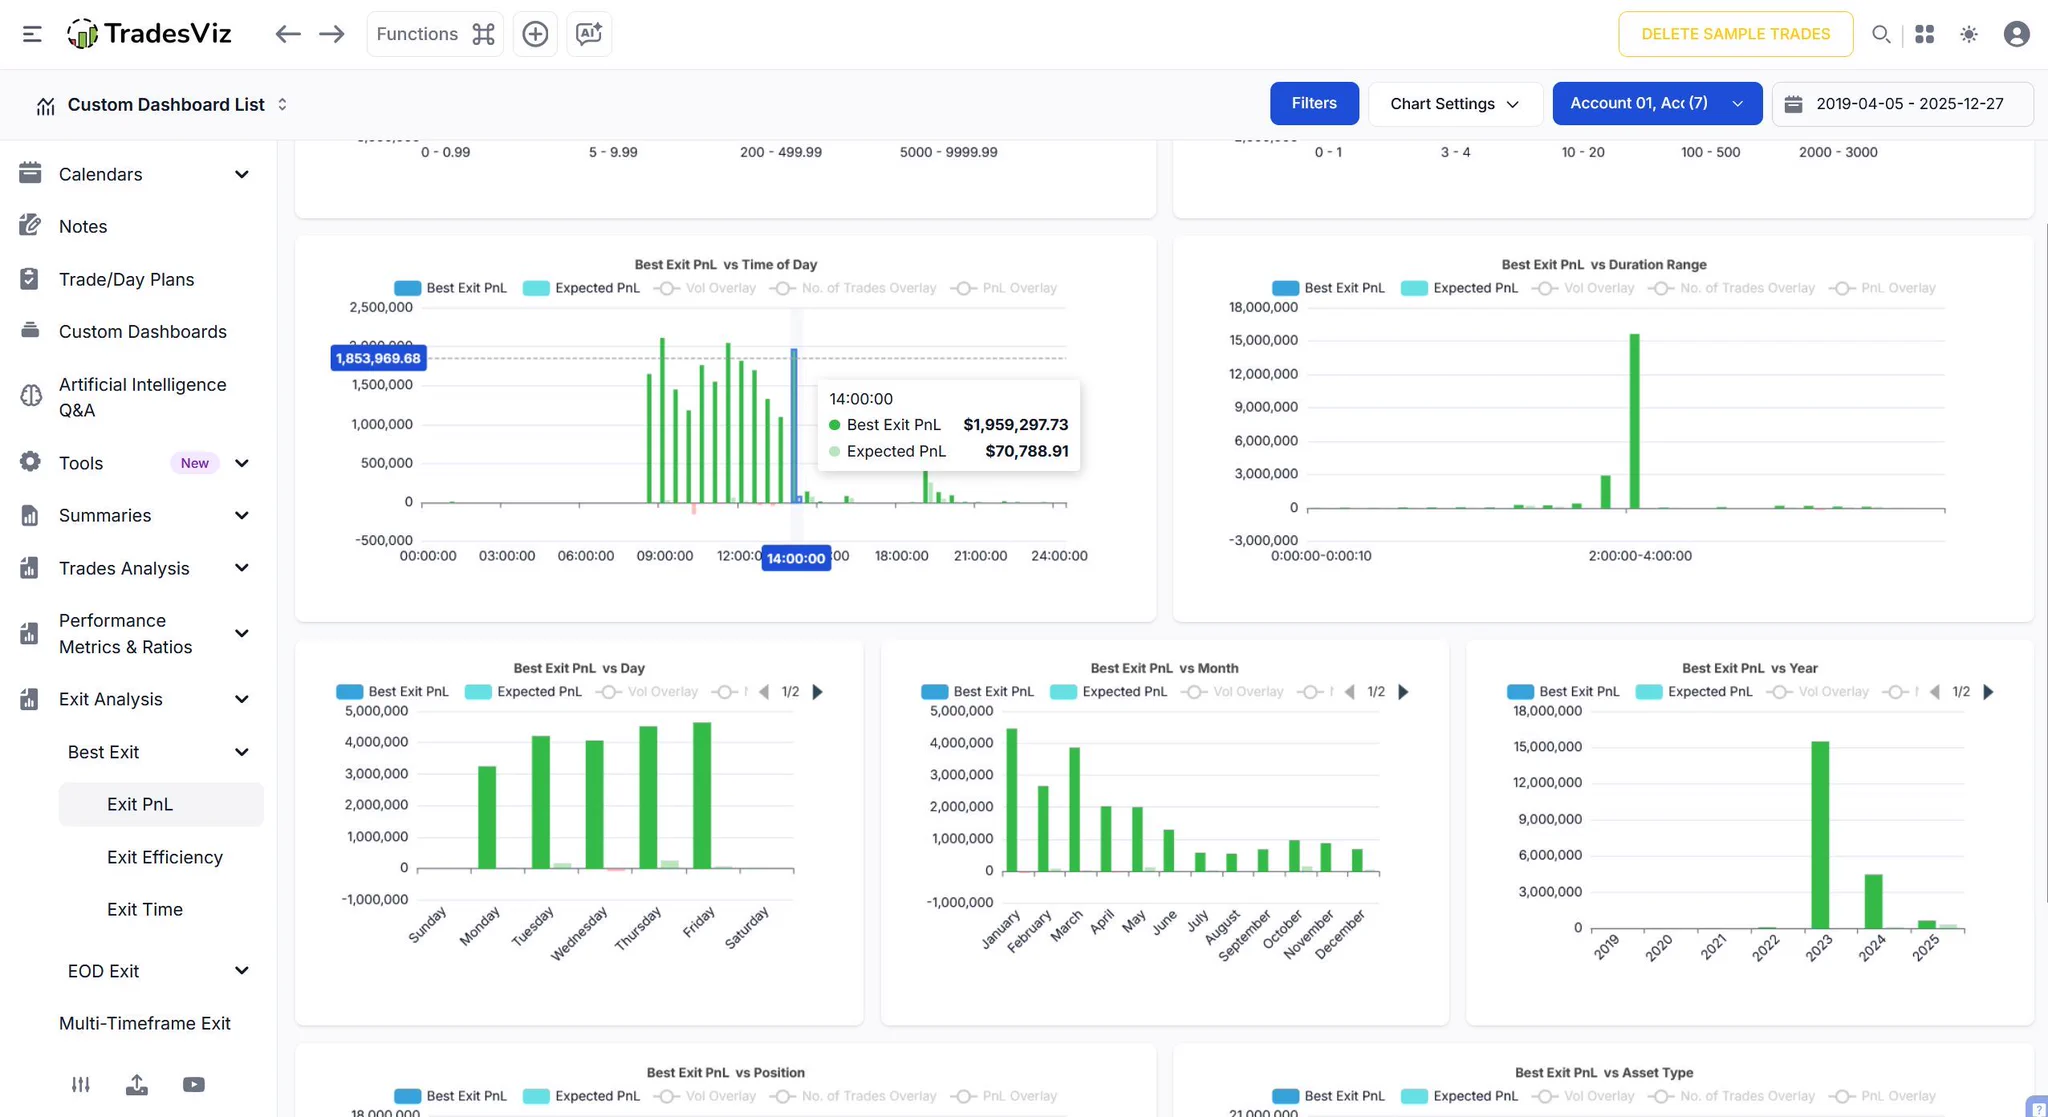
We’ve all had those trades - the ones we wish we had added to, or cut just a little sooner.
But how do you actually find them? 👀
Simple. Head to your Exit Analysis in TradesViz and:
1️⃣ Check the Best Exit PnL per Month - see where bigger wins could’ve been captured.
2️⃣ Review Trades with the Worst Running PnL - learn where to tighten your exits next time.
Two clicks. Endless insight. 💡
Open your Exit Analysis Dashboard in TradesViz and uncover the lessons hiding in your charts 👇
The options flow for the previous week shows strong institutional activity concentrated in $NVDA and $STX, with a clear bullish bias driven by large call sweeps ahead of the January 16, 2026 expiration.
$NVDA led the flow with multiple high-value call buy sweeps between the $49.50 and $50.50 strikes. The largest order totaled $140M with 10,430 contracts, followed by several $70M, $38M, and $37M trades, indicating sustained demand in semiconductor names. While a few sell sweeps appeared at similar strikes, buying pressure remained dominant throughout the sessions.
$STX followed closely with continuous call sweeps at the $115 strike, including major trades worth $83M, $62M, and several between $48M and $41M each, reflecting strong bullish interest targeting mid-January. Additional smaller trades at $100 and $140 strikes confirmed broad participation in the stock’s upward trend.
Other notable flows included a $33M call buy sweep on $AAPL at the $195 strike, showing tech-wide involvement, and a $27M call sell sweep on $RCL at the $145 strike, hinting at profit-taking in travel names.
It’s not just a journal. It’s a complete trading ecosystem.
• Simulator & Risk Mgmt • AI Q&A & Analytics • Seasonality & Fundamentals • Advanced Screener & Journaling
Everything you need to master the markets in 2026.
🎁 Get 25% + 30% OFF with code: TVNEWYEAR26TradesViz | Trading Performance Analysis (@tradesviz)Master your strategy before risking a single dollar. 💡📈
The Advanced Trading Simulator in TradesViz gives you a realistic, risk-free environment to test ideas, refine entries and exits, and analyze your performance
All powered by advanced analytics and trade journaling.
Perfect your edge, practice smarter, and trade with confidence when markets open.
Explore the Trading Simulator in TradesViz and take your strategy to the next level 👇—
Level up your trading skills with advanced journaling tools - all in one place. ⚡📊
✅ Trade Replay - Watch your past trades play out automatically, anytime, any timeframe.
✅ Trading Simulator - Practice executions manually, just like on a live platform - risk‑free.
✅ Strategy Backtester - Test your setups instantly and see how they perform in real market conditions.
Whether you’re learning, refining, or testing - TradesViz gives you everything you need to grow as a trader.
Explore these tools on TradesViz today and take your trading game to the next level 👇
A full year of trading - captured at a glance. 📆📊
The Calendar - Year View in TradesViz turns your entire trading year into a visual timeline.
Instantly spot your best months, identify slow periods, and track performance trends with a single sweep.
Every green and red block tells the story of your journey - progress, lessons, and growth, all in one snapshot.
Step back, zoom out, and see how far you’ve come.
Open the Year View Calendar in TradesViz and visualize your trading year like never before 👇
Spot your trading rhythm across time. ⏰📊
The Trade Analysis - Date Charts in TradesViz reveal how your performance evolves day by day, week by week, or month by month.
Instantly see when you trade best, identify peak performance periods, and uncover patterns in consistency or volatility.
It’s your entire trading timeline - visualized and ready to guide smarter decisions.
Meet your new trading copilot. 🤖💬
The AI Trade Chat in TradesViz lets you talk directly to your data.
Ask questions like “What were my top 10 earning trades in 2023?” or “Show me my win rate by symbol last month.”
Get instant answers, detailed stats, and insights - all generated from your actual trading history.
No filters, no reports, just real‑time analysis through simple conversation.
Smarter journaling starts with smarter questions.
The way you understand and visualize data is very personal in trading.
It can only come from experimentation and iterations.
TradesViz helps you do this by leveraging AI and an extremely customizable UI: Best of both worlds.
✅TVNEWYEAR26 -> 25%+30% Discount
Try it! :)
See your options strategy from every angle. ⚙️📊
The Options Analysis in TradesViz breaks down your trades by the Greeks.
Delta, Theta, Gamma, Vega, and Rho - to show exactly how each factor impacts your win rate.
Identify which setups perform best under specific conditions and refine your strategy with data‑driven precision.
It’s the smarter way to trade options - powered by deep analytics and full customization.
With access to data and advanced analytics on TradesViz, it's easier than ever to broaden your scope of trading.
What's this chart?
It's 14-day price change (x-axis binned groups) vs your stats (pnl, vol, count, WR)
Why is this useful?
Are you good at trading stocks trending? or moving down? staying flat?..
No tags, just simple, useful analytics by combining different sets of data.
Only on TradesViz.
TVNEWYEAR26 -> 25% + 30% Total Discount.