🔥 Get ~50% OFF !
Test your risk-reward balance before risking a cent. ⚖️📊
The Stop Loss / Profit Target Simulator (TVNEWYEAR26 🎟️) lets you experiment with different stop-loss and take-profit levels.
Instantly showing how each setting impacts your overall results.
Adjust, simulate, and compare side by side to find the sweet spot between protecting profits and minimizing losses.
Smarter testing. Sharper execution. Better consistency.
Try the Stop Loss / PT Simulator in TradesViz and see how small tweaks can make a big difference 👇
🚀 2025: The year we redefined Trade Journaling. Again.
While "competitors" have been stagnant for a decade, TradesViz has shown more progress in the last 4 years than the entire industry combined in the last 10.
We don't just track trades; we build your edge.
Here is the 2025 breakdown. 🧵👇
We ended the year with features others haven't even dreamt of.
AI Trade Chat & Options Command Centre. • Natural Language Queries ("What's my win rate on Mondays?") • Psychology Journal to track FOMO • Multi-leg Running PnL tracking
This isn't just journaling. This is a quant researcher in your corner.
We are moving at a pace the industry can't match. And 2026 is going to be even bigger.
Stop settling for outdated tools. Join the platform that evolves as fast as the market.
🎉 YEAR END OFFER: Get TOTAL 50% OFF your subscription.
Code: 𝗧𝗩𝗡𝗘𝗪𝗬𝗘𝗔𝗥𝟮𝟲
Full Changelog here:
Need ideas for new year trading? Check this 👇
Plenty of opportunities to learn, execute, and profit.
TradesViz + EZstockscreener combines world's best journaling system, advanced AI analysis, stock screening, replay, backtesting, simulator, and more - for *pennies* per day!EZstockscreener (@ezstockscreener)Symbols that are up more than 30% in last 30 days: 180+
The options flow for December 31, 2025 shows concentrated institutional activity led by heavy sweep orders in $NTR, $NOW, and $DE, with strong participation across technology, industrial, and commodity-related names.
$NOW posted the largest sweep of the session with a $38M put buy at the $232 strike expiring January 16, 2026, suggesting short-term bearish or hedging exposure. $NTR followed with multiple call buy sweeps totaling over $100M in premium across $50, $52.5, and $55 strikes, showing aggressive long bets into mid-January.
$DE recorded back-to-back $12M call buy sweeps at the $185 strike for the same expiration, while smaller but steady call buying appeared in $TFII and $ETHA, each around $8.5M, reflecting broad bullish flow across industrial and energy-related names.
$GOOGL saw a notable $12M put sell sweep at the $310 strike expiring February 6, 2026, indicating optimism into early Q1 earnings season. $USB had both buy and sell sweeps near the $50 strike, implying mixed sentiment or adjustments to existing positions.
Overall, the December 31 options flow highlights strong call-focused buying in $NTR and $DE alongside key hedge activity in $NOW, signaling active portfolio positioning as institutional traders closed out 2025.
The options flow screener for December 31 2025 shows a sharp rise in the put call ratio of premium for the second consecutive day, signaling increased hedging and defensive positioning ahead of the new year.
$XBI led with a 4060.67 percent jump to a ratio of 21, reflecting heavy bearish or protective activity in biotechnology. $SNOW followed with a 10250.12 percent rise to 5.2 and $CLS climbed 4821.16 percent to 4.5, both showing large option volume spikes. $GME increased 2265.01 percent to 12 while $TTD and $MP each advanced more than 1400 percent, showing renewed volatility in tech and materials.
$HUT gained 4831.6 percent to 3.3, $ULTA moved 280.39 percent higher to 8.3, and $NNE rose 1715.23 percent to 3.3, indicating broader defensive positioning across sectors.
The $XBI chart shows rising put premium activity alongside a price pullback, confirming increased demand for downside exposure.
Overall, the December 31 screener highlights a strong shift toward bearish or protective sentiment led by $XBI, $SNOW, and $GME as traders close out 2025 and prepare for early 2026 volatility.
The stock screener for December 31, 2025 highlights a strong finish to the year with several small and mid cap names posting substantial one day price jumps and sustained multi day volume growth.
In the category of stocks with more than a 20 percent increase in price in the last day, $BNAI led with a 108.8 percent surge to 2.50 on massive 149.99M volume, up 100,903.2 percent. $SOPA followed with a 61 percent jump to 2.93 and 152.18M volume, reflecting heightened speculative interest. $GVH rose 36.9 percent on over 18M shares traded, and $SIDU gained 33.2 percent to 2.57. $THH advanced 32.2 percent to 22.39 with a 447.4 percent volume increase, while $ZIVO added 29.1 percent and $TROO climbed 26.9 percent. Rounding out the list, $STI gained 22.1 percent, $SLGB increased 21.6 percent, and $HIT added 20.9 percent, reflecting widespread short term bullish sentiment.
In the continuous volume increase for four days group, $SHIM led with a 19.5 percent rise to 3.18 and an 855 percent surge in volume to 79.01K shares. $PHXE-P followed with a 1.1 percent gain to 20.68, while $ABLD and $RWLC rose modestly by 0.9 and 0.8 percent respectively. $VSMV, $IBII, and $XNOV all maintained stable momentum with small price changes but steady activity, while $PFFL, $ROAM, and $SMN held mixed results, indicating selective continuation patterns.
Overall, the December 31 screener reflects strong year end upside momentum led by $BNAI and $SOPA, alongside consistent participation signals in smaller tickers showing persistent volume growth.
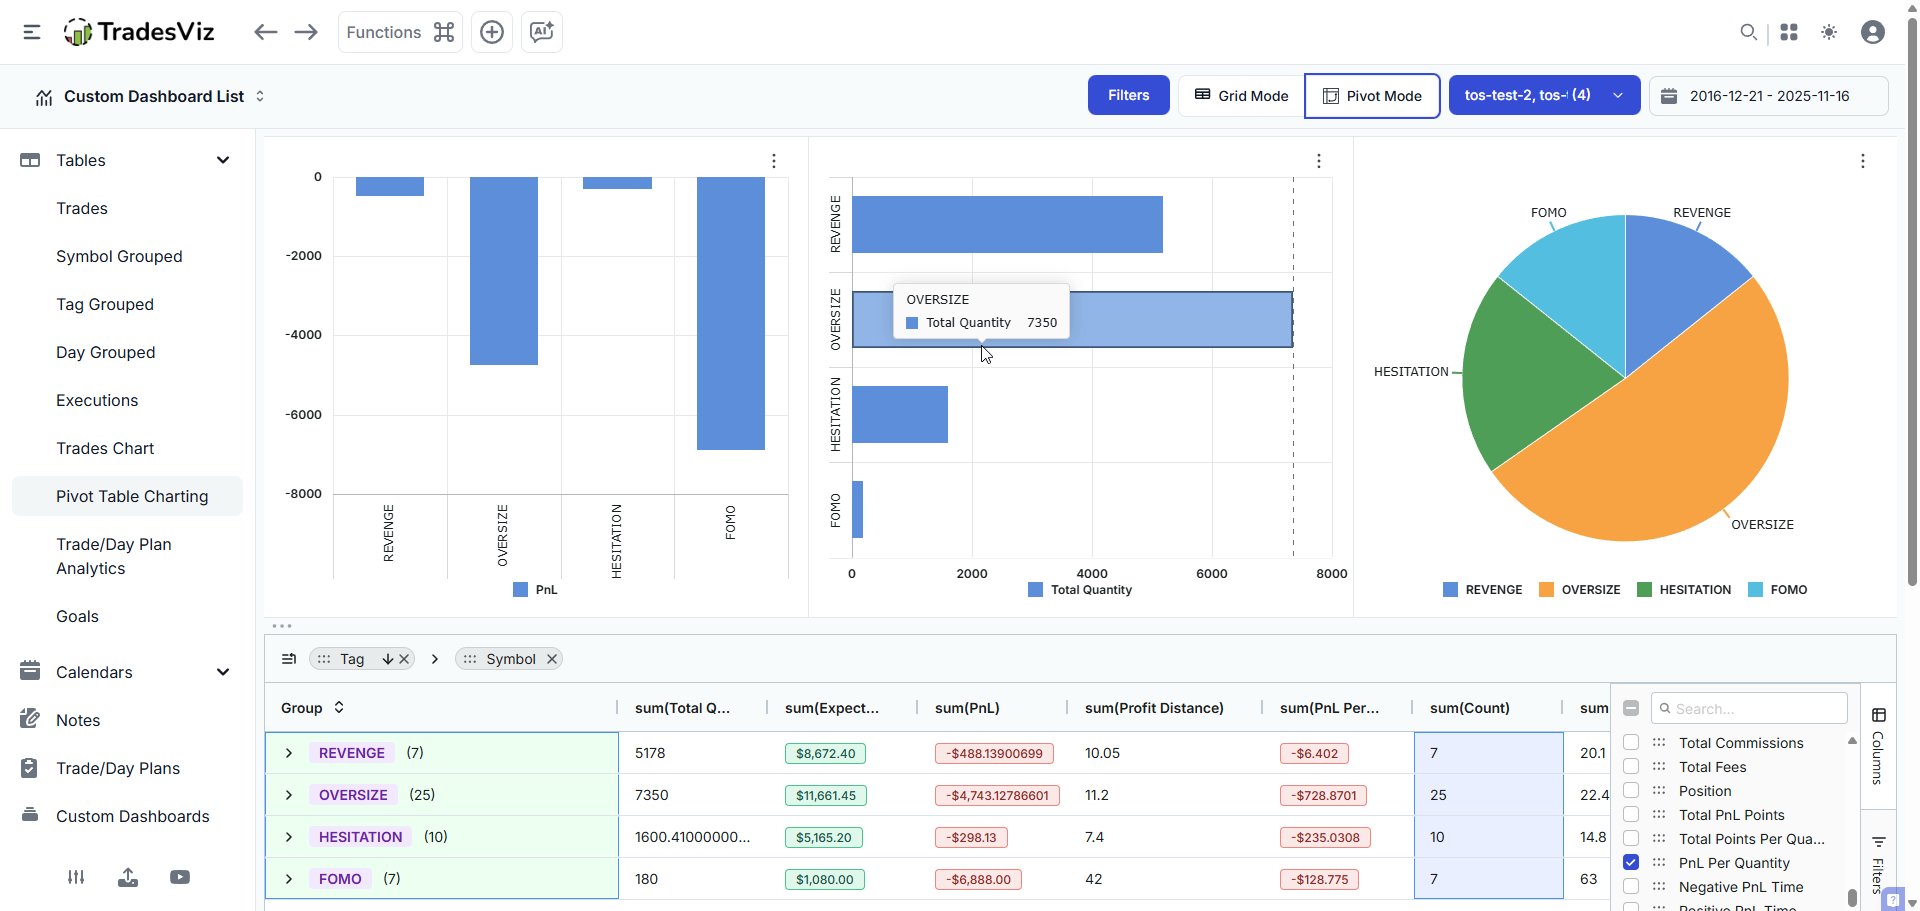
How you understand, visualize, and optimize your data is personal in trading.
It comes from experimentation with what works and iterations of how to improve results.
Goals, targets, and plans are great—but useless if you don't follow through. 📉
The top 10% of traders aren't just lucky. They track everything.
🔥 Last 6 Days: Get ~50% OFF Code: TVNEWYEAR26
Even when you fail, tracking why it happened puts you miles ahead of the trader who is just guessing.
End this year planning on TradesViz, and begin next year executing with precision. 🎯