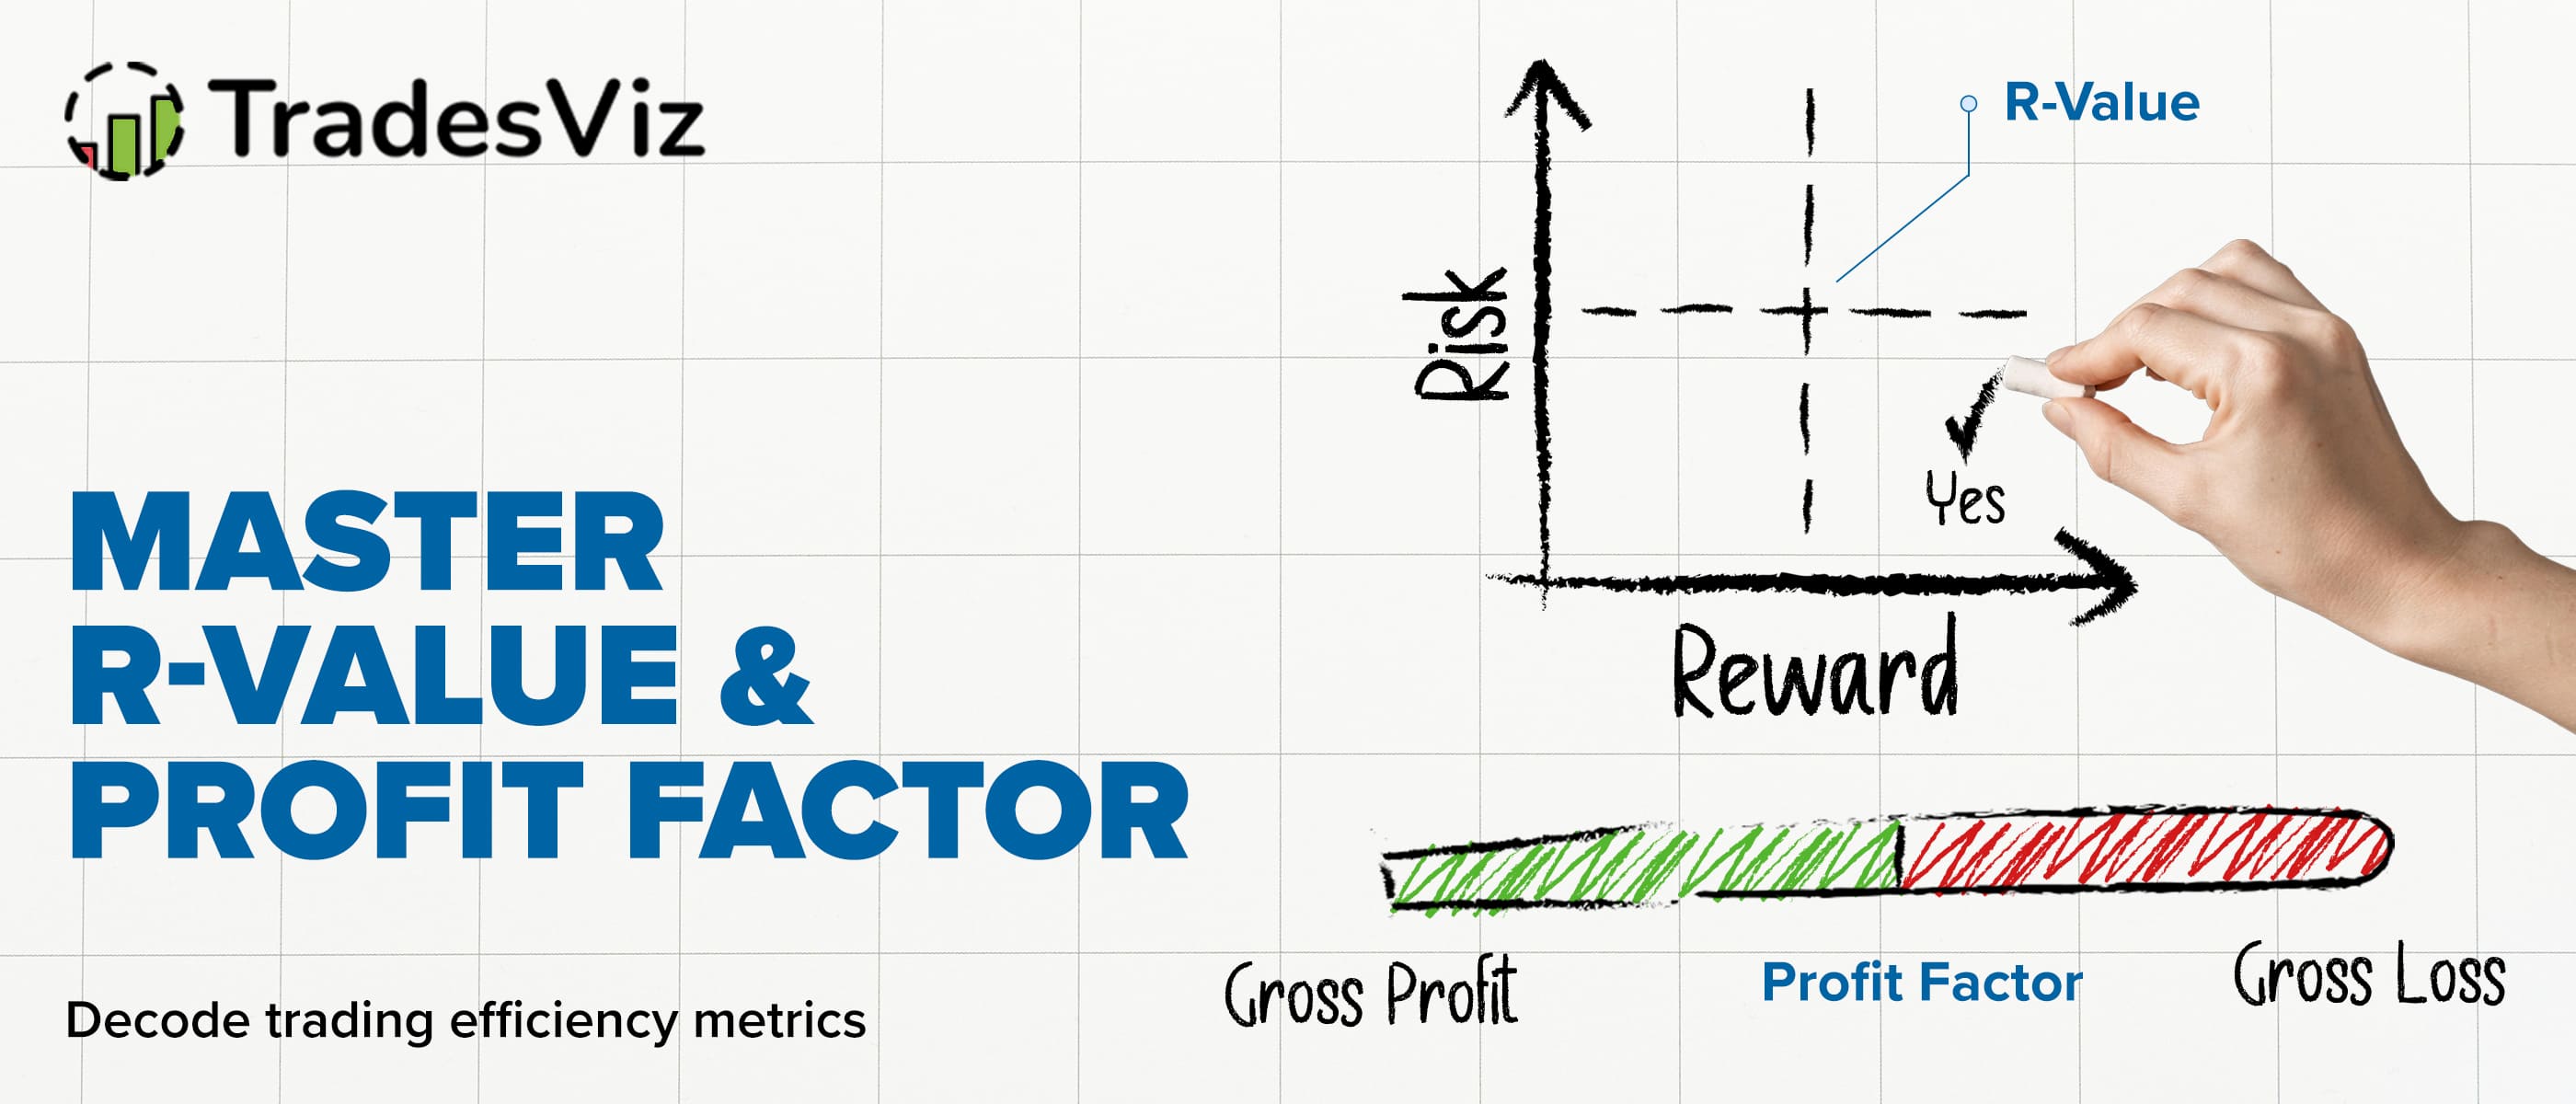
The Metrics That Actually Matter
Most traders obsess over their win rate, believing that winning 70% or 80% of their trades guarantees success. Here's a sobering reality: you can have a 90% win rate and still blow up your account. Conversely, some of the world's most successful traders maintain win rates below 40% while generating exceptional returns year after year.
The secret? They focus on what truly matters: R-Value (R-Multiple) and Profit Factor – two metrics that reveal the actual health and profitability of your trading system.
R-Multiple represents the return on your investment expressed as a multiple of your initial risk. At the same time, Profit Factor is a ratio that compares the total profits generated by winning trades to the total losses incurred by losing trades. Together, these metrics provide a complete picture of your trading performance that a win rate alone could never reveal.
This comprehensive guide will show you exactly how to analyze, track, and optimize these critical metrics using TradesViz's powerful suite of tools. Whether you're a day trader, swing trader, or long-term investor, mastering R-Value and Profit Factor analysis will transform how you evaluate and improve your trading performance.
Demystifying R-Value – The True Measure of Reward vs. Risk
What Is R-Value and Why It Changes Everything
1R is our ideal amount of risk – it is how much we want to risk on a trade; put another way, how much we are willing to lose on a trade
. Think of it as your standardized unit of risk that allows you to compare all trades on an equal playing field, regardless of position size or dollar amount.
Let's break this down with a practical example:
- You buy 100 shares of AAPL at $150 with a stop-loss at $145
- Your risk per share is $5
- Your total risk (1R) is $500 (100 shares × $5)
Let's take 3 example scenarios:
Scenario 1:
- If the trade hits your profit target at $165, you make $1,500 -> This is an R-value of 3 -> You've gained 3 times the amount you've risked.
Scenario 2:
- If the trade hits your stop loss at $145, you lose $500 -> This is an R-value of -1 -> You've lost exactly the total amount you've risked.
Scenario 3:
- If you exit the trade at $150 (between your stop and profit), you make $500 -> This is an R-value of 1 (shown below) -> You've gained exactly the amount you've risked.
This exact trade is visualized below in TradesViz's trade explore page:
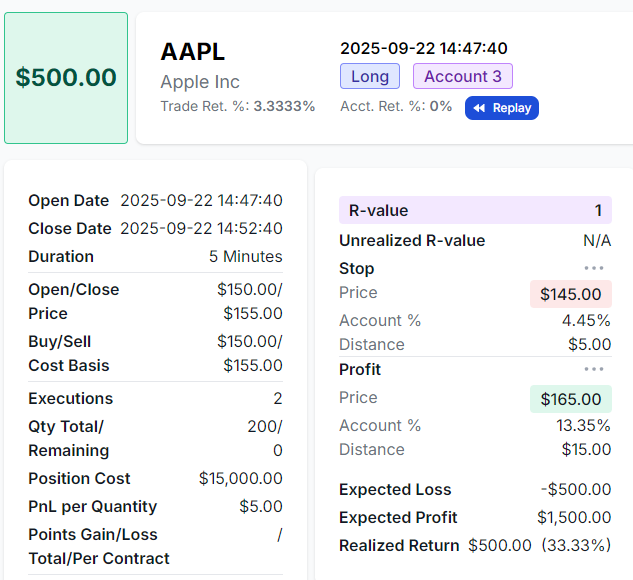
This entire guide is going to be filled with examples straight from the TradesViz dashboard - examples that you can see, experiment with, and learn from. In the above example, one common question we get is, once the trades are imported, why is the R-value "NA"? That's because you need to fill in a stop loss to generate the R-value. TradesViz offers multiple ways to easily add stop loss and profit targets to your trades:
- Use the group apply function to add it to many trades at once
- Use a custom stop loss/profit target profile to apply to the entire account and to all new trades automatically
Why R-Value Is Your Trading Game-Changer
The power of R-Value lies in its ability to normalize your results. If strategy results are expressed in terms of R, traders can calculate their potential profit based on their own account size and risk tolerance. This means whether you're trading with $100 or $100,000, R-Value provides a consistent framework for evaluating performance.
Consider two trades:
- Trade A: Risk $100, make $300 = +3R
- Trade B: Risk $1,000, make $1,500 = +1.5R
Despite Trade B generating more dollars, Trade A was actually the superior trade from a risk-adjusted perspective. This is why professional traders think in R-multiples rather than dollar amounts.
Tip: Did you know you can view your entire TradesViz dashboard in R-value (or points or ticks, in addition to PnL)?
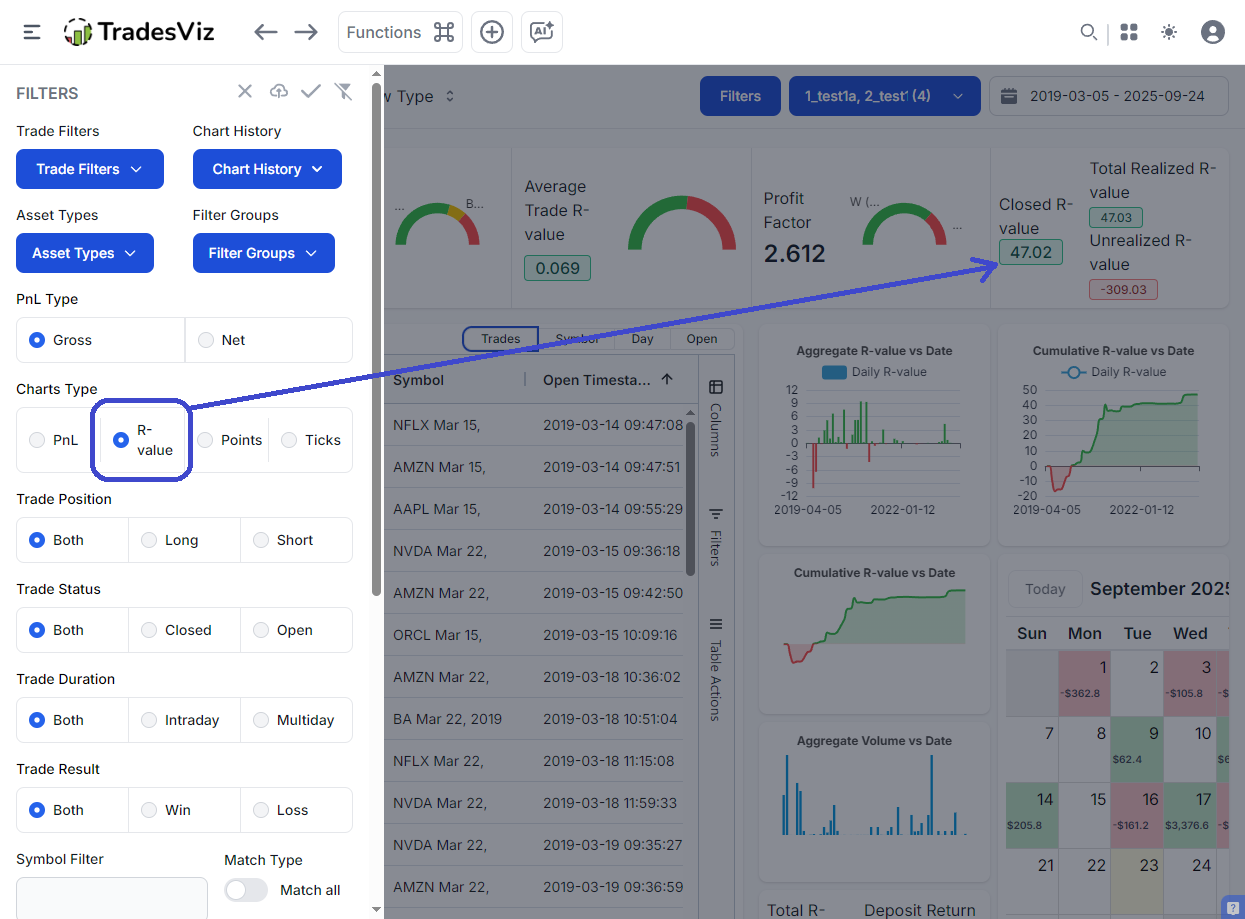
You can also view your calendar in R-value instead of PnL. This will only show trades that have R-value - so don't be surprised if you see an empty dashboard if you did not have any trades without a stop loss ;) (BTW, why are your trades without a stop loss? ...)
Finding and Analyzing Your R-Value in TradesViz
Instant R-Value Analysis with General Statistics
Now, assuming you've added stops for most of your trades, TradesViz makes it easy to get your total/overall metrics in R-value using the Statistics tab. Start by navigating to your Summary > General Statistics tab, where you'll find your "Average R-value" in the Scores/Metrics tab.
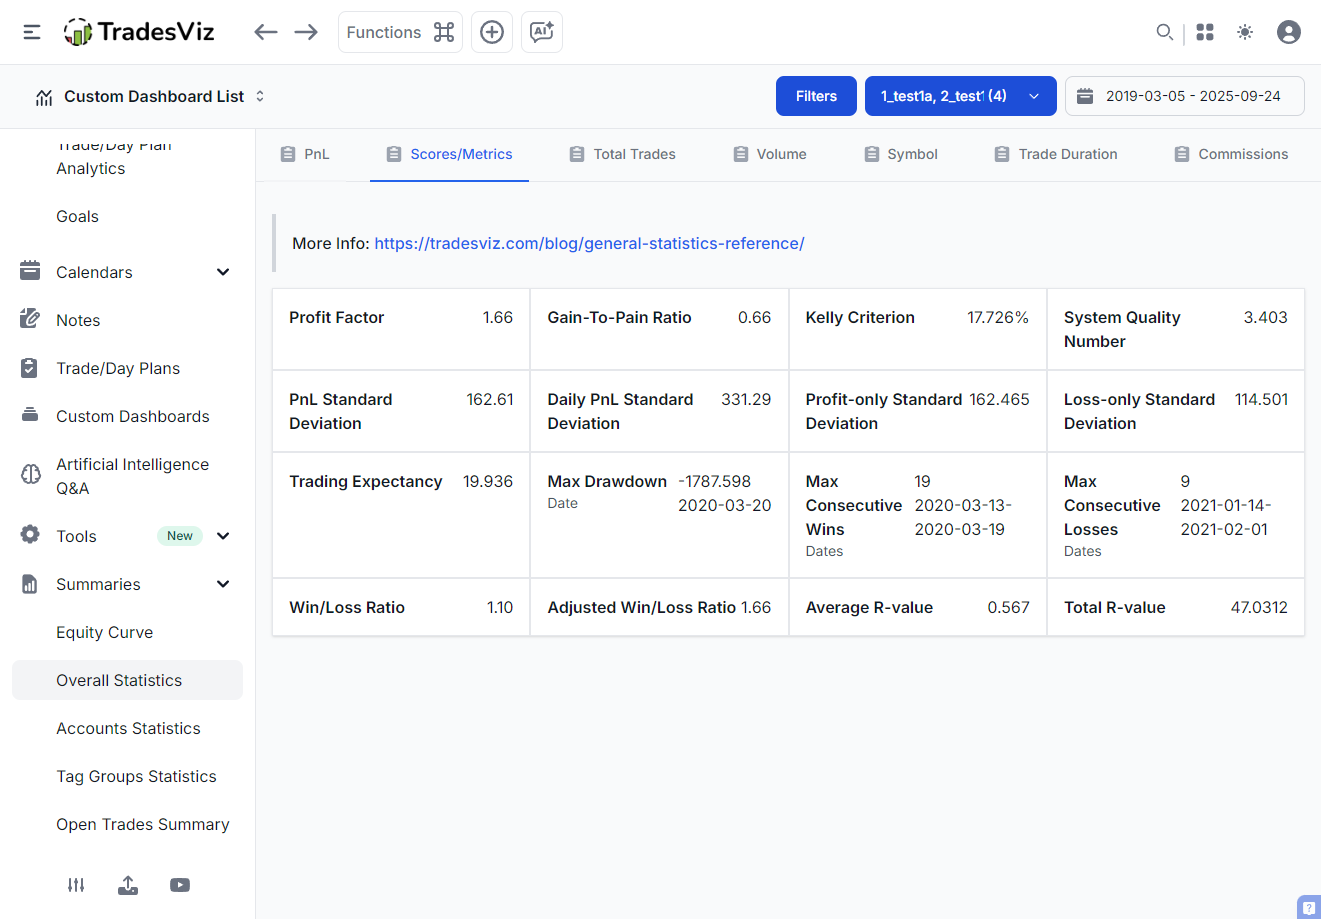
What to Look For:
- Average R-value > 2R: Excellent risk-reward management
- Average R-value 1-2R: Solid performance with room for improvement
- Average R-value < 1R: Critical need for strategy adjustment
The General Statistics page doesn't just show you a number - it provides context on what you can look to improve. You'll see how your R-Value trends over time, helping you identify whether your trade quality is improving or deteriorating.
Speaking of trends... have you *visualized* how your R-value trend changes over time? Probably not if you were not on TradesViz.
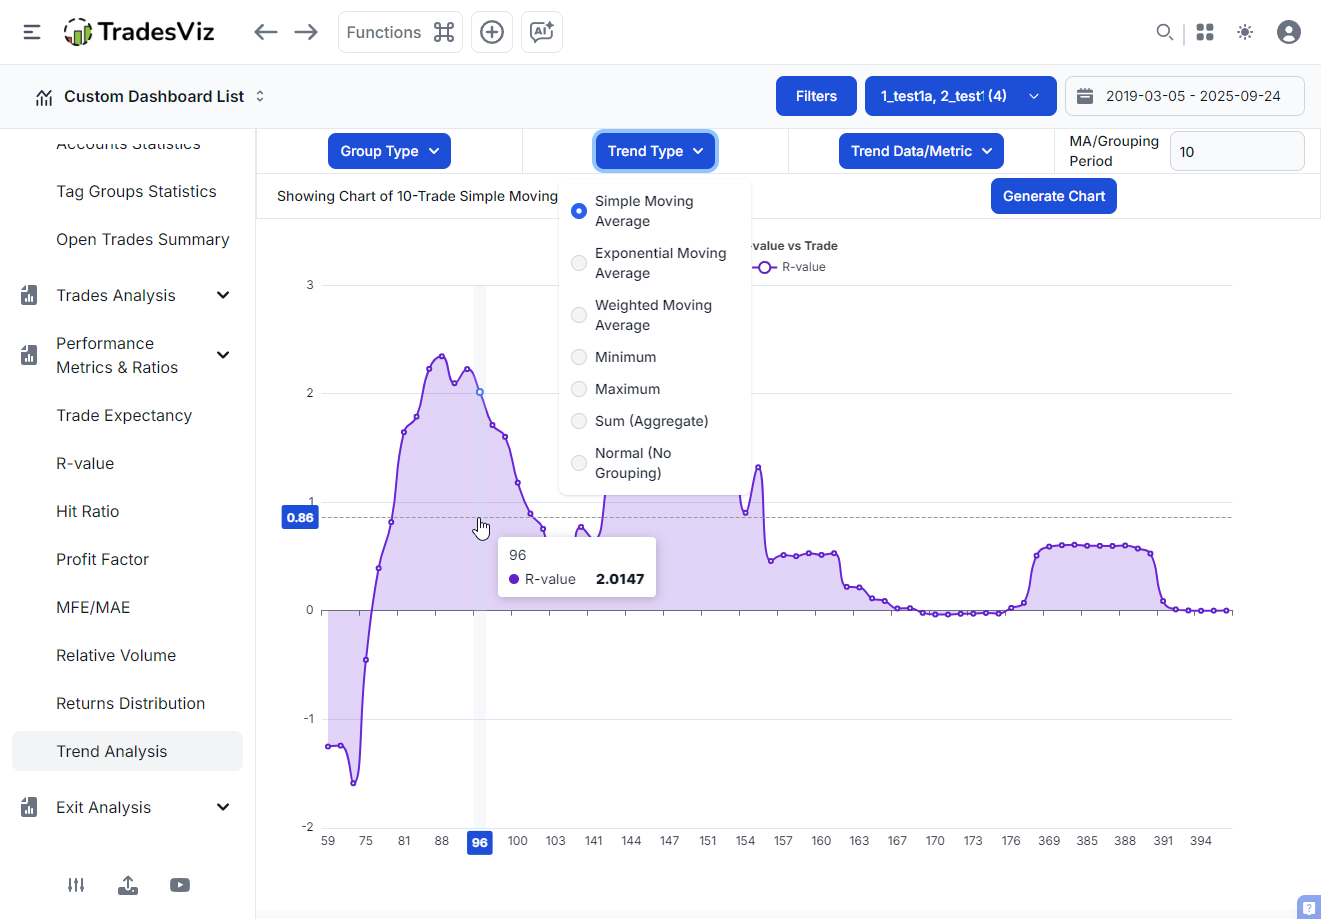
TradesViz trading journal's trend analysis tool helps you do exactly this for R-value (and for many other trades) on a per-trade or even per-day basis. But what does this mean?
The above screenshot shows an example of SMA of R-value (Y-axis) of trades over time (X-axis is no. of trades -i.e, trade 1, trade 2, trade 3, and so on). What does the rising curve indicate? It means the moving average of R-values of trades of that period has been increasing.
What about the slope after that? That is when our R-value per trade dropped, so the larger R-values are no longer in the moving window, so the average of the window gets smaller and smaller. What does this translate to? degraded performance.
Without these visualizations, you would not even notice your performance dropping. This is why TradesViz is essential if you want to truly understand AND track your trading.
Visualizing R-Value Patterns with Advanced Charts
The Charts & Statistics section transforms your R-Value data into powerful visual insights. TradesViz has pre-build charts for R-value under the performance metrics and ratios section.
- R-Value by Day of Week: Discover if your Monday trades consistently underperform
- R-Value by Time of Day: Identify your peak performance hours
- R-Value by Duration: Compare performance in shorter vs longer duration trades
- R-Value Distribution: See the spread of your winners and losers
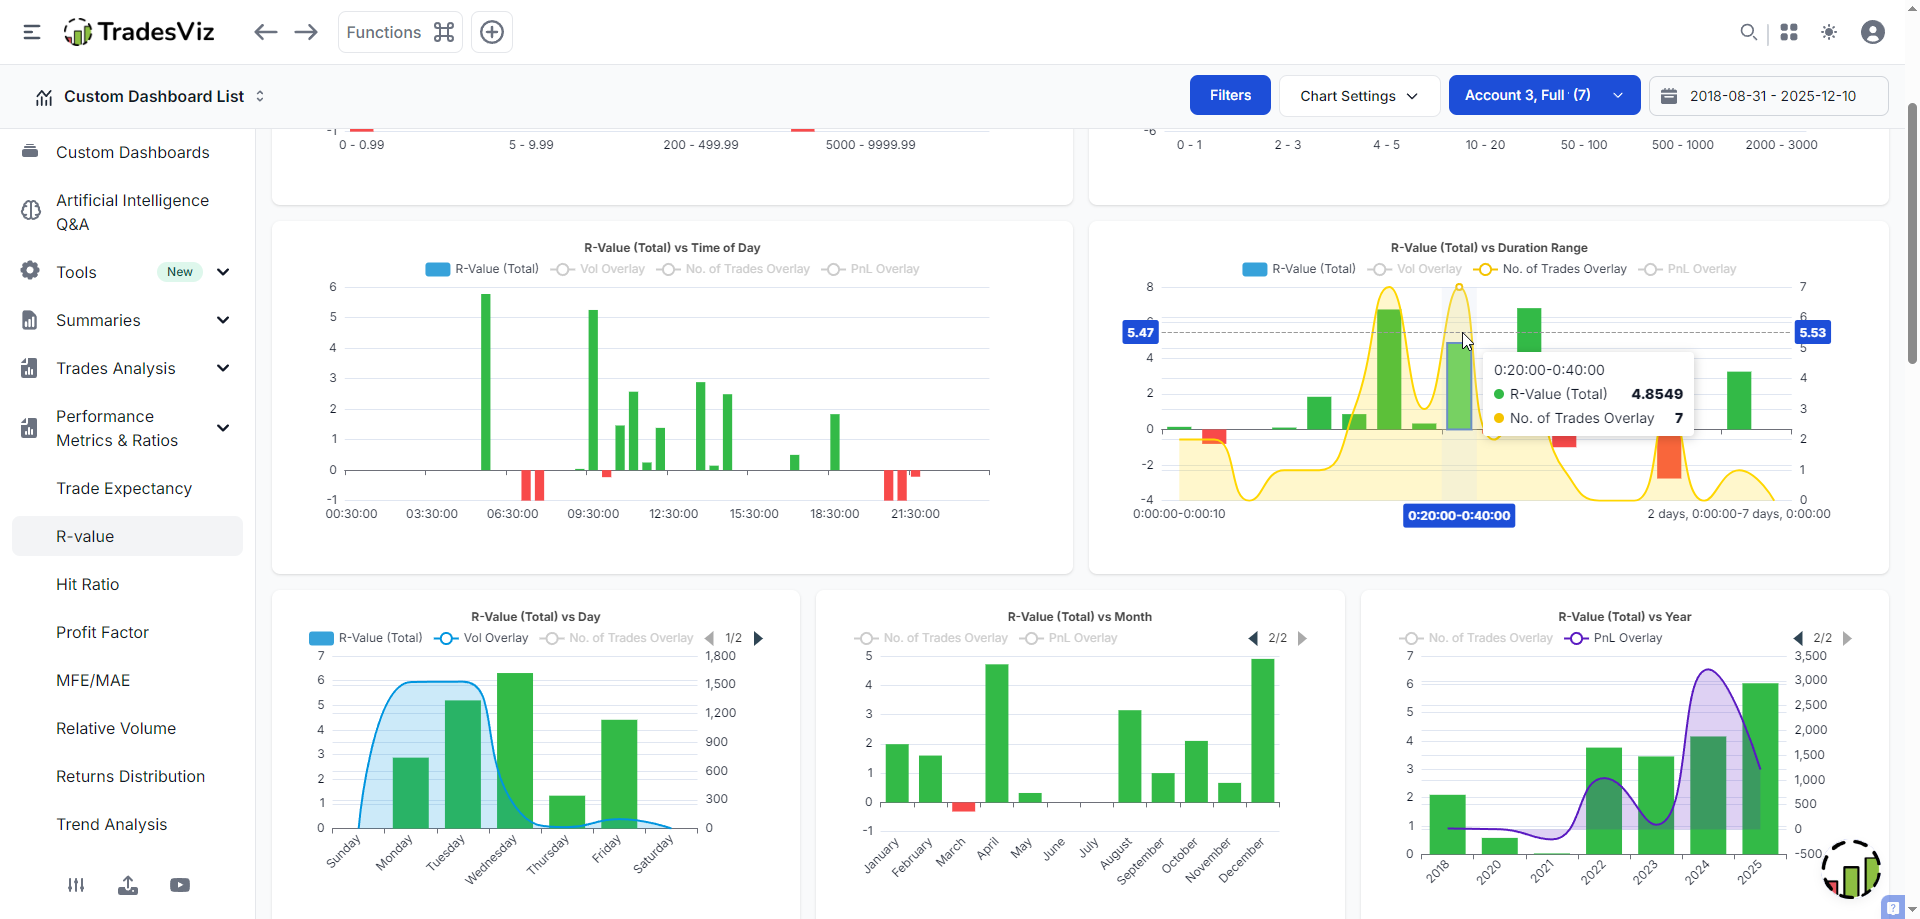
The important part to notice is that each of these charts has overlays (no. of trades, volume, pnl) that can give you additional context. Here are a few insights from the above example:
- Why do we have much higher volume on Monday and Tuesday, but the R-value is much bigger ratio-wise for the other days?
- Notice the higher pnl, lower total R-value in 2024, but inverse in 2025 - what changed?
- The trend of the R-value gets lower as the day progresses - is our quality of trades decreasing?
etc.,
TradesViz trading journal makes it easy to add R-values, analyze, and understand how R-value metrics correlate to your performance. Every chart and function you see in your dashboard is refined for efficiency and utility.
The Power of Pivot Grid for Deep R-Value Analysis
This is where TradesViz trading journal truly shines. The Pivot Grid feature allows you to slice and dice your R-Value data in ways that would take hours in a spreadsheet.
Advanced Pivot Grid Analysis Example:
Let's say you want to compare R-Values across different setups or strategies on different days of the week. Here's how:
- Open the Pivot Grid from your Tables section in the sidebar
- Drag "Tags" to the Row area
- Drag "R-value" to the Values area
- Drag "Day" to the Column area
- Add filters for specific date ranges or symbols (optional)
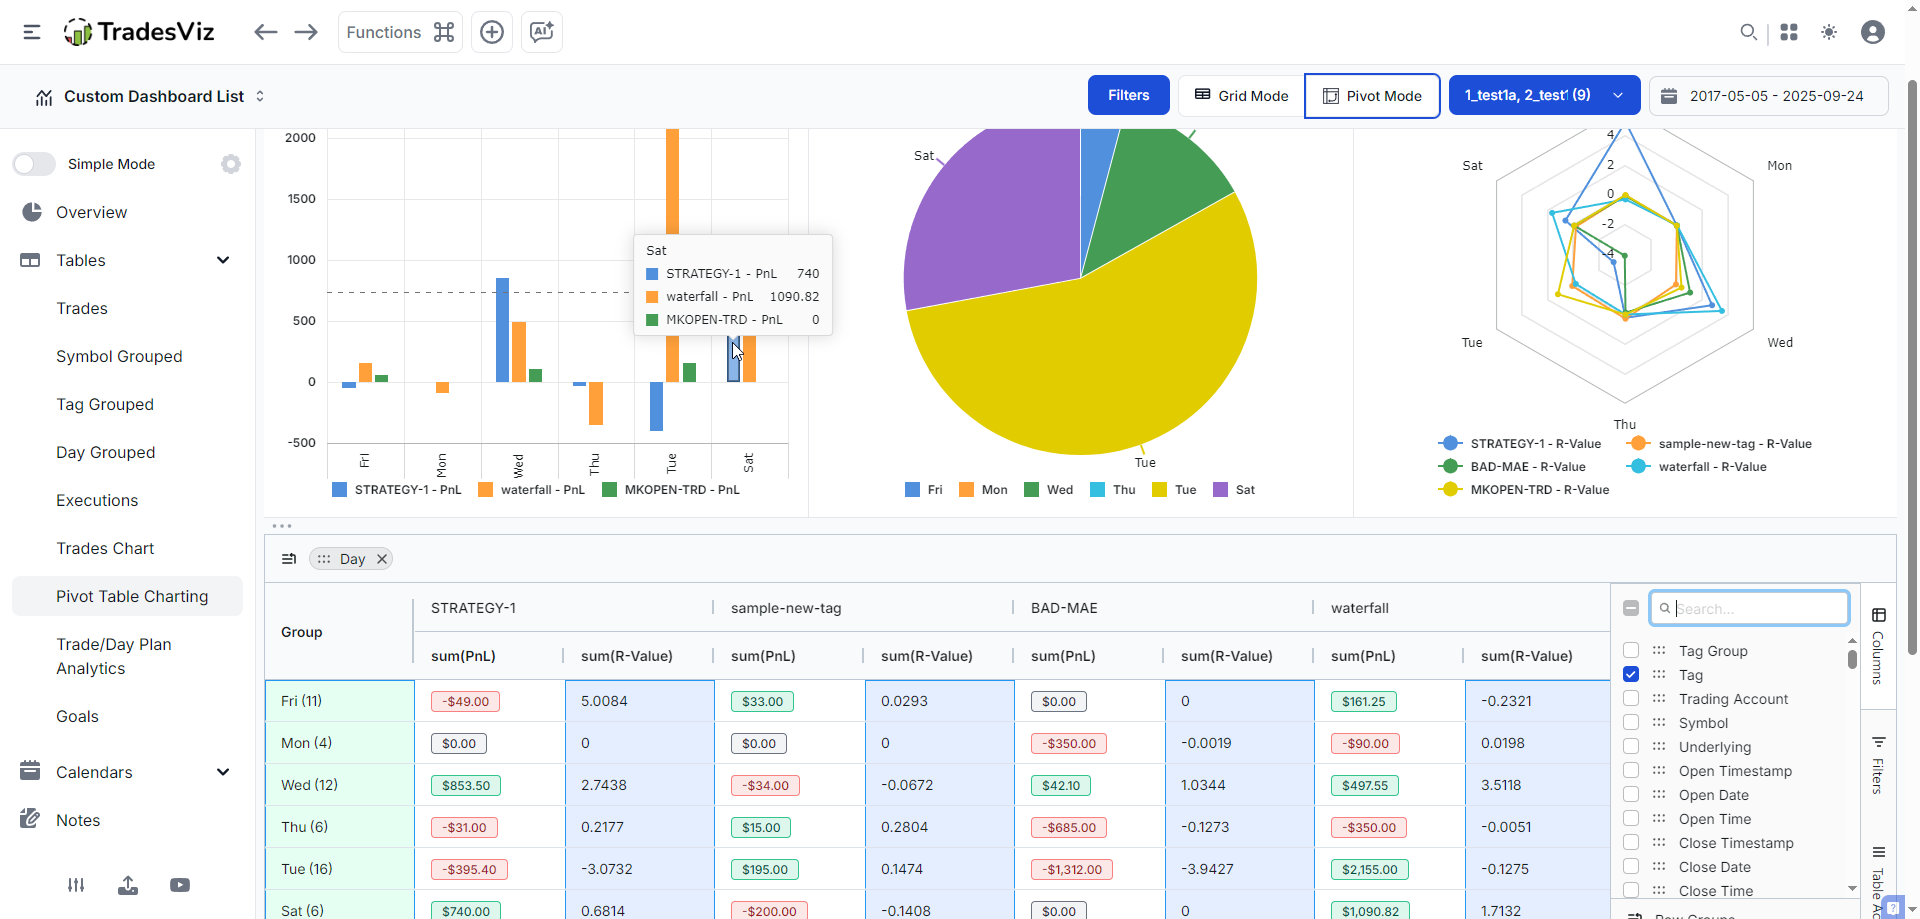
What are we seeing in the above charts?
The table shows you a breakdown of each pnl on each day of the week, pivoted by the tag. You can also include multiple numeric columns (we have a dedicated blog post exploring the pivot grid, so you can check that later). The charts above the table are visualizations that you can choose to visualize the stats of the table. From the left, we have a barchart of the pnl of tags (as classes) plotted versus day of week, then a single tag's pnl in a pie chart, all tags' R-values versus the day in a Radial (radar) chart.
Example insight: Wednesdays are where our profits are at!? or... it? Well, the surface analysis based on looking at the table and the radial chart says that Wednesdays are overall better, but your anlaysis should not stop here. This is a single insight. Start and keep exploring to find the answer you are looking for.
This granular analysis reveals which setups truly drive your profitability, allowing you to focus on high-R-value opportunities and eliminate or improve underperforming strategies. While tags or strategy or setup analysis on every other journal is limited to simple pnl or win-rate charts, we've gone beyond that here at TradesViz.
These types of analytics and insights are only possible on the TradesViz trading journal. None of the overpriced alternatives are even close to this level of useful insights or analytics, despite costing traders upwards of $500 or $600 per year, which... is outrageous.... Whether you are a new trader or if you've been on the trader journey for a while, learn to look for value. This is what we focus on at TradesViz: What can we do to help traders? What more can we provide to help traders be more profitable?
With pivot grids, you can visualize any stats/metrics associated with a trade on the TradesViz trading journal. The goal is to provide you with visualizations that help you understand - not just throw a 100 charts at your screen. Of course, you can use AI query to ask even more specific questions and get personalized results, but the path to growth in trading starts with learning to analyze -> understanding -> applying your learnings, -> improving. As long as you take sufficient effort to do this, you are setting yourself up for consistent, longer-term success - this is our goal for all our users.
Advanced topics and applications related to R-value
What you've seen so far is basic to intermediate anlaysis. In-depth anlaysis comes from identifying exactly what your goals are, finding the right stats you need to monitor to improve performance.
Example: Best exit analysis, but using R-values
Best exit analysis is a well-explored and frequently used concept and metric in TradesViz. It measures how much you could have made by moving the last execution forward in time while respecting your max risk during the trade. R-value can also be combined with this concept.
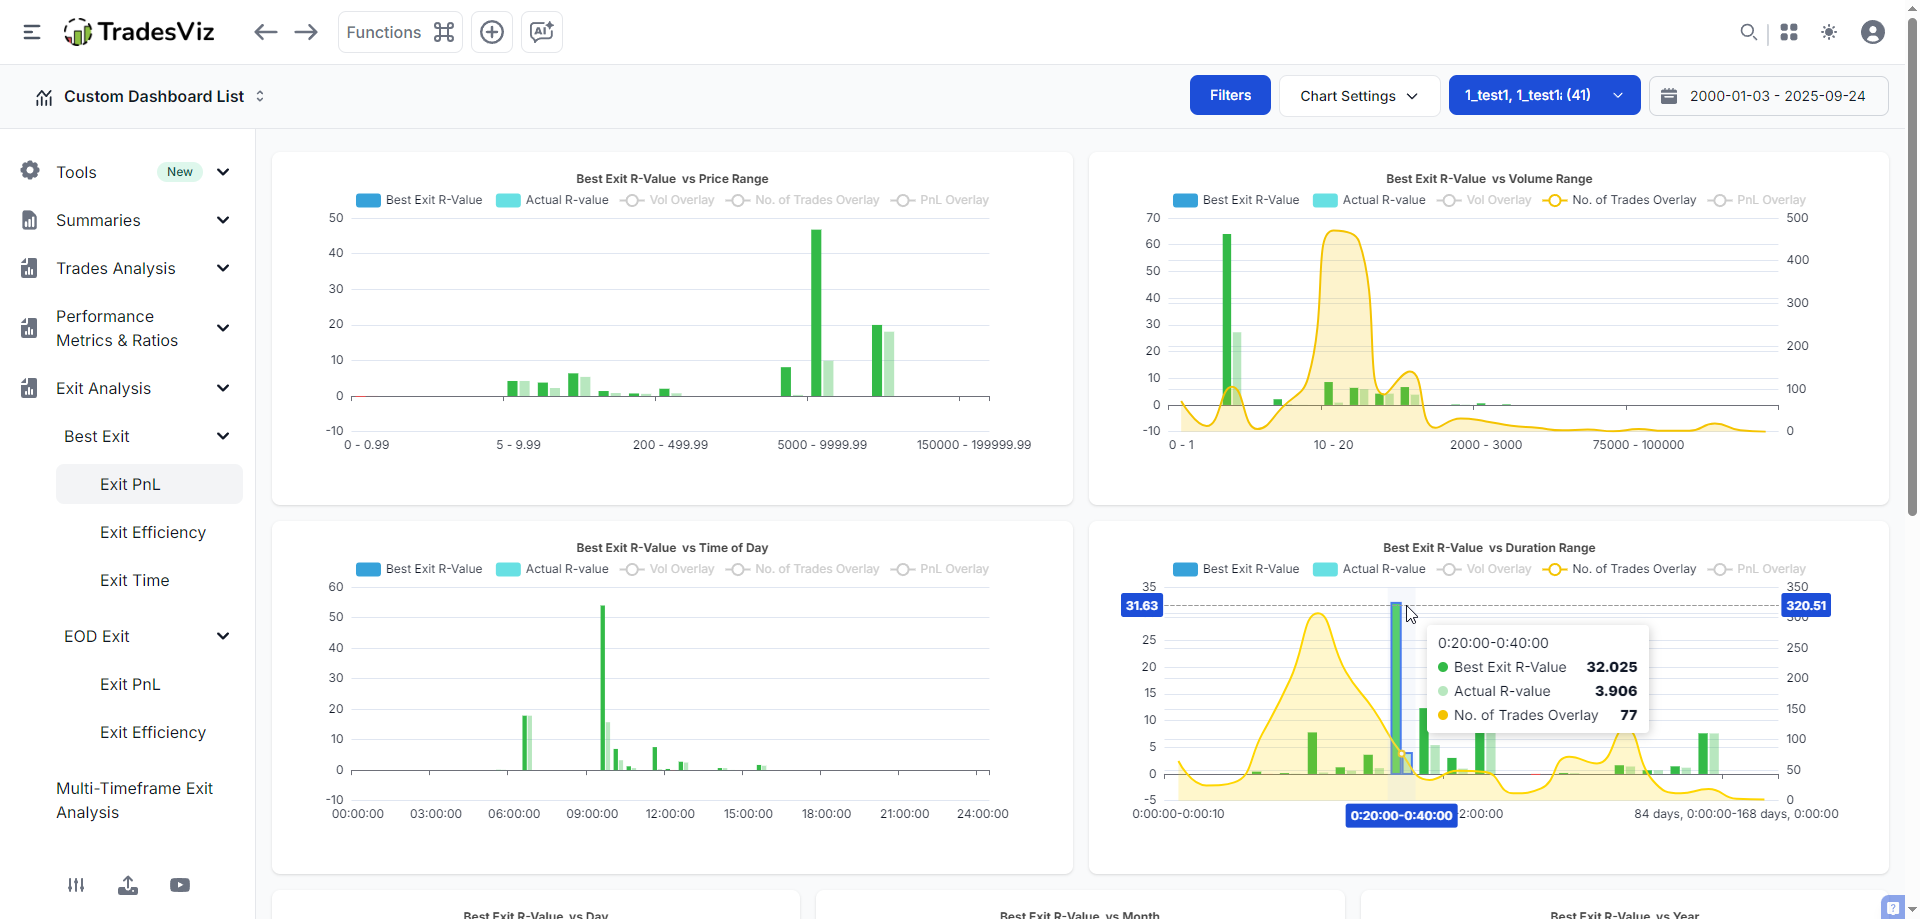
The above screenshot is of the best analysis section in TradesViz, but with global R-value mode turned on. The dark green bars are the best possible exit measured in R-value, and the light green bars are the actual R-value we realized in those trades.
Notice the stark difference in how much money we are leaving on the table vs how much we actually make. A really good example is the highlighted bar in the best exit R-value vs Duration range. Notice that with overlay, we can see that not only have we traded the duration range of 20-40 minutes less, but we're also left A LOT of profit on the table.
A lot of these concepts and the ones discussed previously are exclusively available in the TradesViz trading journal only. All of these features were not built at once, but carefully designed so that they all complement each other, and a trader can layer these concepts to uncover truly edge-defining trading patterns and behavior discoveries.
Example: AI Q&A for specific metrics
TradesViz has processed over 50,000 unique AI queries. Each of these queries serves a very specific purpose for the trader who generated it, and they can use it in their custom dashboard. Now, why do we need this? Even though the TradesViz dashboard is extremely comprehensive in its analytics offering, it is impossible to cover 100% of the use cases traders have. To solve those custom cases and to allow users to have full control over their data, all whilst still guaranteeing privacy (even if we use state-of-the-art LLM/AI systems), we introduced this. TradesViz was the first online trading journal to introduce AI in journaling. Our AI Q&A remains the most popular, widely used, and only functioning AI system in journaling.
Here's an example:
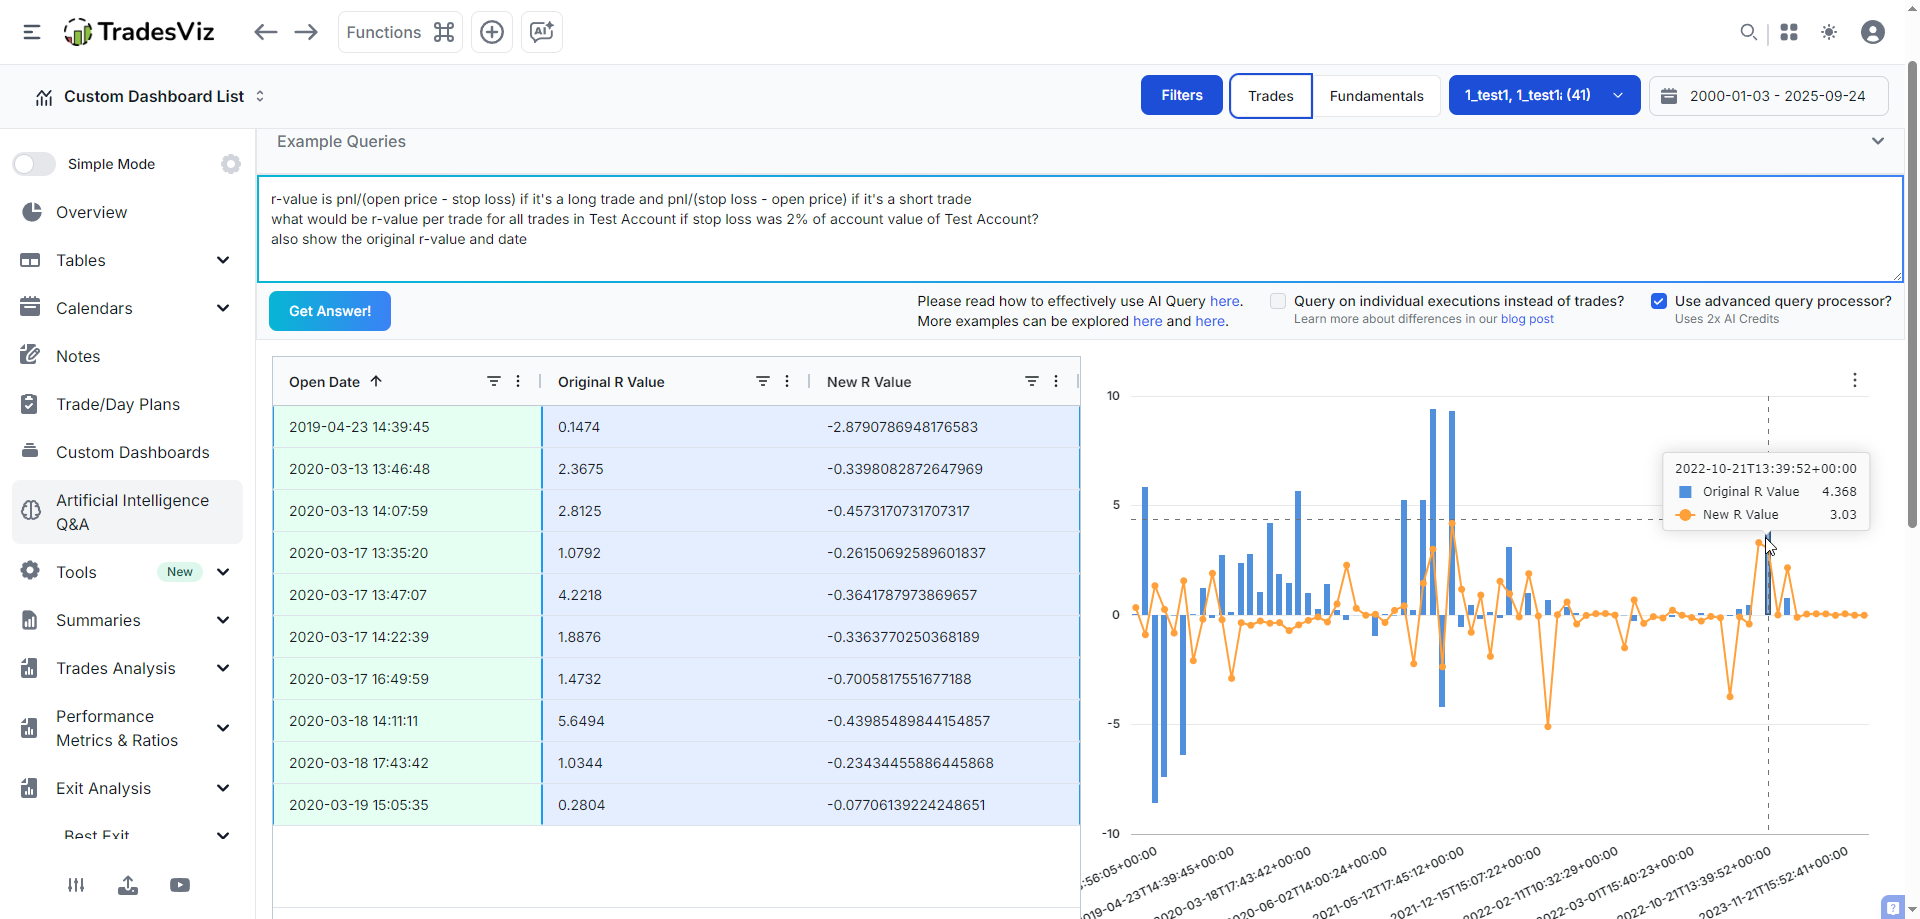
The goal of this query was to see what the R-value would have been if we used 2% as a stop loss for all the trades in a particular trading account. The results are quite interesting - while it doesn't seem to be as great as the non-fixed stop loss that has been used in this account, it means there's plenty of room for further stop loss fine-tuning. Upon further research, we found that this particular simulation had a lot of useful features. This actually led to the release of the first risk simulator in an online trading journal. When you create in the risk simulator, you will get R-values automatically generated.
Would this type of analysis or visualization be possible without AI Q&A? No. There are plenty of AI examples here and also here for you to take a look.
Understanding Profit Factor: The Health Check for Your Trading Strategy
Defining Profit Factor in Simple Terms
To calculate the profit factor, you need to divide the total profits generated by winning trades by the total losses incurred by losing trades.
The Formula: Profit Factor = Total Gross Profit ÷ Total Gross Loss
Real-World Example:
- Total profit from winners: $15,000
- Total loss from losers: $7,500
- Profit Factor = $15,000 ÷ $7,500 = 2.0
This means you're making $2 for every $1 you lose - a healthy trading system!
What's a Good Profit Factor?
A good profit factor in trading is above 1.75. We would be skeptical if the value is lower than 1.75, but we are also questioning if it is above 4. A realistic profit factor is around 2.
Here's the professional benchmark scale:
- < 1.0: Losing system (losing money overall)
- 1.0 - 1.5: Marginally profitable (high risk of drawdowns)
- 1.5 - 2.0: Good system (solid profitability)
- 2.0 - 3.0: Excellent system (strong edge)
- > 4.0: Potentially over-optimized (be cautious)
Leveraging Profit Factor for Total System Analysis in TradesViz
Building Your Profit Factor Dashboard
TradesViz's Custom Dashboard feature lets you create a personalized command center for monitoring your Profit Factor in real-time. With the latest dashboard widgets, you can:
- Add a dedicated Profit Factor widget showing:
- Current period Profit Factor
- 30-day rolling Profit Factor
- Profit Factor by strategy or symbol
- Combine with complementary widgets:
- Win Rate gauge
- Average R-Multiple display
- Risk-Reward ratio chart
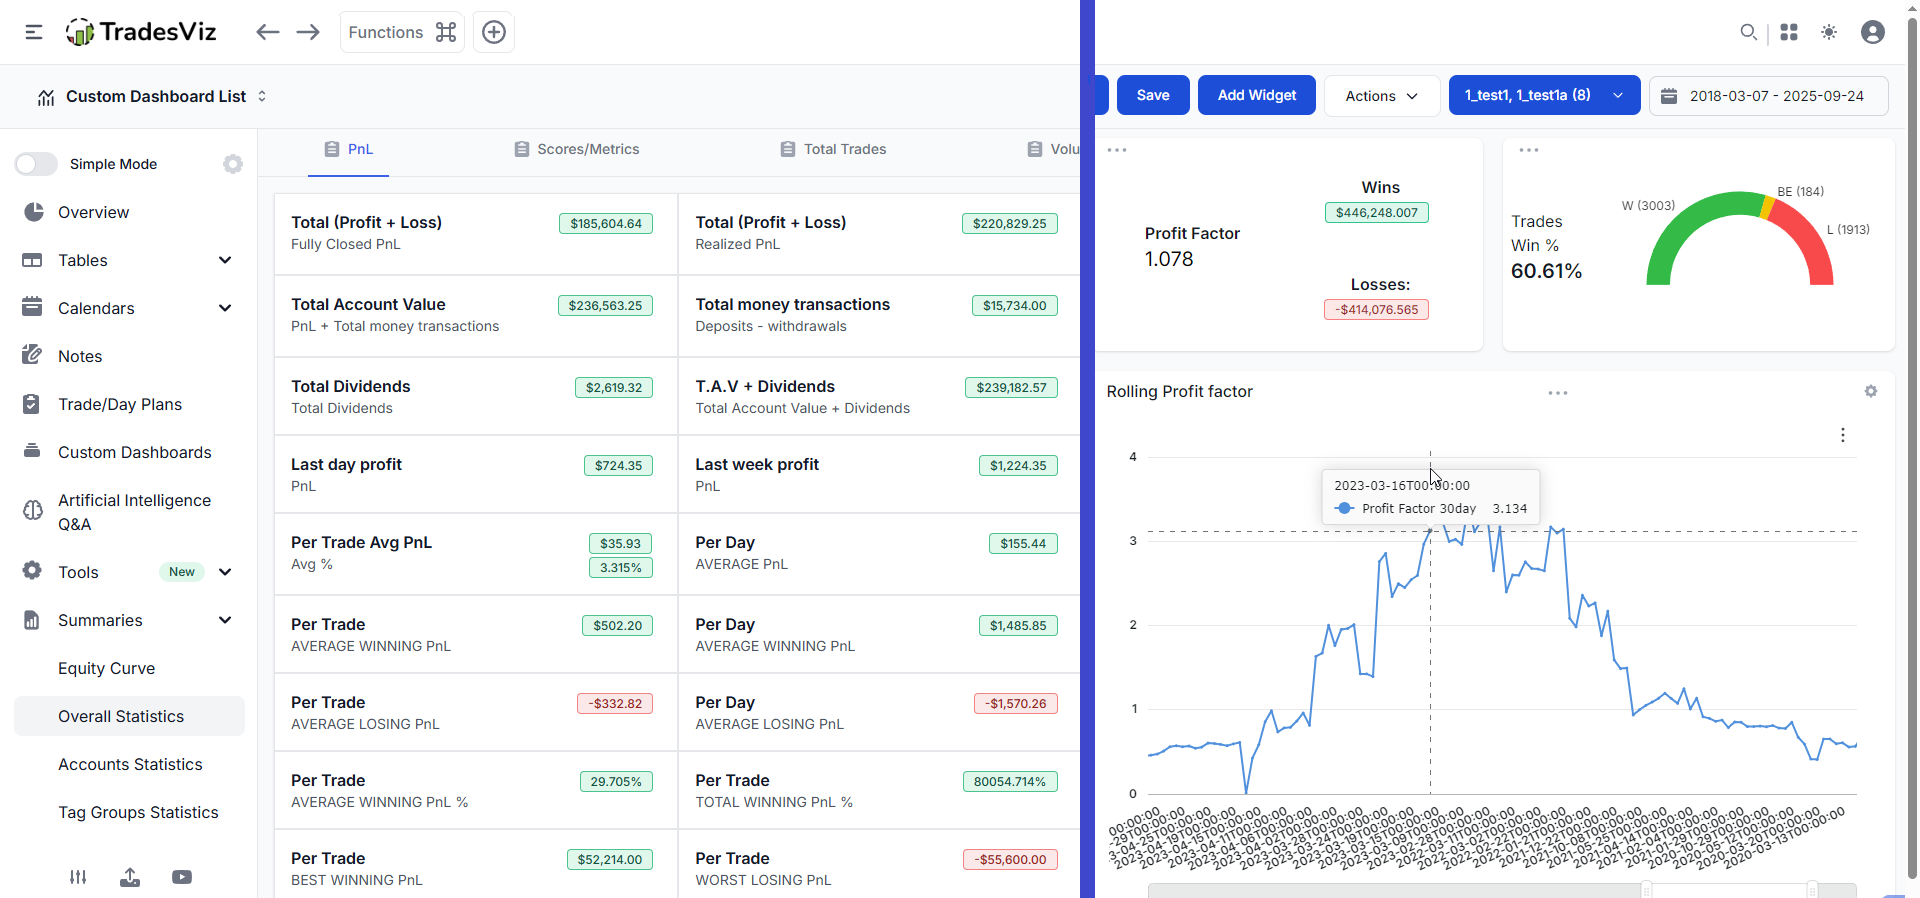
One of these widgets is not like the other ... :)
We hope you noticed how we've combined the concepts explained so far in this blog post - the widget at the bottom right corner is a custom AI widget because this stat/chart does not exist as a pre-built widget in TradesViz.
Analysis with AI Queries
We've explained and explored the AI Q&A tool previously. Another way to explain this feature is that the AI Query tool understands natural language and can perform complex analysis (or pretty much any of your journaling metrics) that would typically require advanced programming skills.
Simple AI Query Examples:
- "Show me profit factor for long vs. short trades in the last 3 months, broken down by time of day"
- Uncovers directional biases and optimal trading environments
- "What's my profit factor on trades held less than 1 hour versus trades held 1-4 hours?"
- Identifies your optimal holding period
- "Calculate profit factor for trades taken in the first 30 minutes of market open versus rest of day"
- Pinpoints your most profitable trading windows
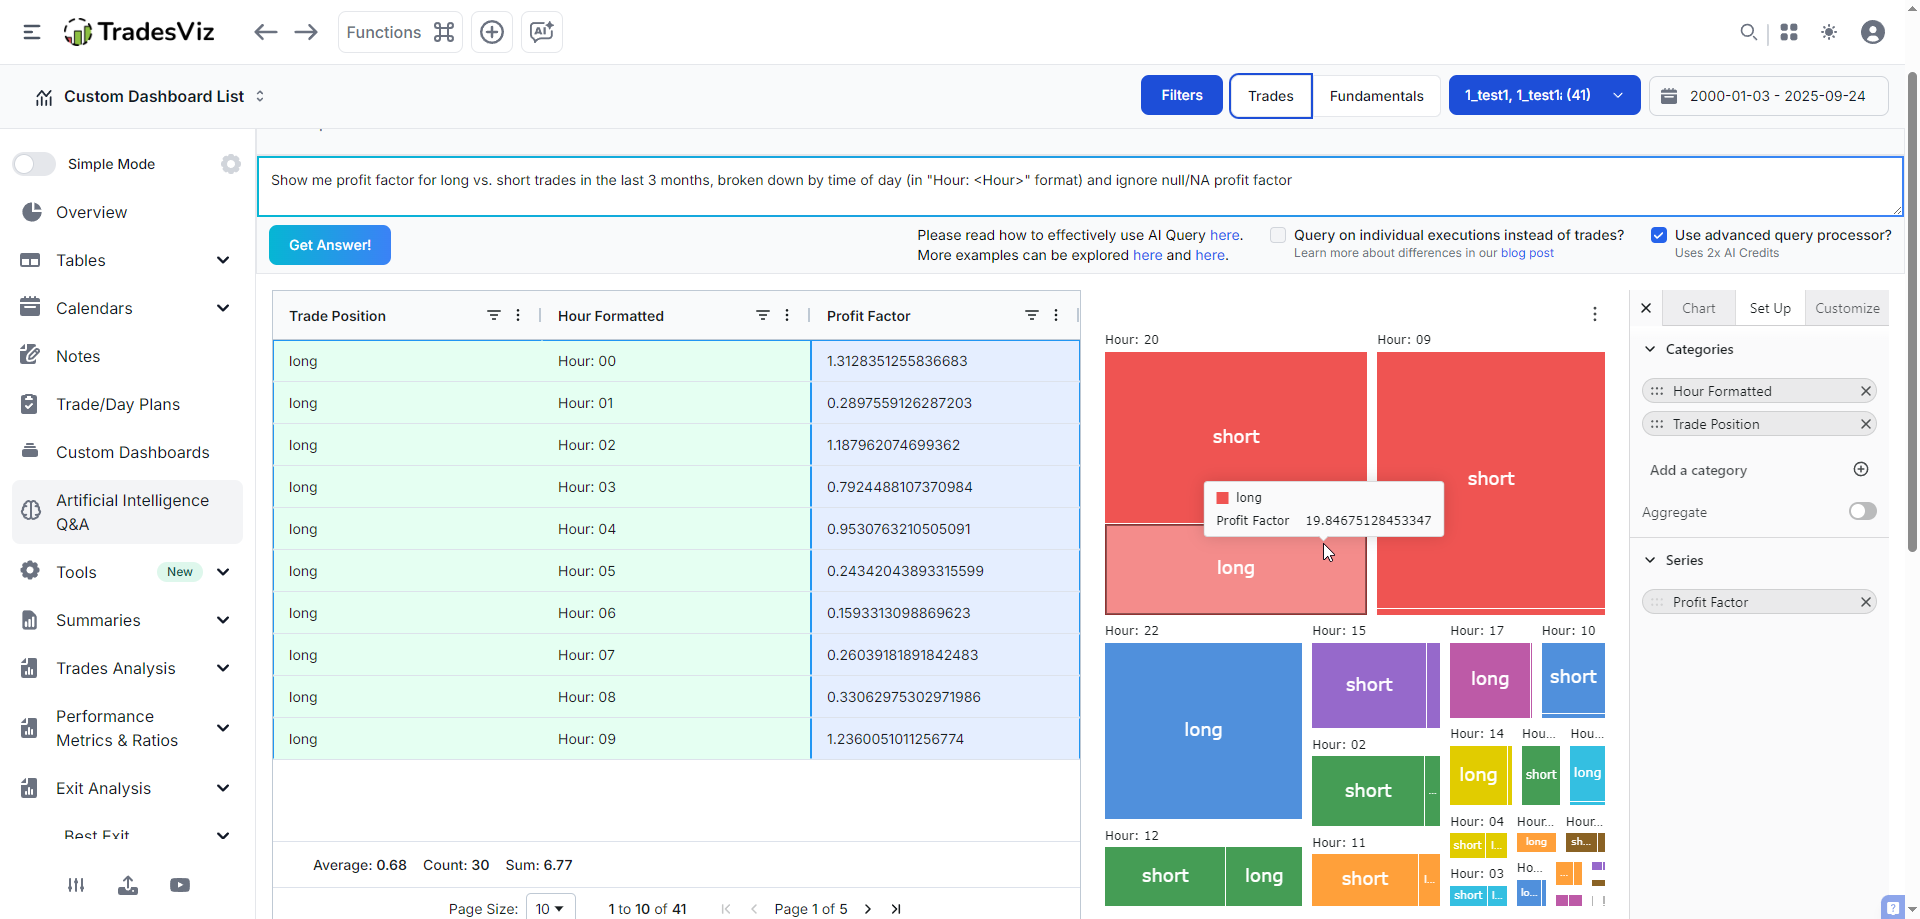
Also, we just introduced ~10+ new chart types - we used Tree map as an example in the AI query above, as it made perfect sense: We have 2 levels of categories: long/short (side) and then hour of the day (made it a category by appending "Hour" to it). You can explore all the new chart types in our previous blog post.
Surgical Precision with the Trades Grid
The Trades Grid provides unmatched filtering capabilities for calculating Profit Factor on highly specific trade subsets. This isn't just filtering: it's surgical precision analysis.
Advanced Grid Analysis Workflow:
- Filter Setup:
- Symbol: TSLA
- Direction: Short only
- Time: 9 AM - 11 AM
- Tags: "Momentum Reversal"
- Calculate Metrics:
- The grid automatically recalculates Profit Factor for this exact subset
- Compare against your overall Profit Factor
- Export results for deeper analysis
- Iterate and Refine:
- Test different filter combinations
- Identify your "golden zones" – specific conditions where Profit Factor exceeds 3.0
- Build rules around these high-performance scenarios
Combining R-Value and Profit Factor for Complete Analysis
The true power emerges when you analyze R-Value and Profit Factor together:
- High R-Value + High Profit Factor = Elite trading system
- High R-Value + Low Profit Factor = Good exits, but too many losses
- Low R-Value + High Profit Factor = Consistent, but leaving money on the table
- Low R-Value + Low Profit Factor = Complete strategy overhaul needed
Advanced TradesViz Features for Performance Optimization
Exploring Individual Trades with Tab Explore
The trade explore tab provides a microscopic analysis of individual trades, helping you understand exactly what drives your R-Value and Profit Factor:
- Entry/Exit Analysis: See precisely where you entered and exited relative to the day's price action
- MFE/MAE Tracking: Understand if you're cutting winners short or letting losers run
- Time-based Performance: Analyze how R-Value changes based on hold time (Read more in our Analysis of duration to MFE and MAE blog post)
Visualizing Complex Relationships with New Chart Types
TradesViz's new chart types offer innovative ways to visualize the relationship between R-Value and Profit Factor:
- Scatter Plots: Plot R-Value against win rate to identify optimal trade characteristics
- Heat Maps: Visualize Profit Factor across different times and market conditions
The Trading Plan Checklist Connection
Your Trading Plan Checklist, i.e, the trade plans directly impact both metrics. TradesViz allows you to:
- Tag trades based on checklist completion
- Compare R-Value and Profit Factor for:
- Fully planned trades
- Partially planned trades
- Impulsive trades
- Quantify the exact cost of breaking your rules
Practical Implementation – Your 30-Day Action Plan
Week 1: Baseline Assessment
- Import all your trades into TradesViz
- Check your current Average R-Multiple in General Statistics
- Note your overall Profit Factor
- Identify your top 3 performing setups by R-Value
Week 2: Deep Dive Analysis
- Use the Pivot Grid to analyze R-Value by:
- Time of day
- Day of week
- Market conditions
- Trade tags/setups
- Create AI queries to uncover hidden patterns
- Build a custom dashboard with key metrics
Week 3: Strategy Refinement
- Eliminate or modify setups with R-Value < 1
- Increase position size on high Profit Factor strategies
- Use the Trades Grid to backtest improvements
- Document new rules based on discoveries
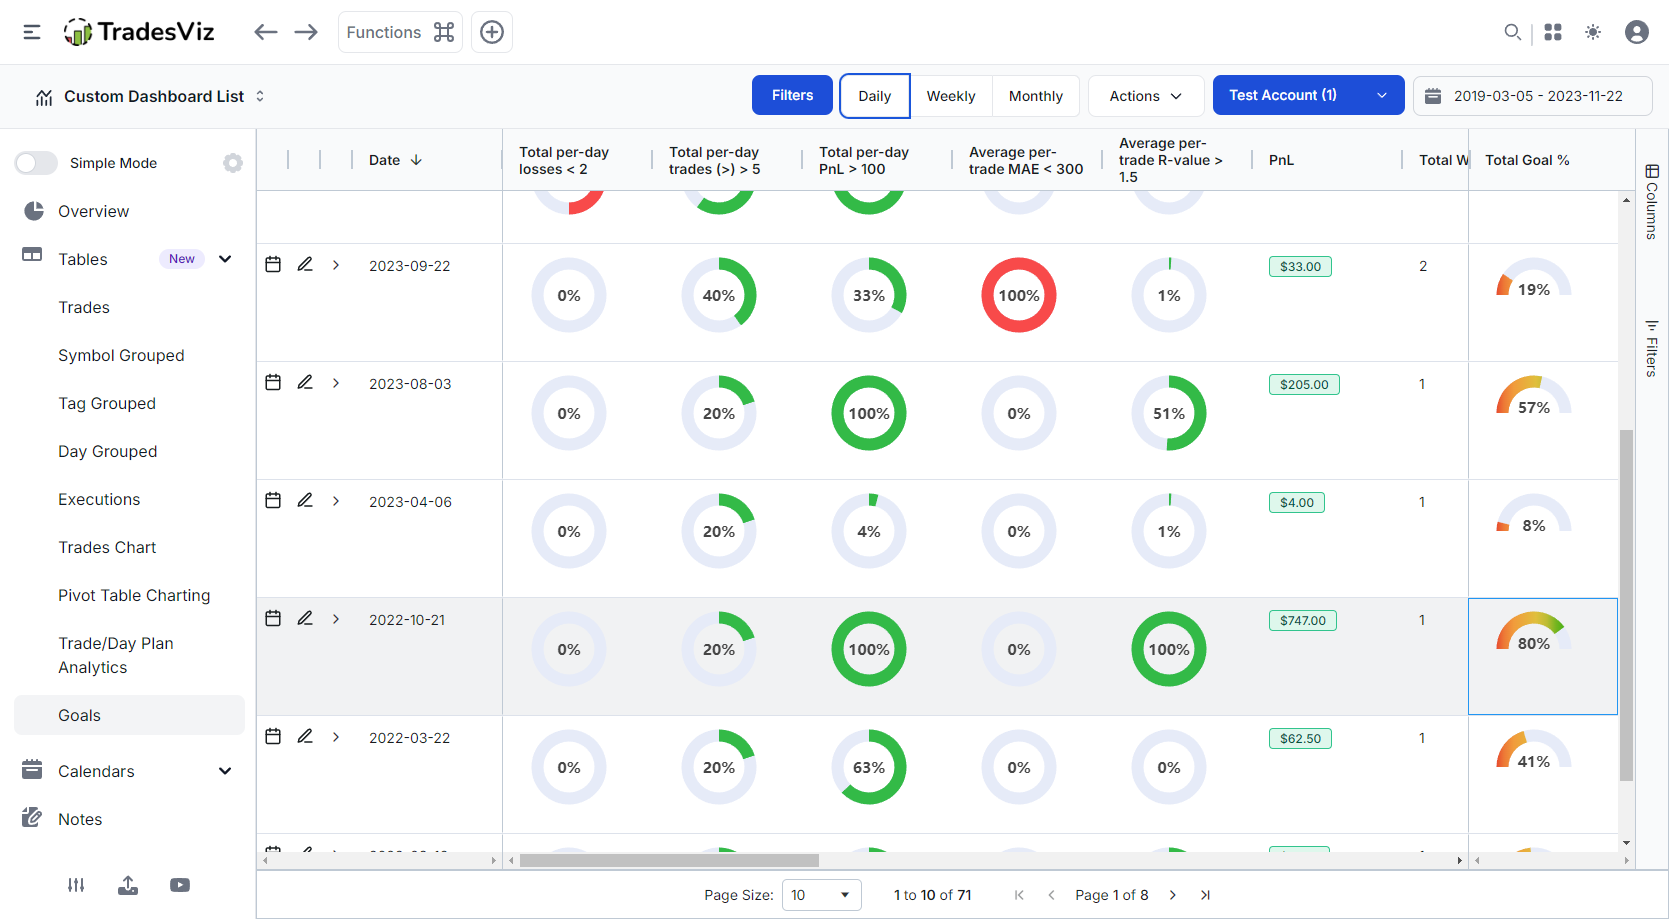
Important: Make sure to monitor your progress using the goals tracker!
Week 4: Implementation and Tracking
- Trade only high R-Value setups
- Monitor daily Profit Factor changes
- Use Tab Explore to review every trade
- Adjust based on real-time feedback
From Data to Actionable Trading Rules.. to Success!
The journey from amateur to professional trader isn't about finding a "holy grail" strategy – it's about understanding and optimizing the metrics that matter. R-Value shows you the quality of individual trades, while Profit Factor validates your entire trading system. Together, they provide a complete picture of your trading performance that transcends the misleading simplicity of win rate.
TradesViz transforms these powerful concepts from abstract theory into actionable intelligence. With features like AI-powered queries, customizable dashboards, and advanced pivot analysis, you're not just tracking numbers... you're uncovering the precise adjustments needed to elevate your trading to the next level.
Doing this takes time, effort, and a lot of patience. But ONLY this will lead to longer-term success. There are no shortcuts, there are no "easy" ways. If you wish to see the consistent trading success you aim for, this is where you build a strong foundation.
Your Next Step:
Stop flying blind. The difference between struggling traders and consistent winners isn't talent or luck. It's data-driven decision-making. With TradesViz's comprehensive analytics suite, you'll finally have the insights needed to transform your trading from guesswork to precision.
Start your free TradesViz trial now and join thousands of traders who've already discovered what they were missing. Your future profitable self will thank you.