Most trading content tells you when to get in. Almost nothing tells you when to get out. Here's how to use your own data to find your optimal exit — and stop leaving money on the table.
Go to YouTube right now and search "trading strategy." You'll get thousands of results about entries. Scanners, setups, indicators, patterns, alerts - the entire retail trading education machine is built around one thing: getting in.
Now search "how to exit a trade." You'll get generic advice about trailing stops and setting a 2:1 R:R target. That's it. That's what the industry has for you...
Here's the problem: your entry doesn't determine your PnL. Your exit does.
You cannot control where the price goes after you hit buy. The moment your order fills, you're at the mercy of the market (or... are you?...) - macro events, institutional flow, algos, news. The only thing you retain absolute control over is when you leave. And yet, the overwhelming majority of traders spend 90% of their prep time on entries and almost zero time studying their exits!...
We've been beating this drum for years at TradesViz. We built best exit analysis, EOD exit analysis, multi-timeframe exit PnL, and multi-timeframe exit visualization - all because we saw this gap in the market and nobody was filling it. Not the influencers, not the other journals, nobody.
This guide is everything we know about exits, distilled into one place. No fluff. No "just use a trailing stop" advice. Data, frameworks, and actionable steps you can apply to your own trades today.
Entries Only Expose Capital. Exits Build (or Destroy) Wealth.
Let's make this concrete.
Trader A and Trader B both buy AAPL at $185.00 at 10:15 AM. Same stock. Same entry. Same time.
- Trader A exits at $186.20 at 10:45 AM → +$1.20/share
- Trader B exits at $188.50 at 12:30 PM → +$3.50/share
Same entry. Wildly different outcomes.
 |
 |
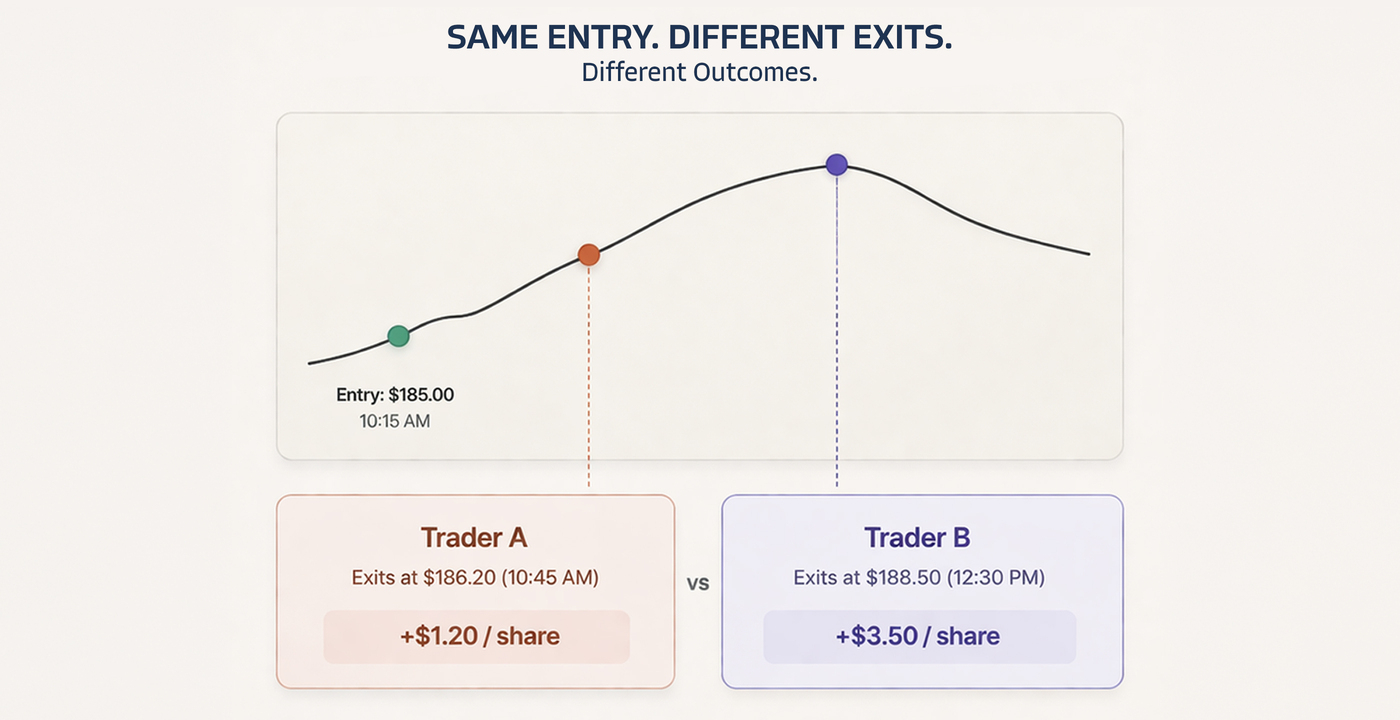
Multiply that across 500 trades in a year. If Trader A consistently captures only 35-40% of the available move while Trader B captures 65-70%, we're talking about a completely different equity curve from the exact same setups.
This is not theoretical. When you actually analyze real trade data (which we do, across thousands of users' trades), patterns emerge clearly:
- The average trader captures only 40-55% of the maximum available profit on winning trades (what's yours?...)
- Small improvements in exit timing - even 10-15 minutes of additional hold time- can dramatically change annual PnL
- And yes, most traders exit winners too early and hold losers too long. Every time. Consistently.
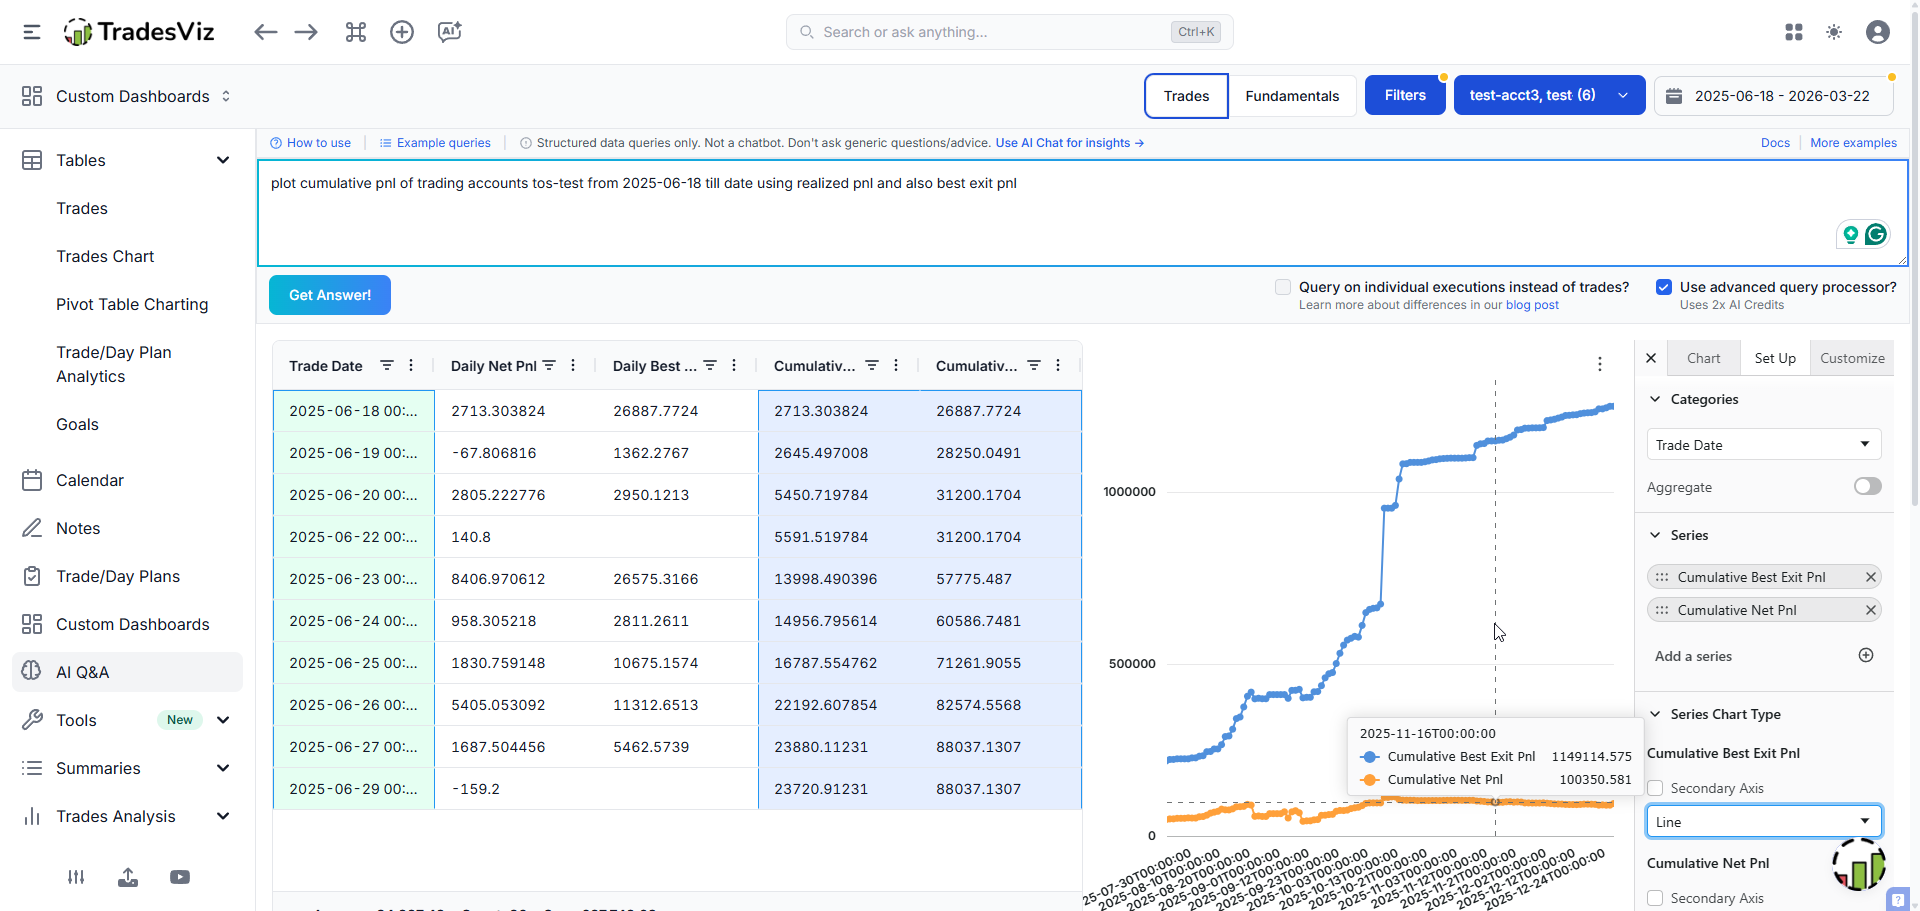
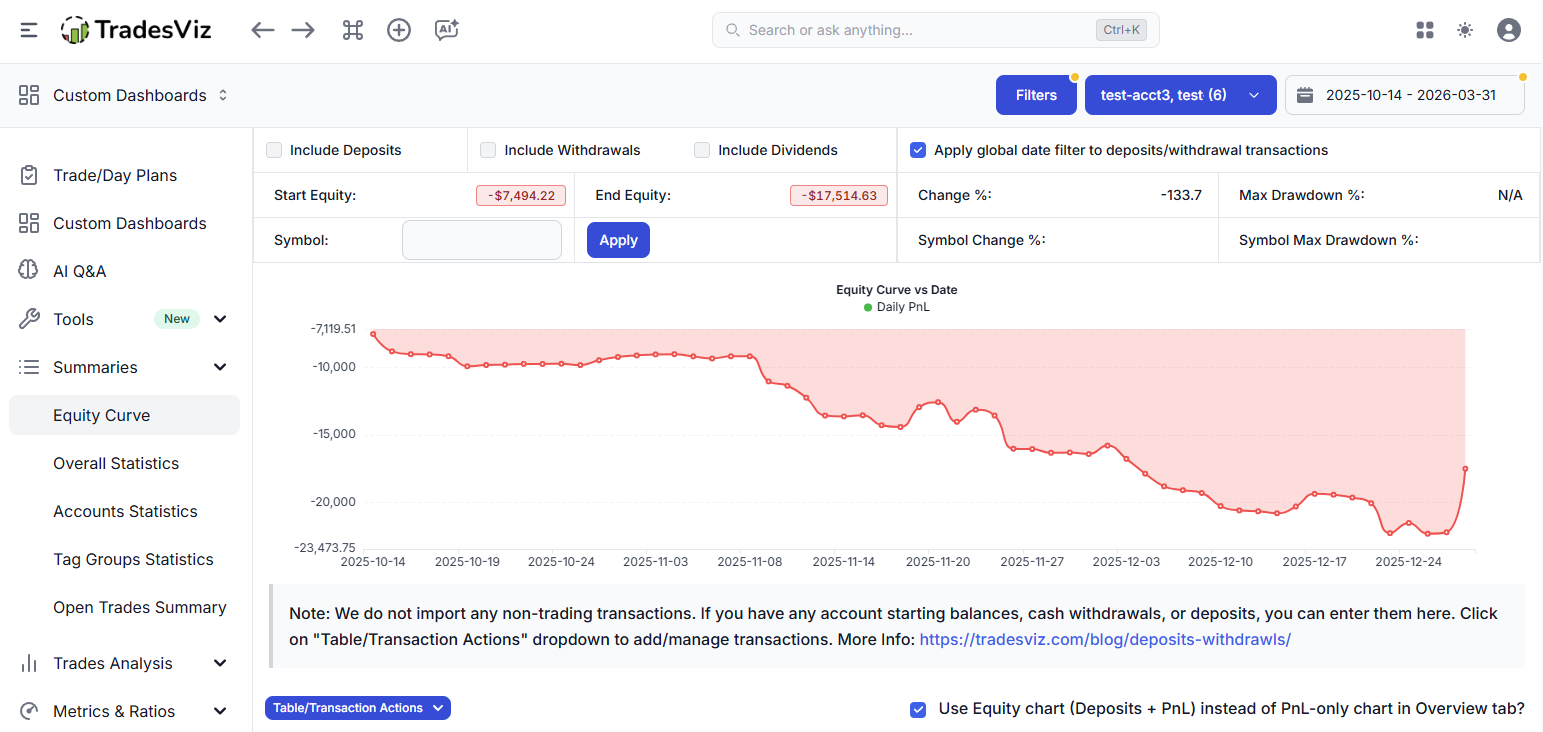
The math is simple: a great entry with a terrible exit is a losing trade. A mediocre entry with a disciplined, data-backed exit can be profitable. One of these things is under your control. The other isn't. Here's ONE single chart from TradesViz that exposes all of this. This is under the Exit analysis > Best exit.
The Myths That Are Destroying Your Exits
Before we get into solutions, we need to address the garbage advice that's actively making traders worse at exits. This stuff gets repeated so often that people accept it as gospel.
Myth 1: "Always set a 2:1 Risk-to-Reward target"
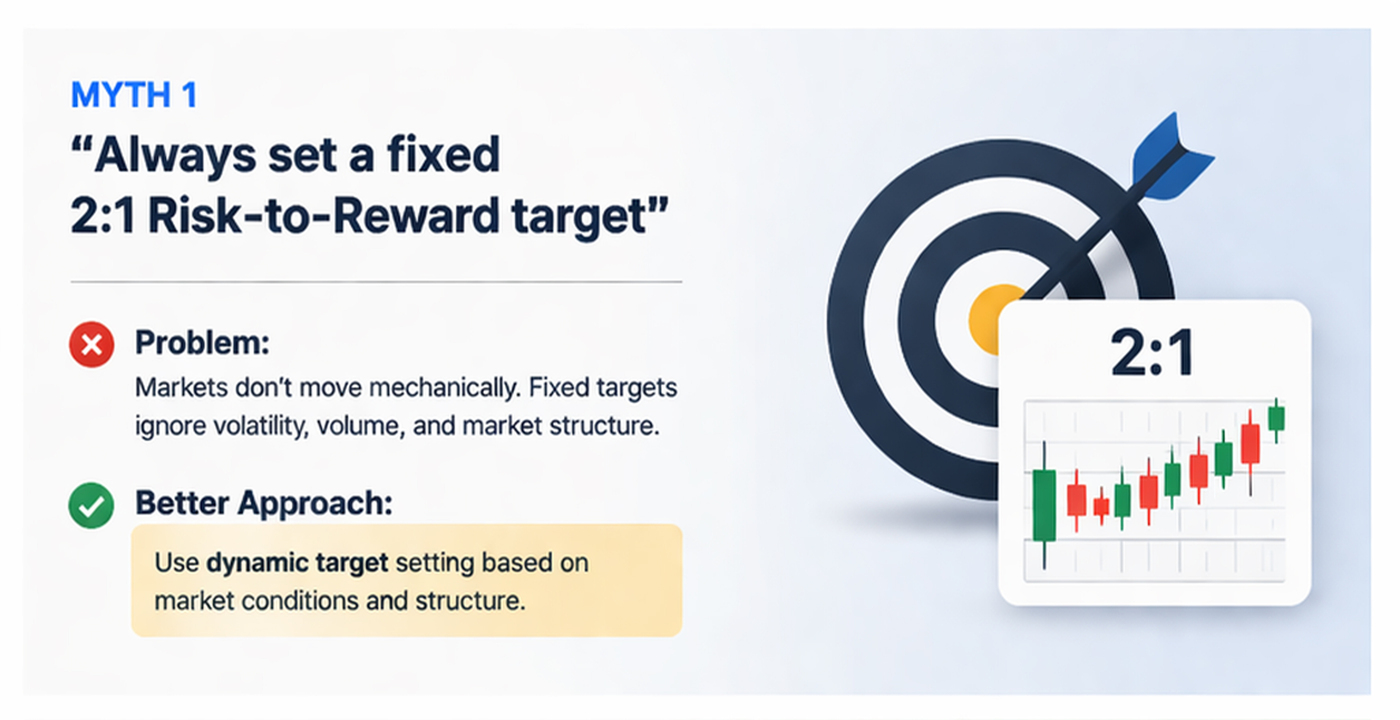
This is probably the most damaging piece of advice in retail trading. Beginners are taught to mechanically set a 2R or 3R profit target on every single trade, regardless of what the market is actually doing.
The problem? Fixed profit targets ignore everything that matters - market structure, current volatility, volume profile, momentum. If you're in a winning trade that's showing clear reversal signals at 1.5R, holding for 2R because "that's the rule" is how you turn winners into losers. We've seen this in trade data constantly.
True exit optimization requires dynamic adaptation. Use ATR-based analysis, read the volume, watch the structure. Your exit should respond to what the market is doing right now, not what you decided yesterday on a static chart.
Myth 2: "Let winners run and cut losers short"
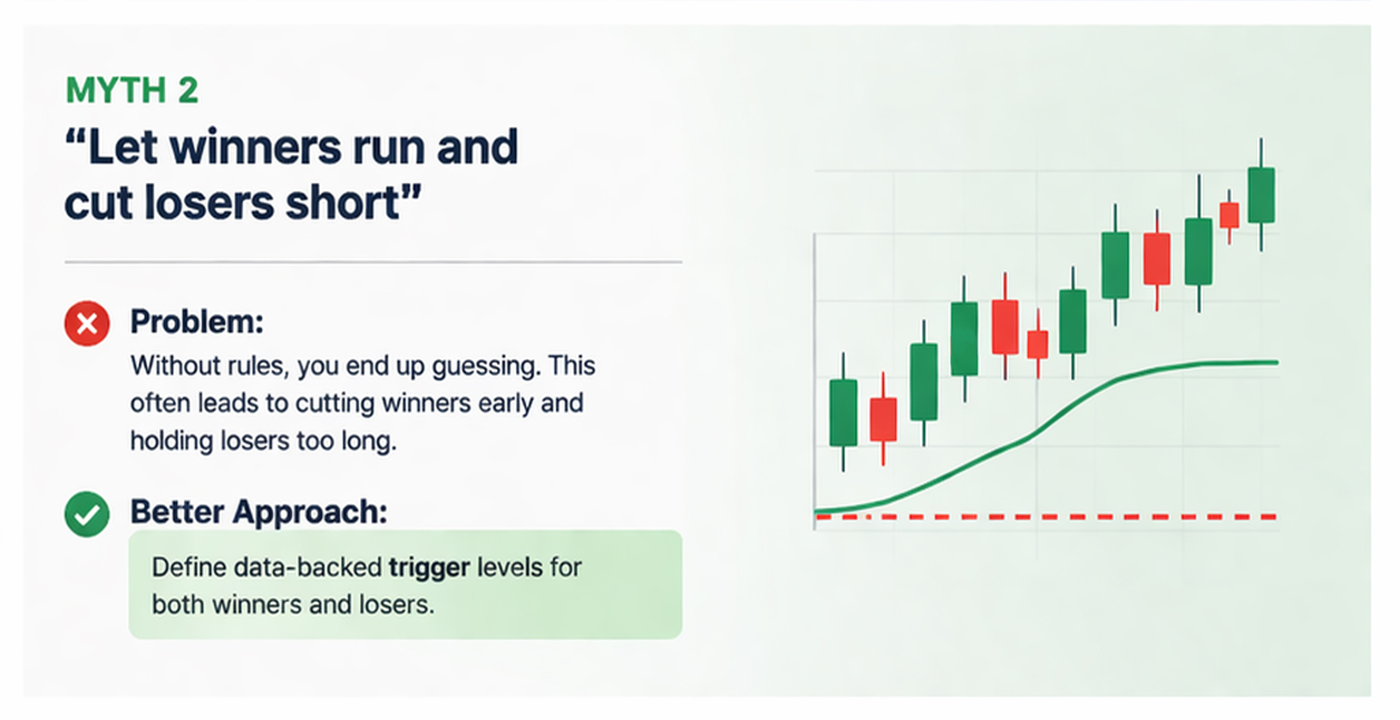
Everyone says this. Nobody tells you how. Everyone who says also assumes you have a crystal ball at home... (we don't... do you?....)
Without predefined criteria, "letting winners run" translates to: hold your profitable position through a massive retracement because you hope it'll come back. That's not a strategy - that's prayer. And "cut losers short" without data means panicking out of trades that were within normal drawdown range.
These are platitudes, not strategies!
A strategy is: "My data shows that holding $20-$50 stocks for 45 additional minutes after my initial target, while trailing my stop at the 9 EMA, increases my exit efficiency from 42% to 63% and adds an average of $0.85/share to my winners."
That's what data-driven exits look like. You need metrics like MFE (Maximum Favorable Excursion) to determine exactly when your "running winners" historically reverse. Without that, you're guessing - and guessing is what the gurus never tell you they're doing too.
Myth 3: "More indicators = better exits"

Crowding your chart with 5 lagging indicators creates analysis paralysis. You're waiting for RSI, MACD, Bollinger Bands, and two moving averages to all align while the optimal exit window comes and goes. We've seen traders add more indicators after a bad exit, thinking the problem was insufficient confirmation. It wasn't. The problem was they had no data on their own exit behavior.
Exits should be based on price action, volume (for MOST cases), and - this is the key part - your own historical statistical probabilities derived from your trading journal. Not someone else's indicators. Your data. Your patterns. Your edge. This is all unique to you, and that's why the best book you can read is your own trading journal.
The Disposition Effect: Why Your Brain Sabotages Every Exit
This isn't just about bad advice. There's a well-documented psychological phenomenon that makes exits inherently harder than entries, and it's called the Disposition Effect.
Here's what it is: traders have a statistical tendency to sell winners too early and hold losers too long. This isn't a character flaw - it's how human brains are wired. Loss aversion is baked into our evolution. More than this, your own history, upbringing, and societal values also have an enormous significance!
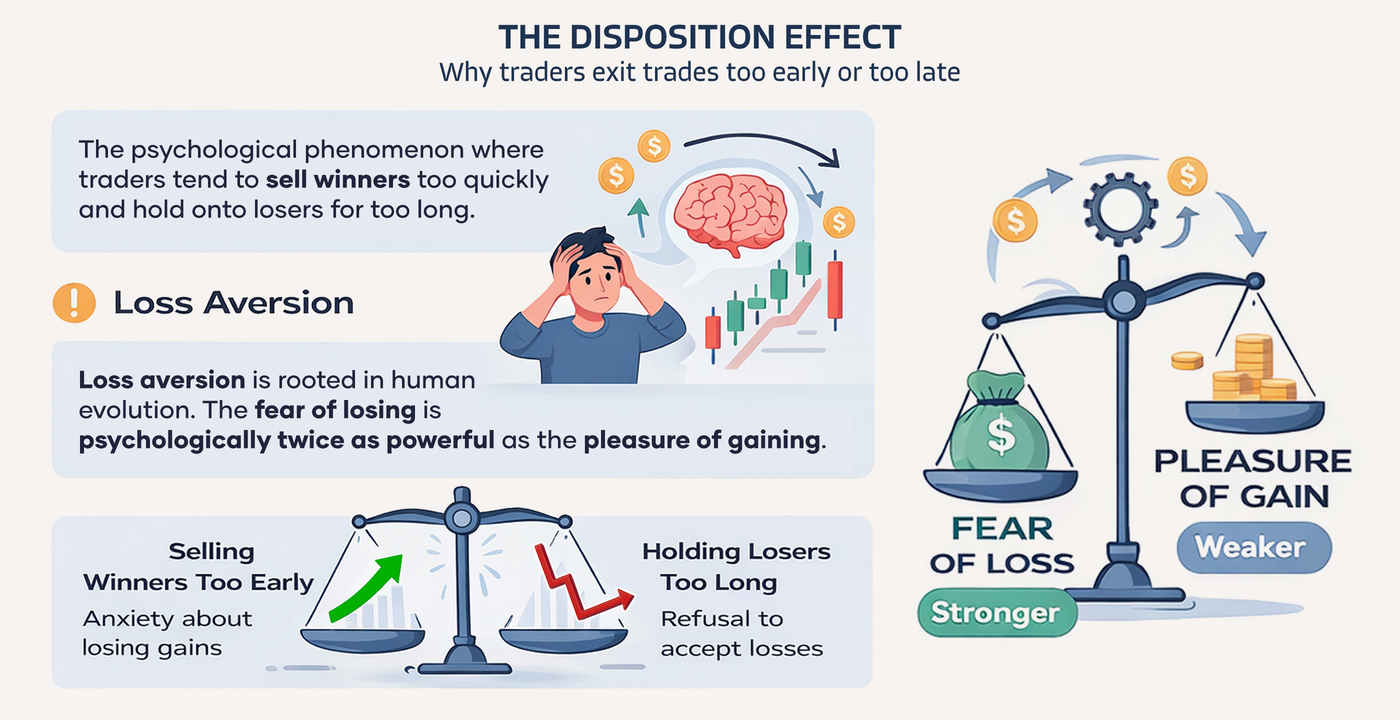
When a trade is green, you feel anxiety. "What if it reverses? What if I lose these gains?" To make that feeling go away, you close the position. Small win. Relief. But you've just cut the trade's positive expectancy short (Re: "You have no idea when a trade is a winner or loser until you close it").
When a trade is red, closing it means accepting a permanent loss. That hurts. So you hold. You hope. You tell yourself, "it'll come back." This is how retail traders blow accounts - not through one catastrophic trade, but through systematic refusal to execute planned stops.
 |
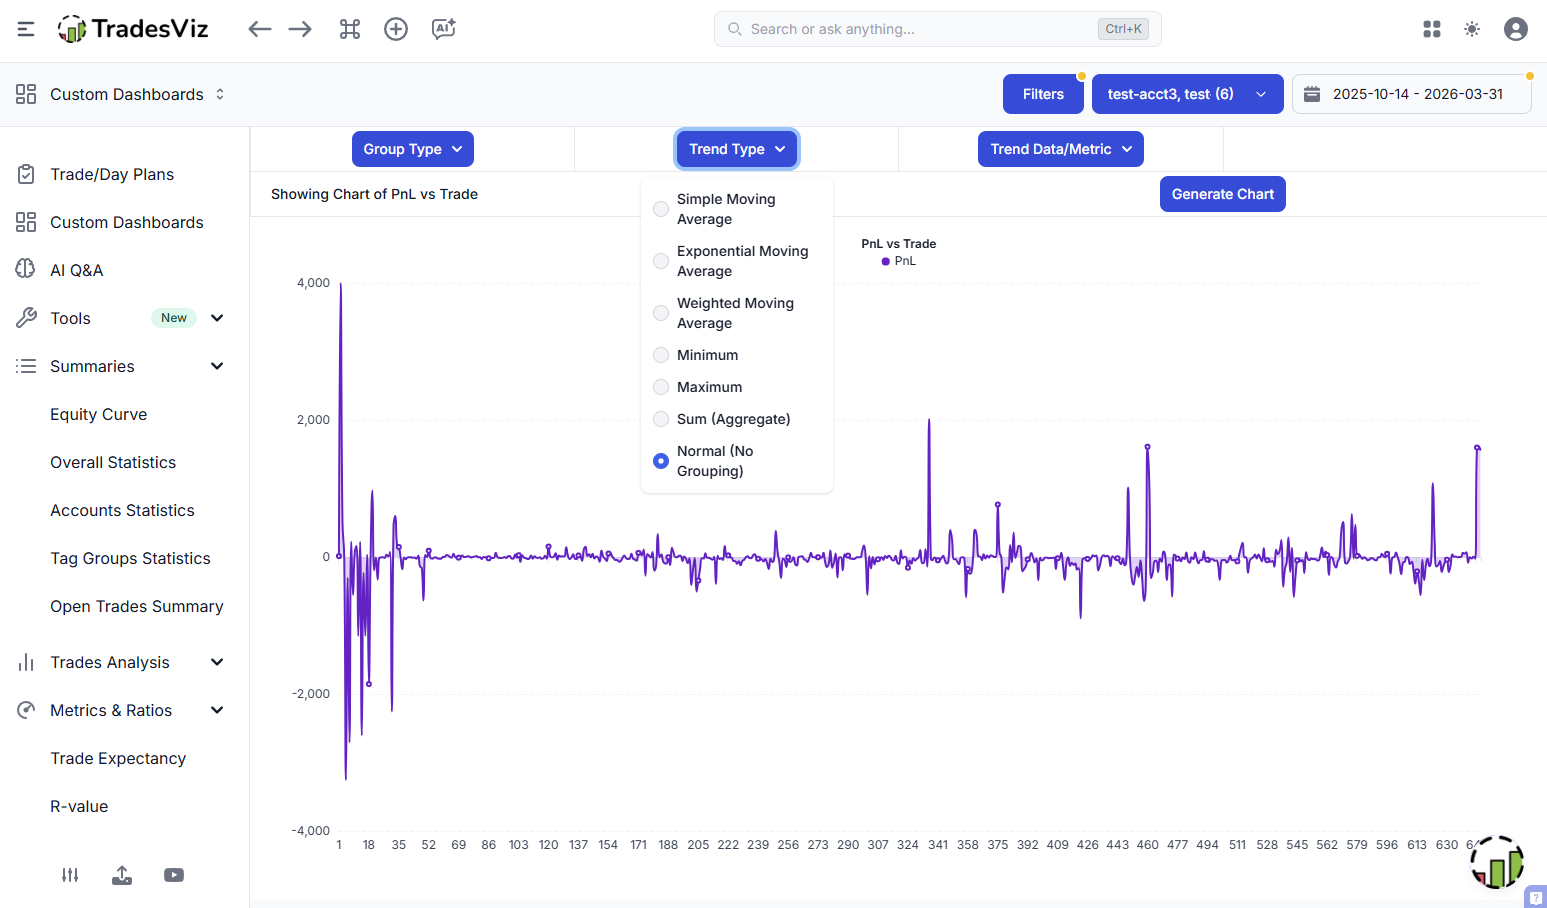 |
On the left, you have an equity curve you never want to see. On the right, you have the reason why the equity curve looks like that...(that's the trend analysis chart). When you keep making mistakes, and if you don't do anything to address the problem, the above is what you'll see. Death by a 1000 cuts bad trades.
Here's the uncomfortable truth: you cannot willpower your way out of the disposition effect. You can't just "be more disciplined." The only thing that works is replacing emotional decision-making with objective data. When your journal shows you - in hard numbers - that you consistently leave 45% of available profit on the table on winning trades, and that your losers run 2x further than they need to, that is what changes behavior. Not a YouTube motivational video. Data.
This is exactly why we built psychology tracking into TradesViz - so you can tag your emotional state on trades and then cross-reference it against actual performance. Over hundreds of trades, you can literally see the dollar cost of fear and greed in your own data. Journaling and anlaysis is a continual process that will reward your discipline and patience over time.
The Three Exit Problems Every Trader Faces
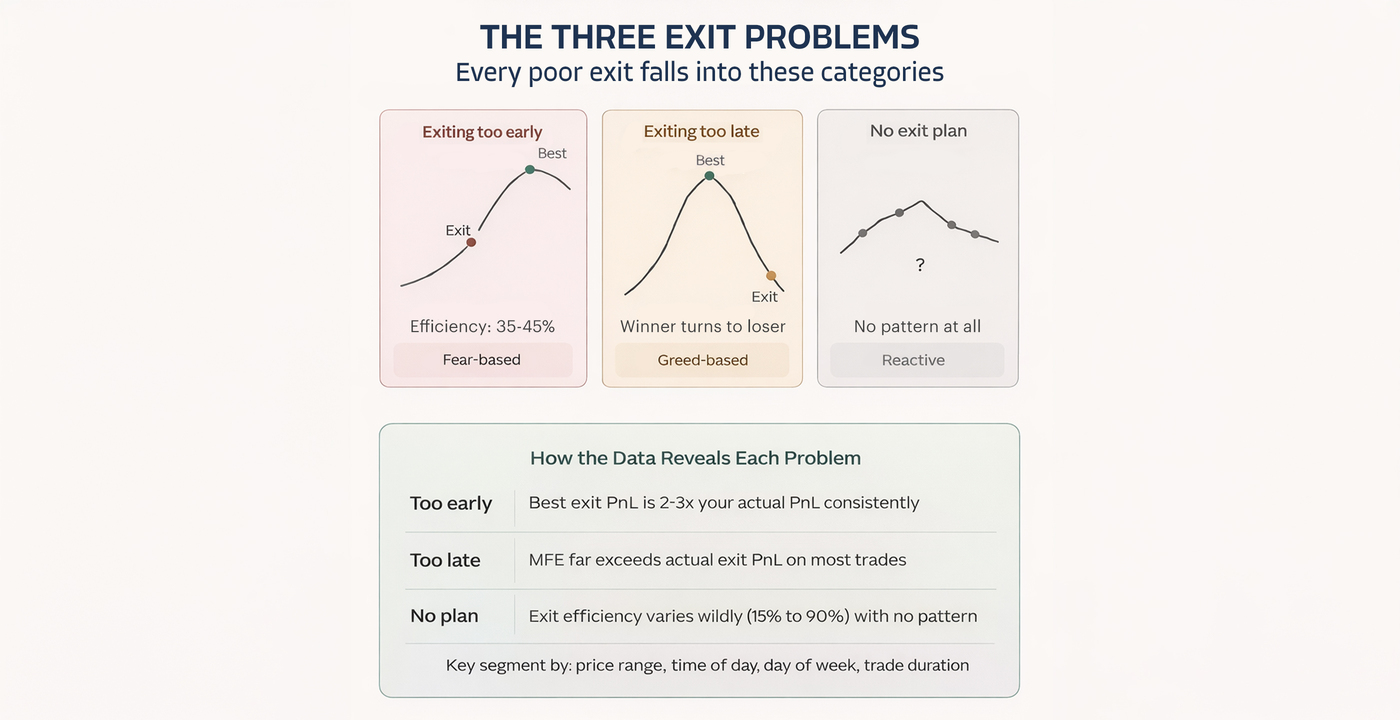
Every poor exit falls into one of three buckets. Knowing which one you have is the first step to fixing it.
Problem 1: Exiting Too Early (Fear-Based)
The most common problem, especially for newer traders. You see green, you grab it. Feels safe. But you're consistently leaving the majority of the move on the table. This is the least problematic of the three.
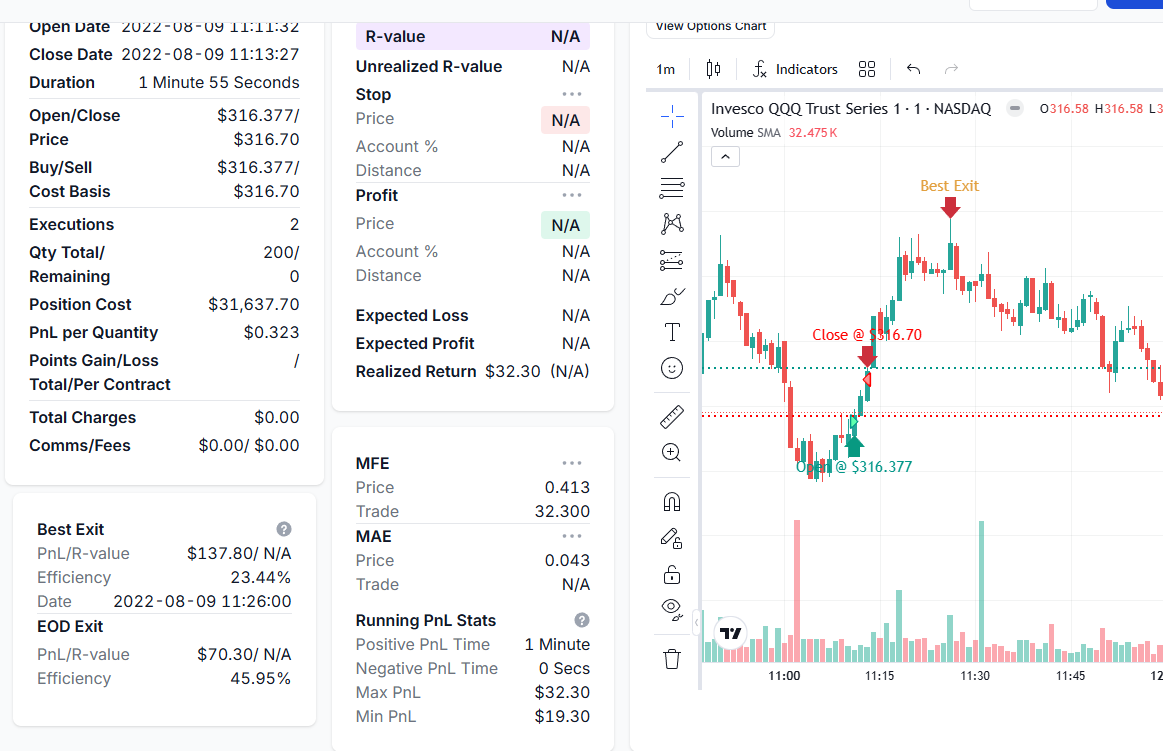
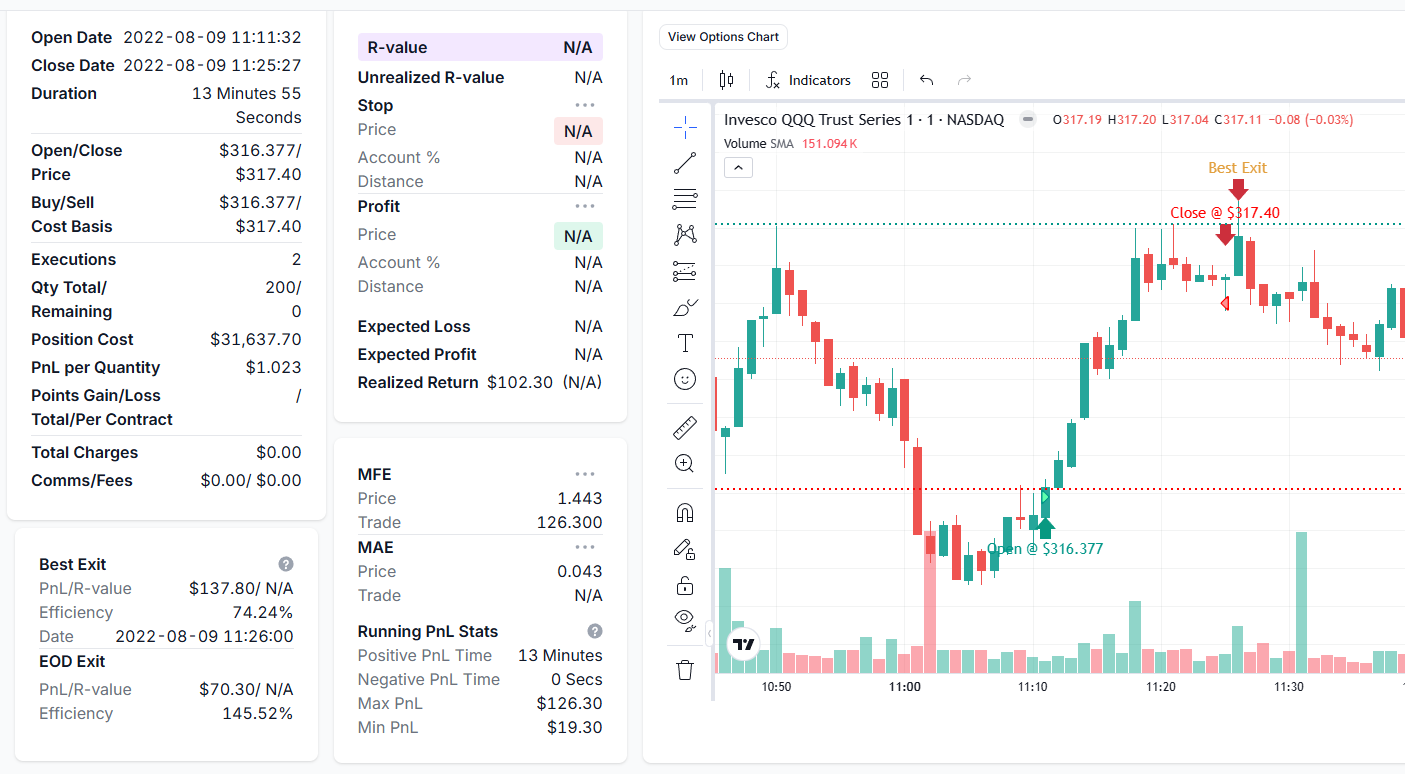
What the data shows: Your best exit PnL is consistently 2-3x your actual PnL. Your exit efficiency sits below 50%. When you compare the best exit time vs. the actual exit time, you're closing trades 30-90 minutes before the optimal point.
We've seen accounts where this gap added up to $12,000+ in unrealized profit over 200 trades. That's not missed opportunities in hindsight - that's money the trader would have captured with zero changes to entries, just better exits. In case you've forgotten the shocking comparison chart, here's the equity curve vs best exit equity curve again:
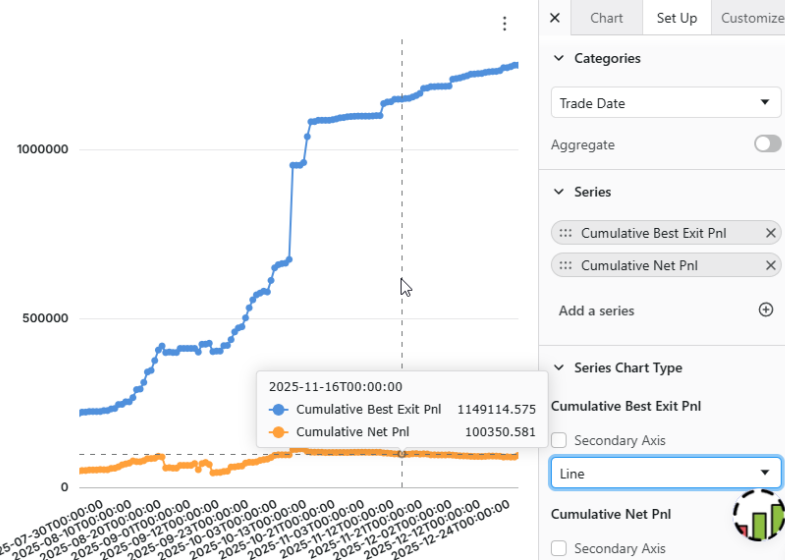
Again, the idea is never to perfect your exits (it's impossible), it is to capture at least a small percentage of them.
Problem 2: Exiting Too Late (Greed-Based)
The opposite problem. You're in a winner, it starts pulling back, and you think "it'll bounce." It doesn't. Your $500 winner becomes a $50 winner or a loser.
What the data shows: Your MFE is significantly higher than your actual exit PnL on a large percentage of trades. You had the profit. You just didn't take it. Your running PnL shows trades that peak and then decline while you watch.
Problem 3: No Exit Plan At All (Reactive)
The worst one. You enter with a setup but have zero predefined exit criteria. So every exit is improvised - based on emotion, gut feel, or whatever someone posted on X.
What the data shows: Exit times are all over the place. No consistency in hold duration. Exit efficiency varies wildly from trade to trade: 90% on one, 15% on the next. There's no pattern because there is no system.
How to Measure Your Exit Quality
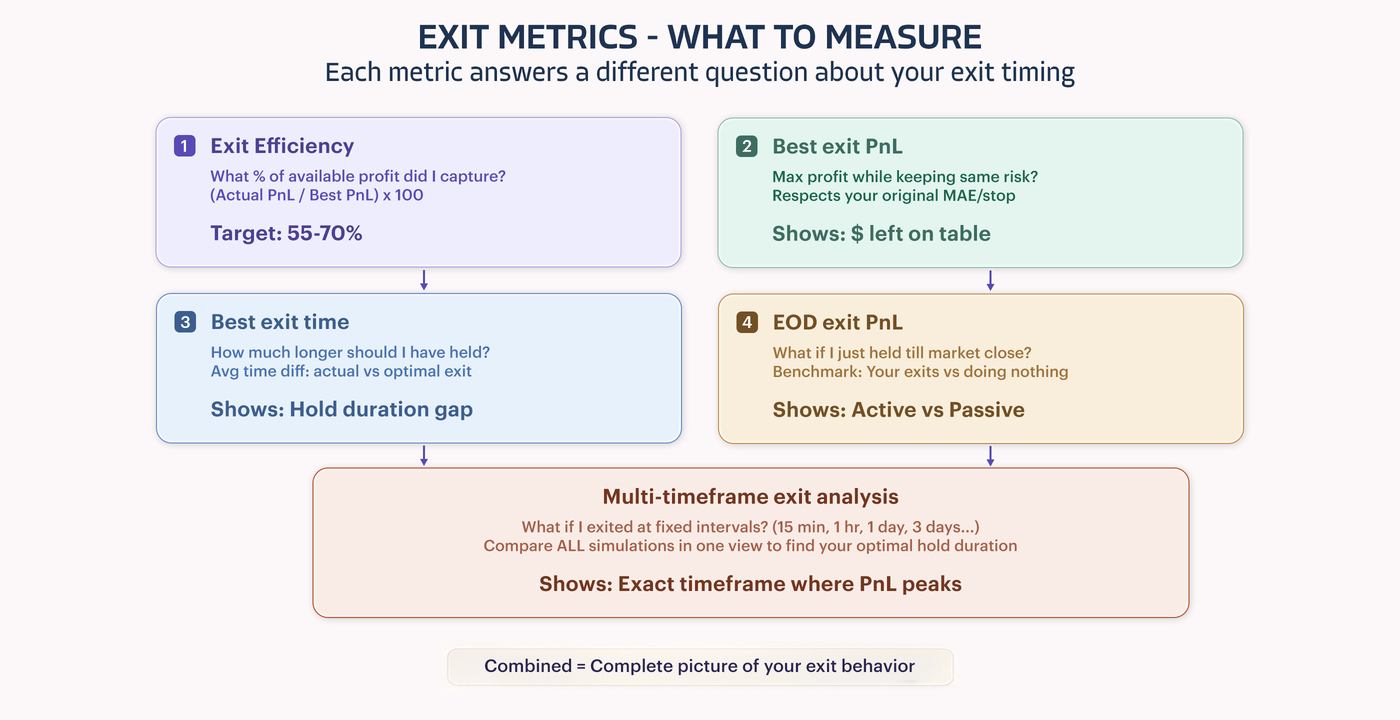
You can't improve what you don't measure. Here are the metrics that matter.
Exit Efficiency: The Single Most Important Number
This answers one question: what percentage of the best possible profit did you actually capture?
Exit Efficiency = (Actual PnL / Best Possible PnL) × 100
Made $300 on a trade where the best exit would have been $500? That's 60% efficiency.
Track this across all your trades. Most traders sit between 35-55%. Getting to 60-70% can transform your results without changing a single entry.
TradesViz calculates this automatically and lets you slice it by price range, volume, time of day, day of week, trade duration, and position size. This is where generic advice ends and real insight begins.
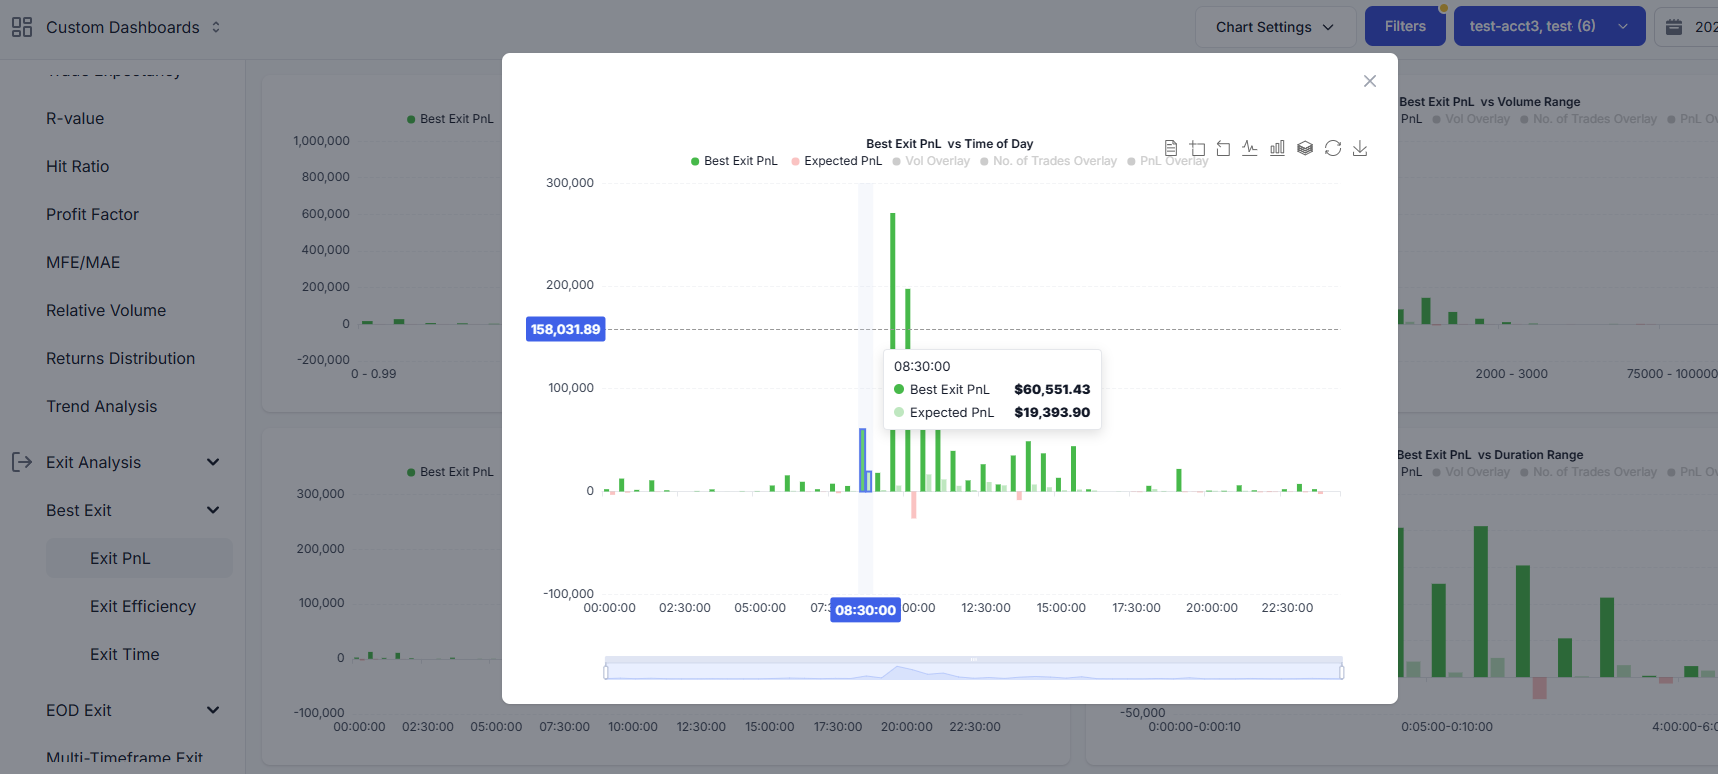
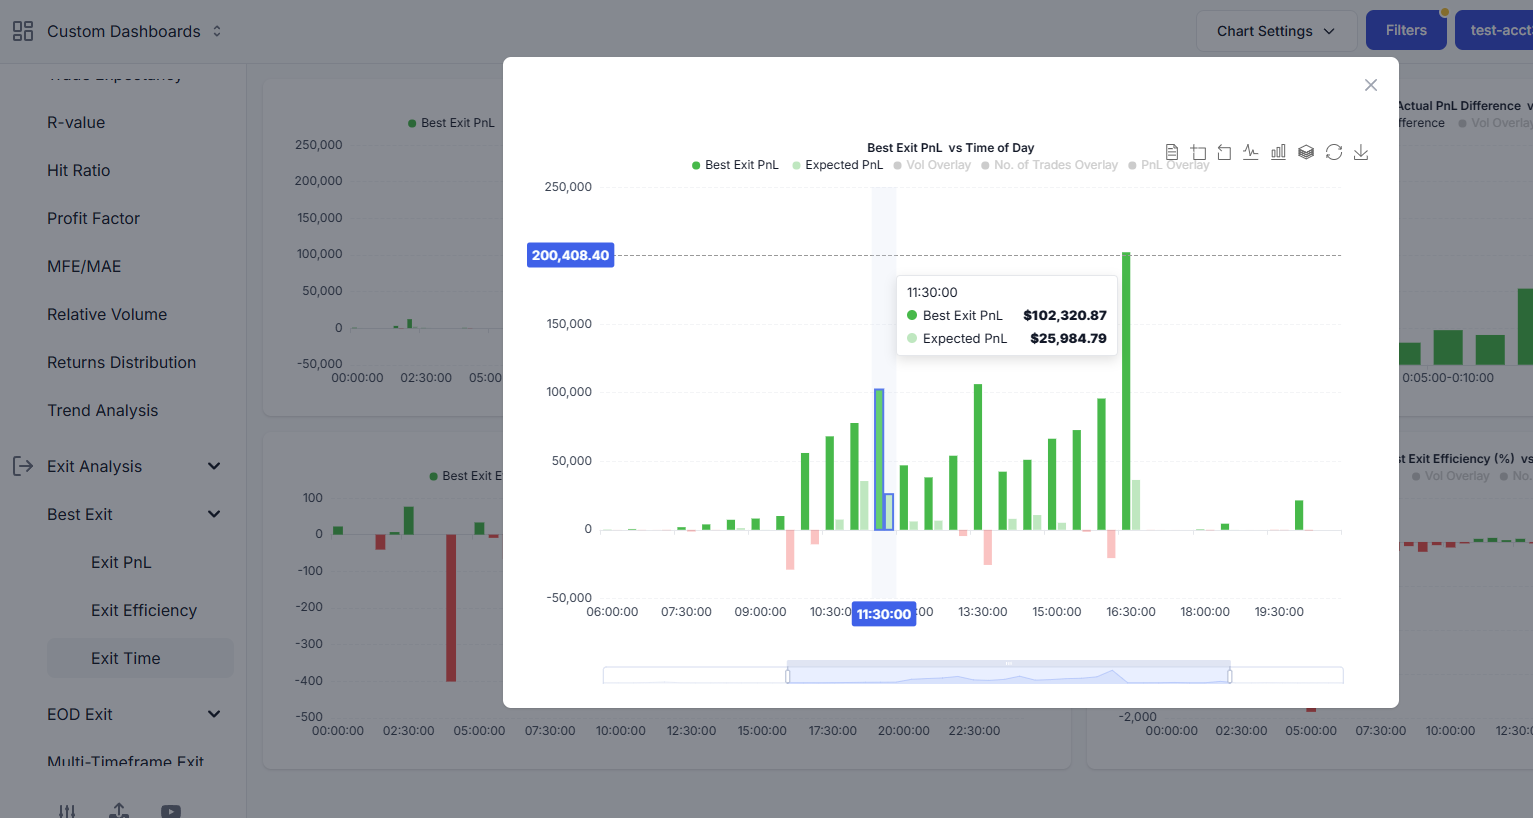
Best Exit PnL: Your Realistic Ceiling
This is the theoretical max profit you could have earned while still respecting your original risk parameters. This distinction is everything.
It's easy to look at a chart after the fact and point to the high of the day. That's cherry-picking. Our best exit calculation is different: what's the best price you could have gotten after your last execution, without ever exceeding the maximum drawdown (MAE) you actually experienced?
That constraint keeps it realistic.
This is where the misunderstanding comes up.
We're not asking "what if you timed the perfect top?" We're asking "what if your exit timing was better, with the same risk management?"
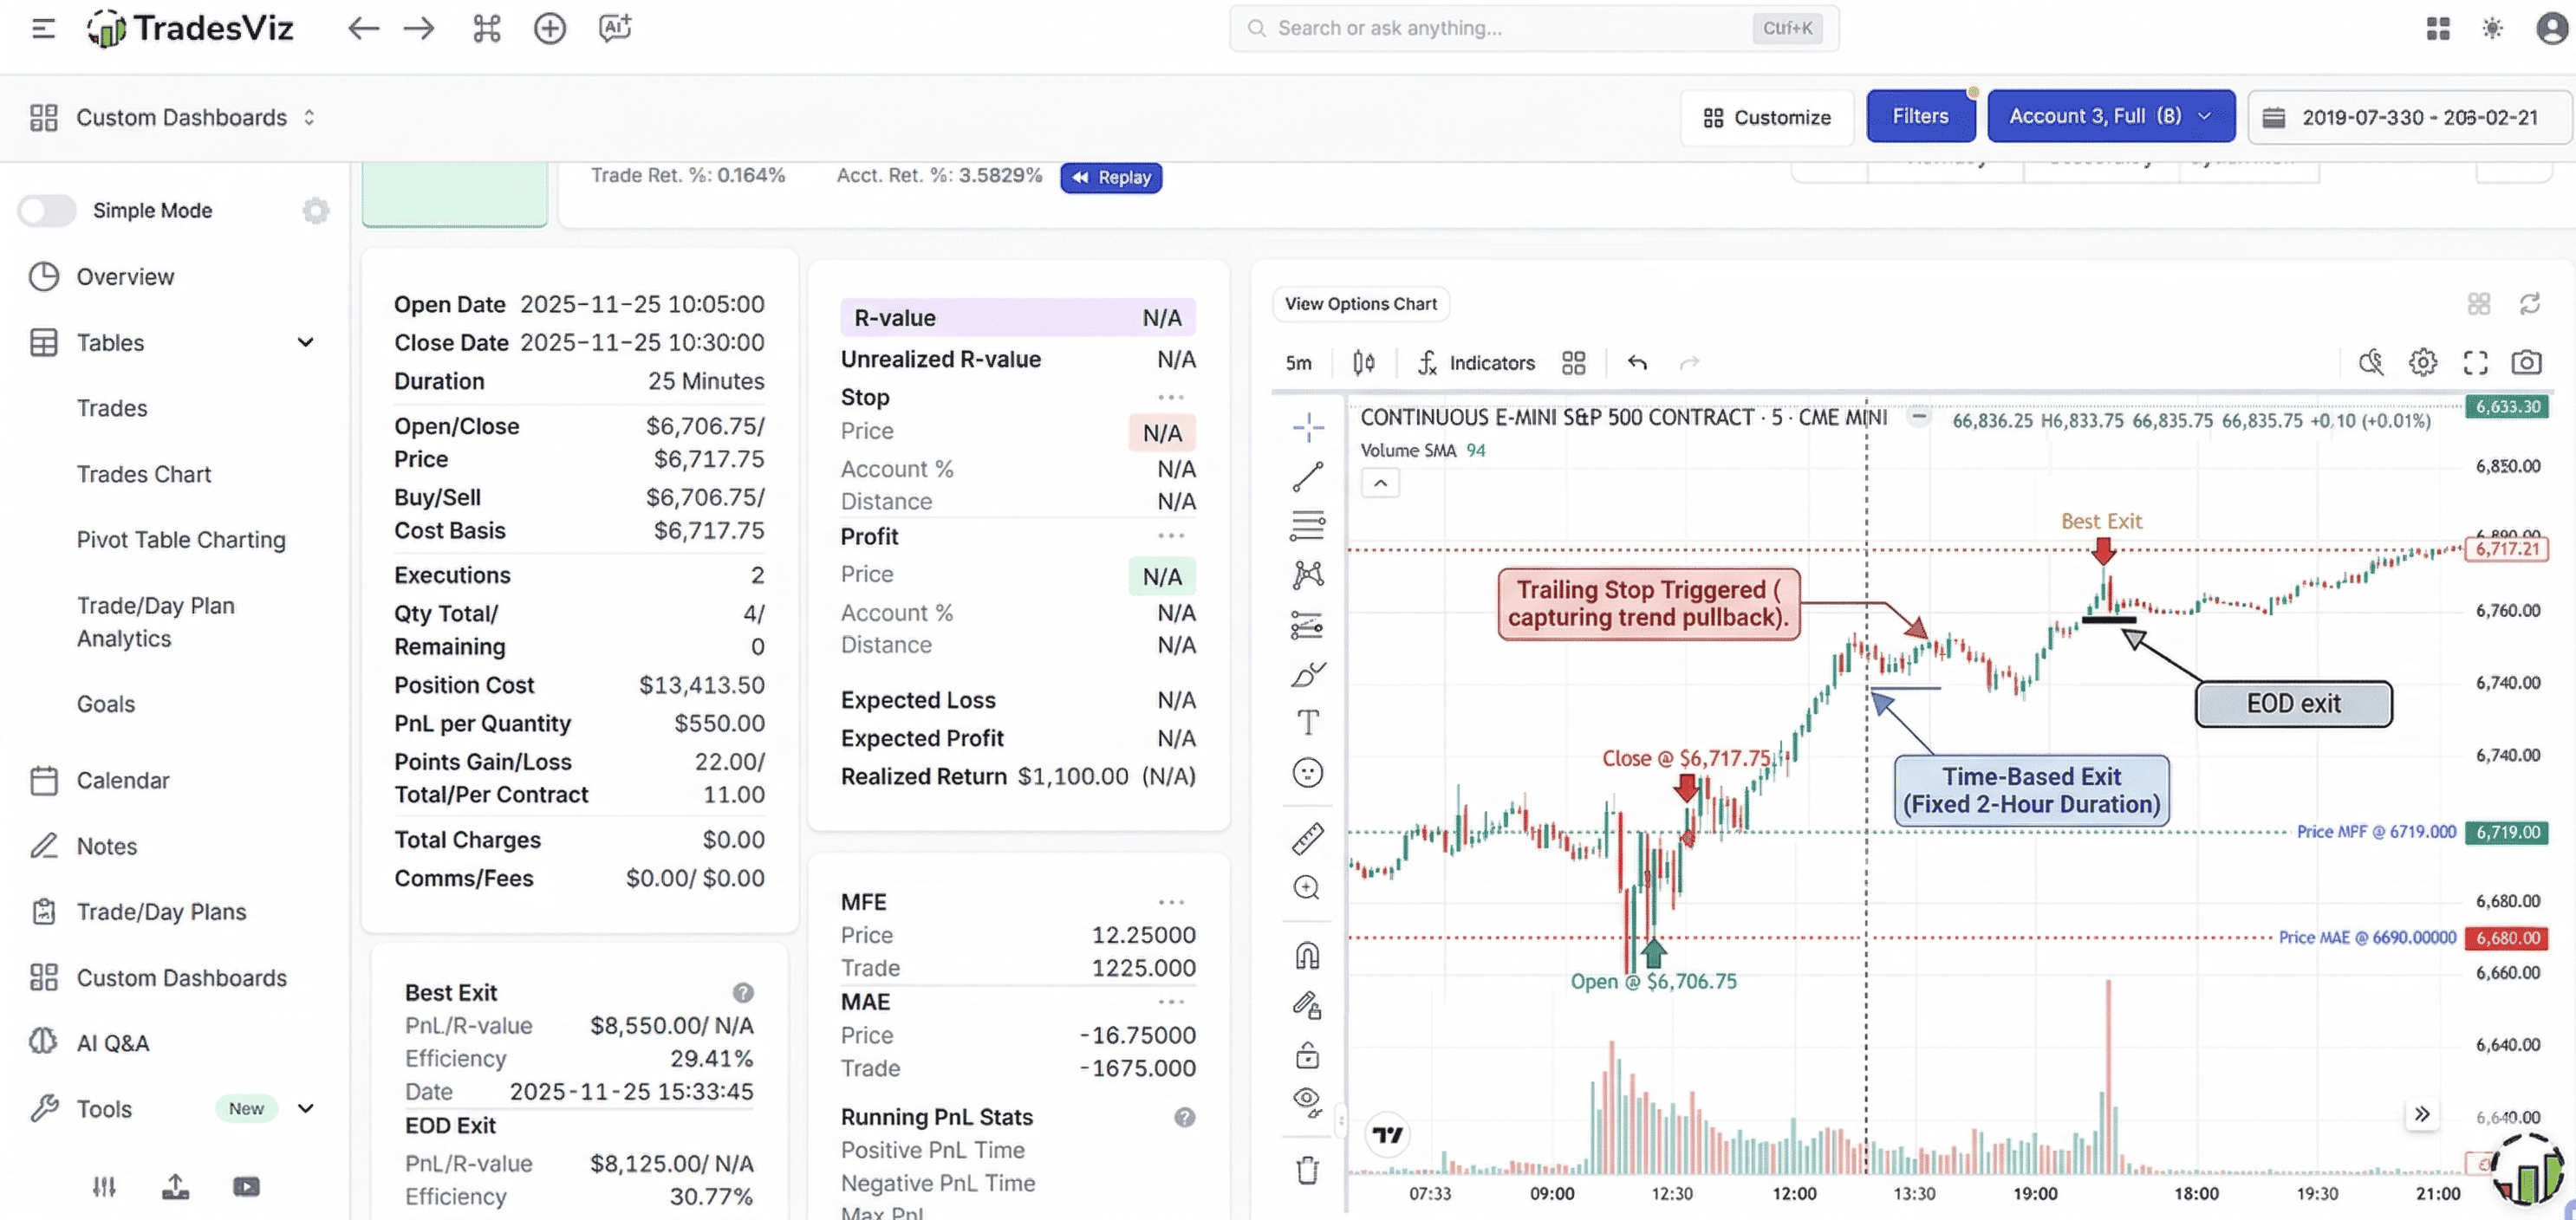
You don't NEED the "best exit" point. You should at least try to capture 20-30% of it. The above is a perfect example. No one can time the top or buy the dip exactly, but your own trading patterns can give you a clue on when you should probably try exiting.
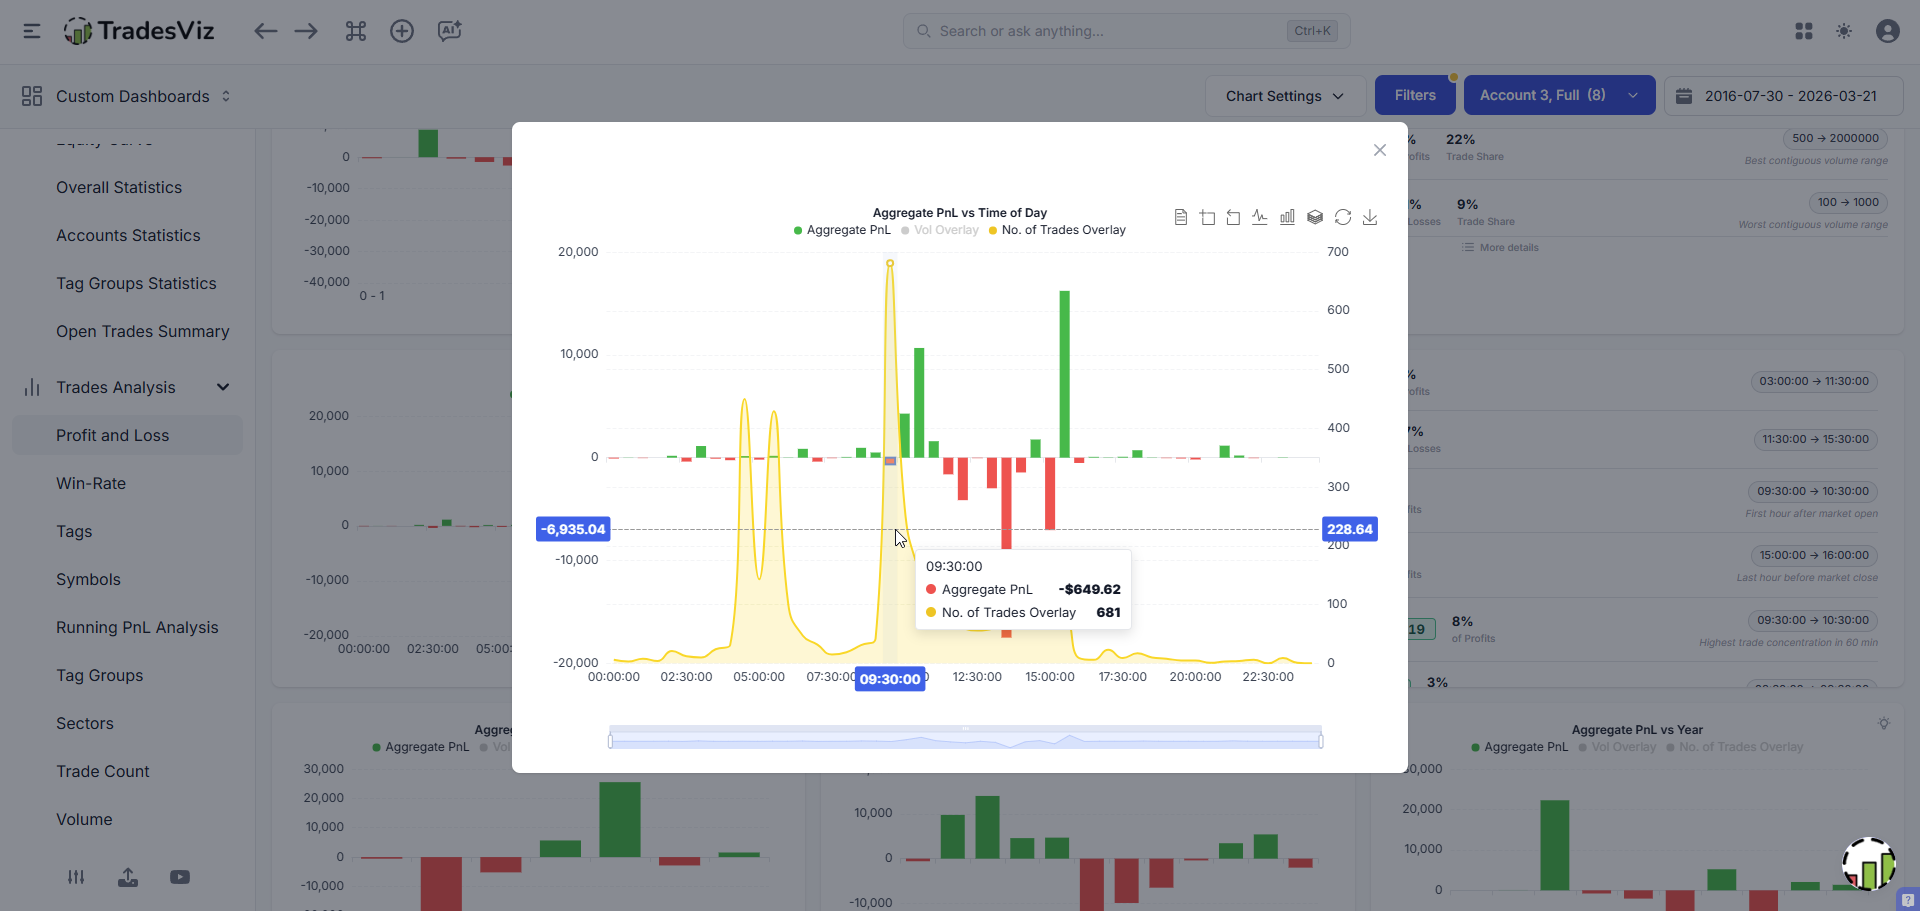
Best Exit Time: When Should You Have Left?
Aggregate best exit timing across all trades and patterns smacks you in the face.
In the original exit analysis walkthrough, we showed an example case where holding trades just 1-2 hours longer would have added ~$6,000 to their realized PnL. That's not a guess. That's the data.
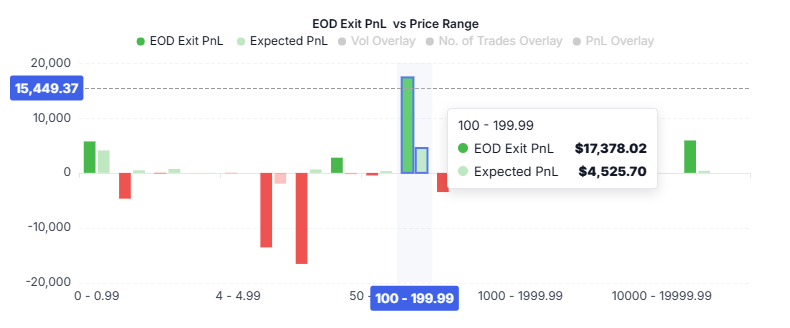
EOD Exit: The Simplest Benchmark
What if you had just held every trade until close?
Sounds too simple, but the results are often embarrassing. For many intraday traders, a blanket "hold till close" strategy outperforms their active exit management on a significant chunk of trades.
Our EOD exit analysis tests exactly this - how well your complex, active management compares against the dumbest possible alternative: do nothing and close at the bell. If EOD beats you, your "active management" is just active destruction of edge.
 |
 |
Key findings from real data:
- Sub-$5 stocks: riskier to hold to EOD (volatility works against you)
- Larger positions: tend to benefit more from EOD hold
- $20-$200 range: often shows the most consistent improvement
- Day of week matters: holding to EOD on Tuesdays might work great but get destroyed on Fridays
Multi-Timeframe Exit: Finding Your Optimal Hold Duration
What if you didn't hold till EOD, but held for a specific additional duration? 15 minutes. 1 hour. 1 day. 3 days.
Multi-timeframe exit analysis takes your first execution and simulates exits at fixed intervals. This directly answers: "Am I a scalper who should be a swing trader?" or "Am I holding too long when I should be taking faster profits?"
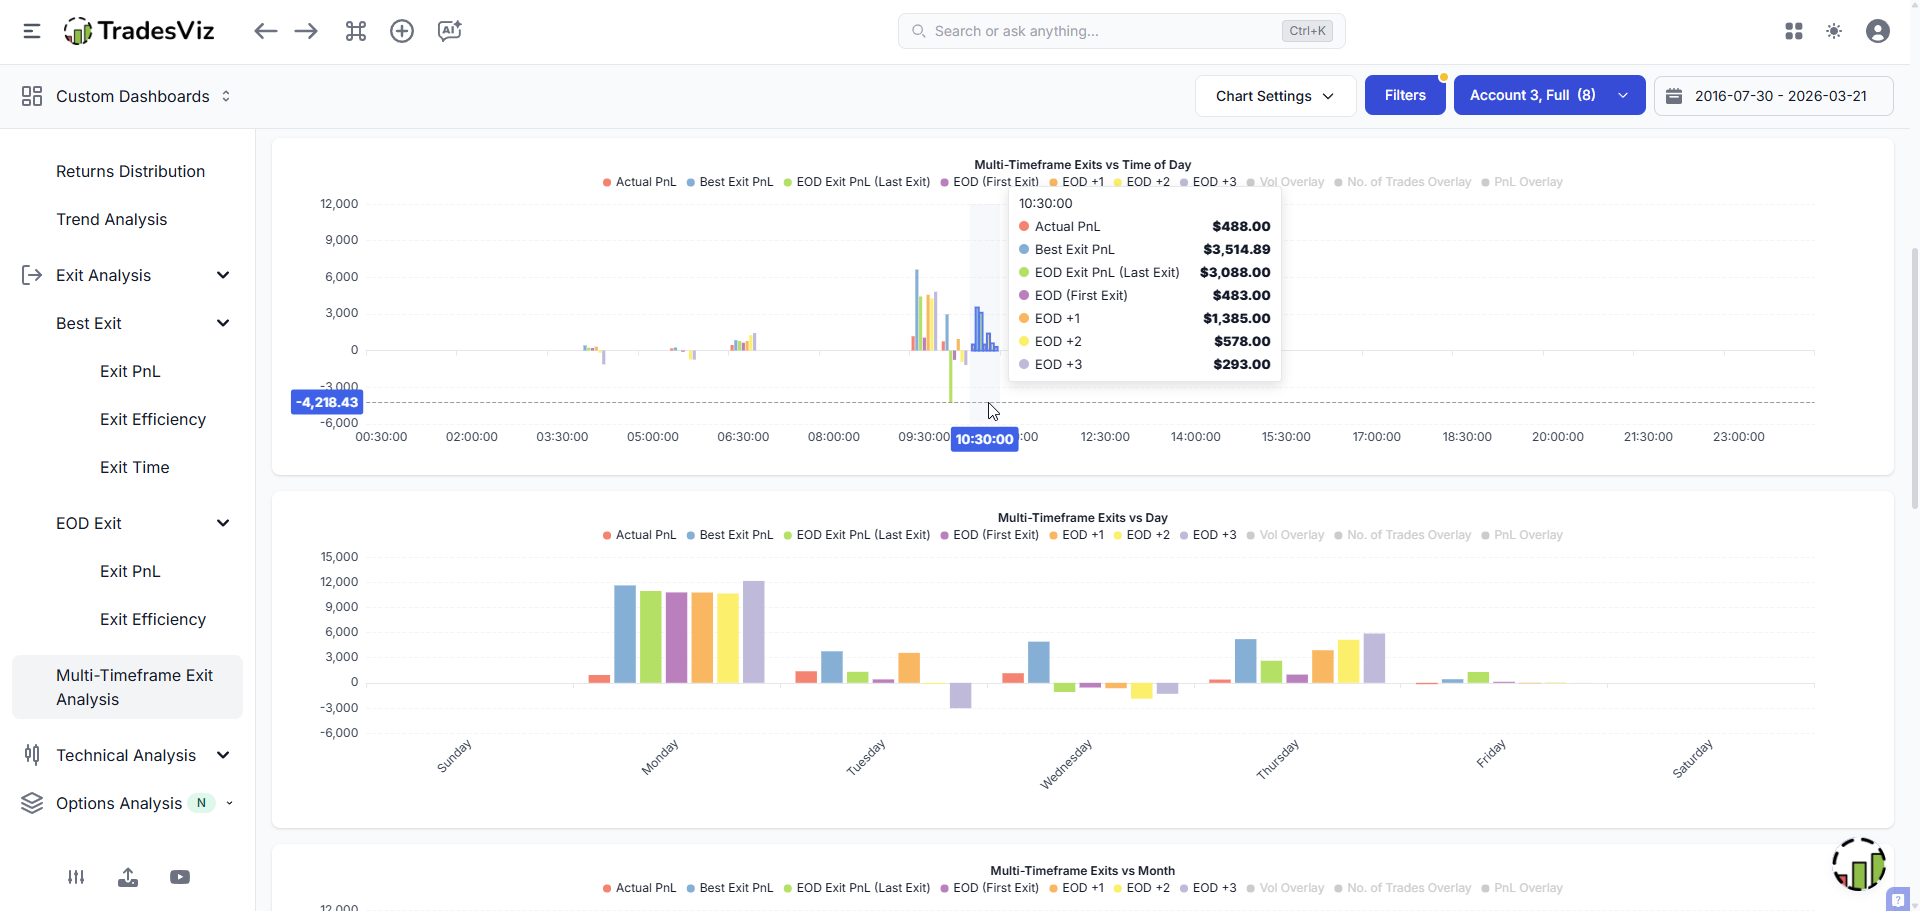
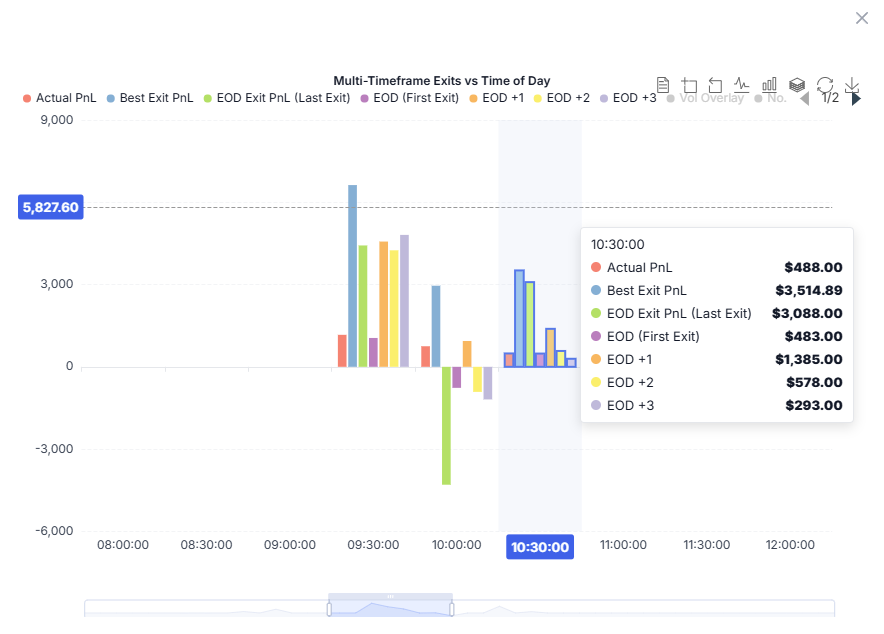
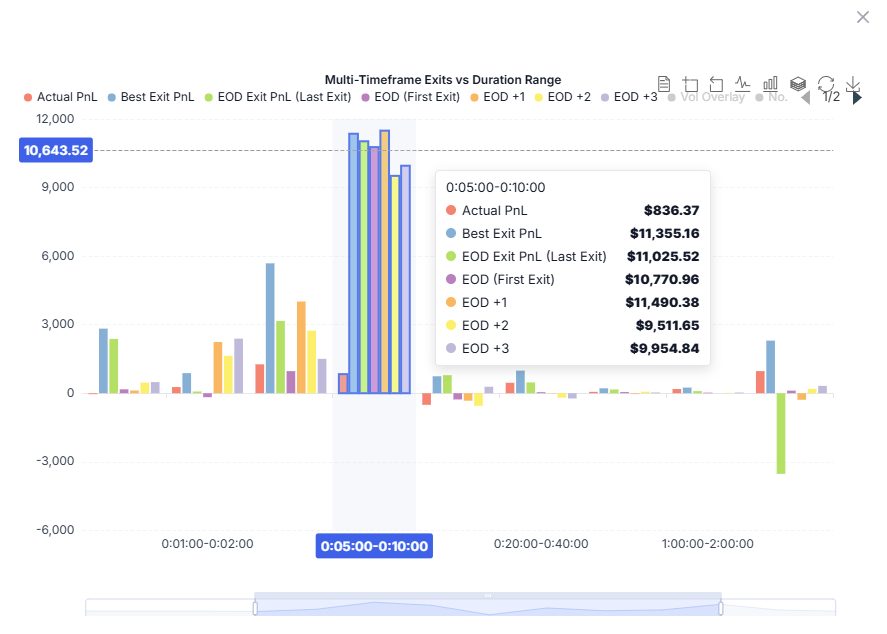
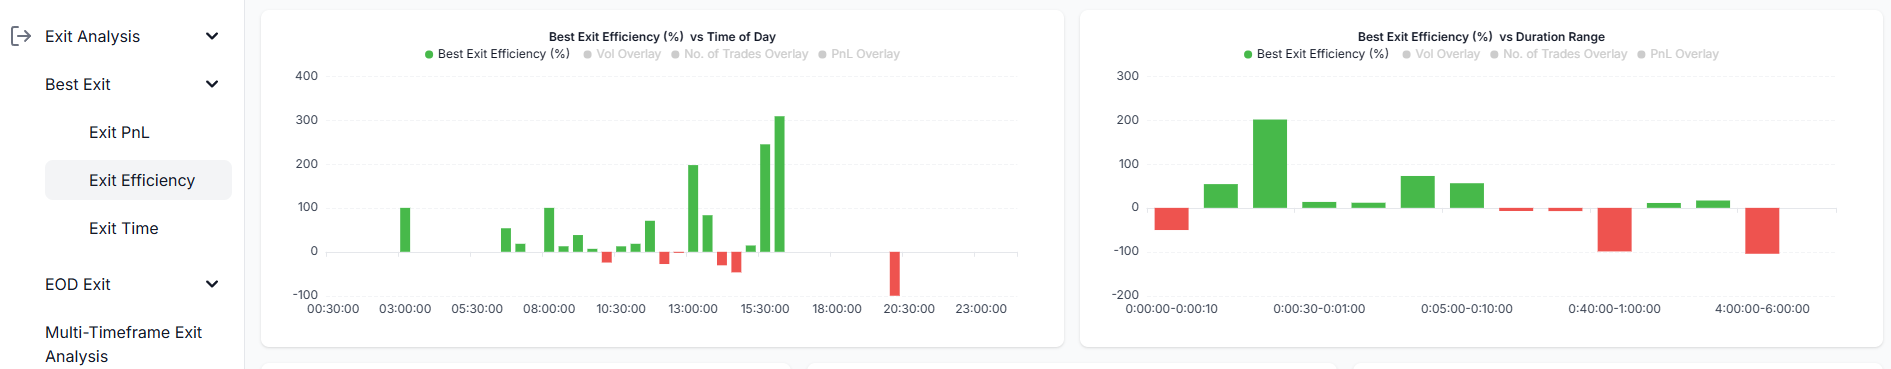
Below is a zoomed chart of Multi-timeframe exit vs time of day and Multi-timeframe exit vs duration range.
 |
 |
The main goal of this statistic is not to tell you to exit after a specific time, but it is simply to find what your entries tell about your trading potential. Simple P&L vs. time, day, etc., is done and over. If your journal isn't making you think about your entries and exits, if you are not seeing interesting analysis like this presented to you, you are just wasting time and money using toys instead of professional tools. We're looking at *every* other journal here in comparison.
TradesViz vs. Competitors: 2026 Breakdown
Thinking about switching? See exactly why traders are choosing us in this comprehensive review.

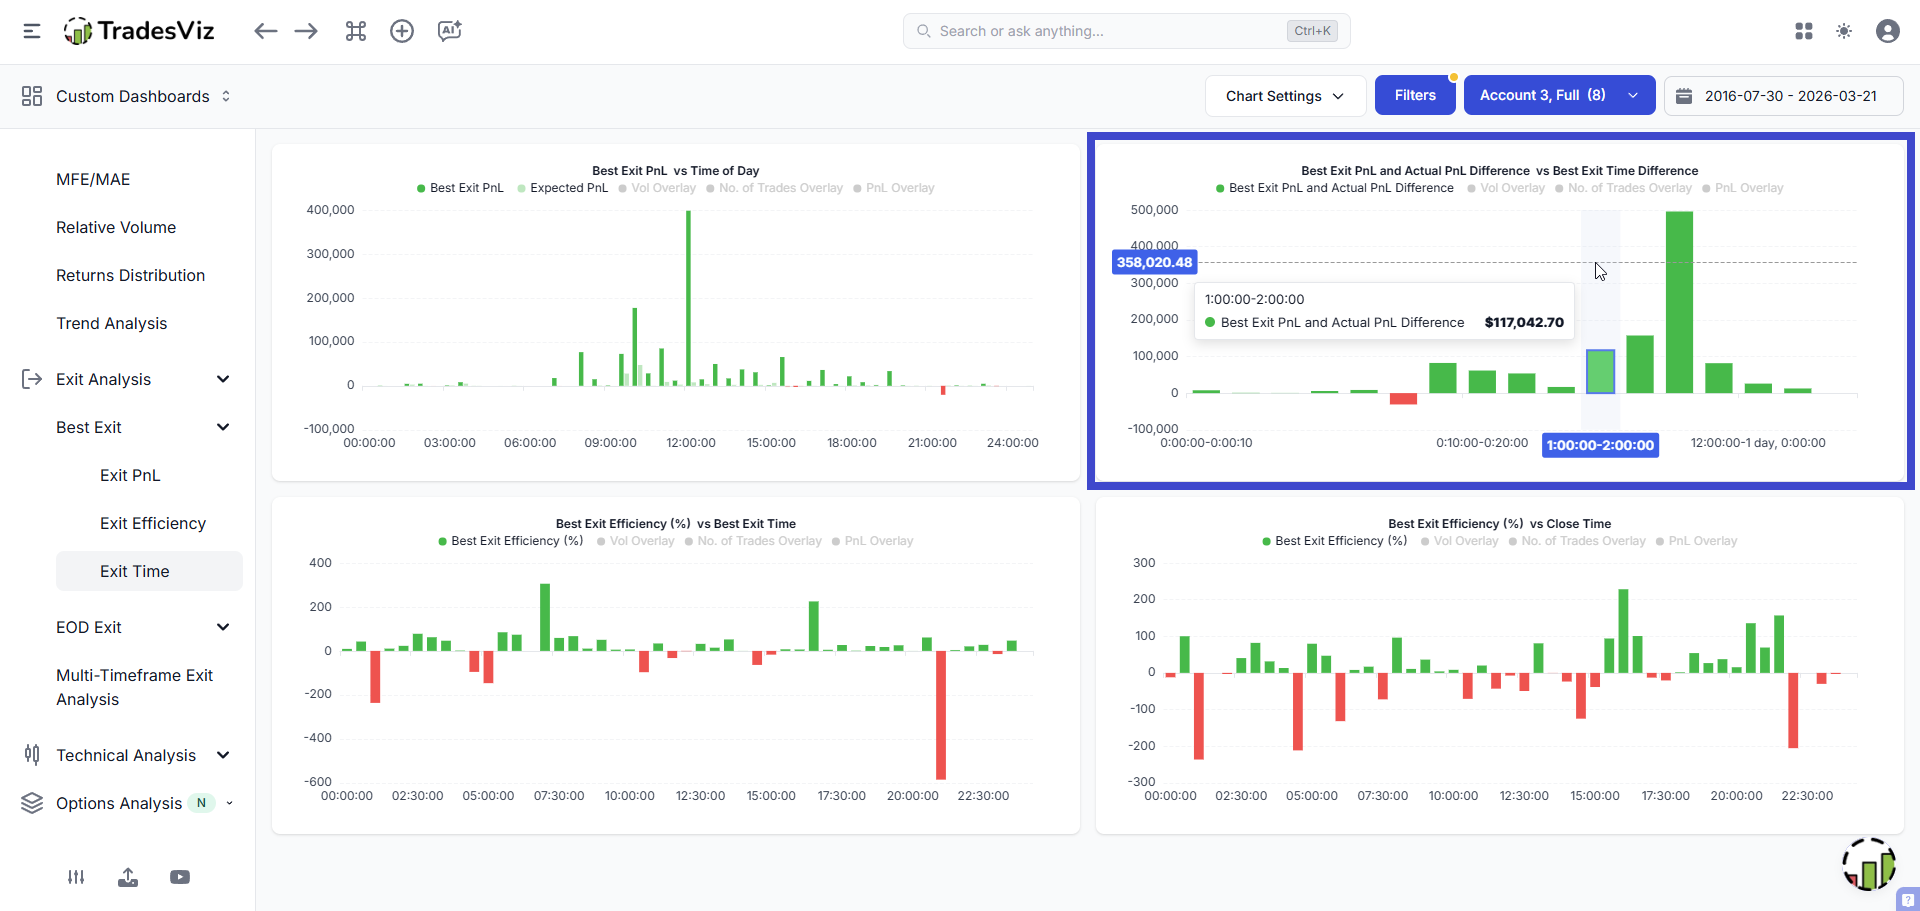
You can also compare ALL simulations in one chart - actual vs best exit vs EOD vs multi-timeframe sliced by every dimension. This is something no other journal even attempts to offer.
MFE/MAE Duration: The Time Dimension Nobody Talks About
We found a gap in our own exit analysis suite. Most exit analysis focuses on price. But time matters just as much.
A trade that moves sideways for 3 hours is trapping your capital, incurring opportunity cost, and taxing your mental energy. Our MFE/MAE duration analysis tracks the exact time elapsed between entry and the occurrence of your Maximum Favorable Excursion, using the highest-granularity data available for each asset type.
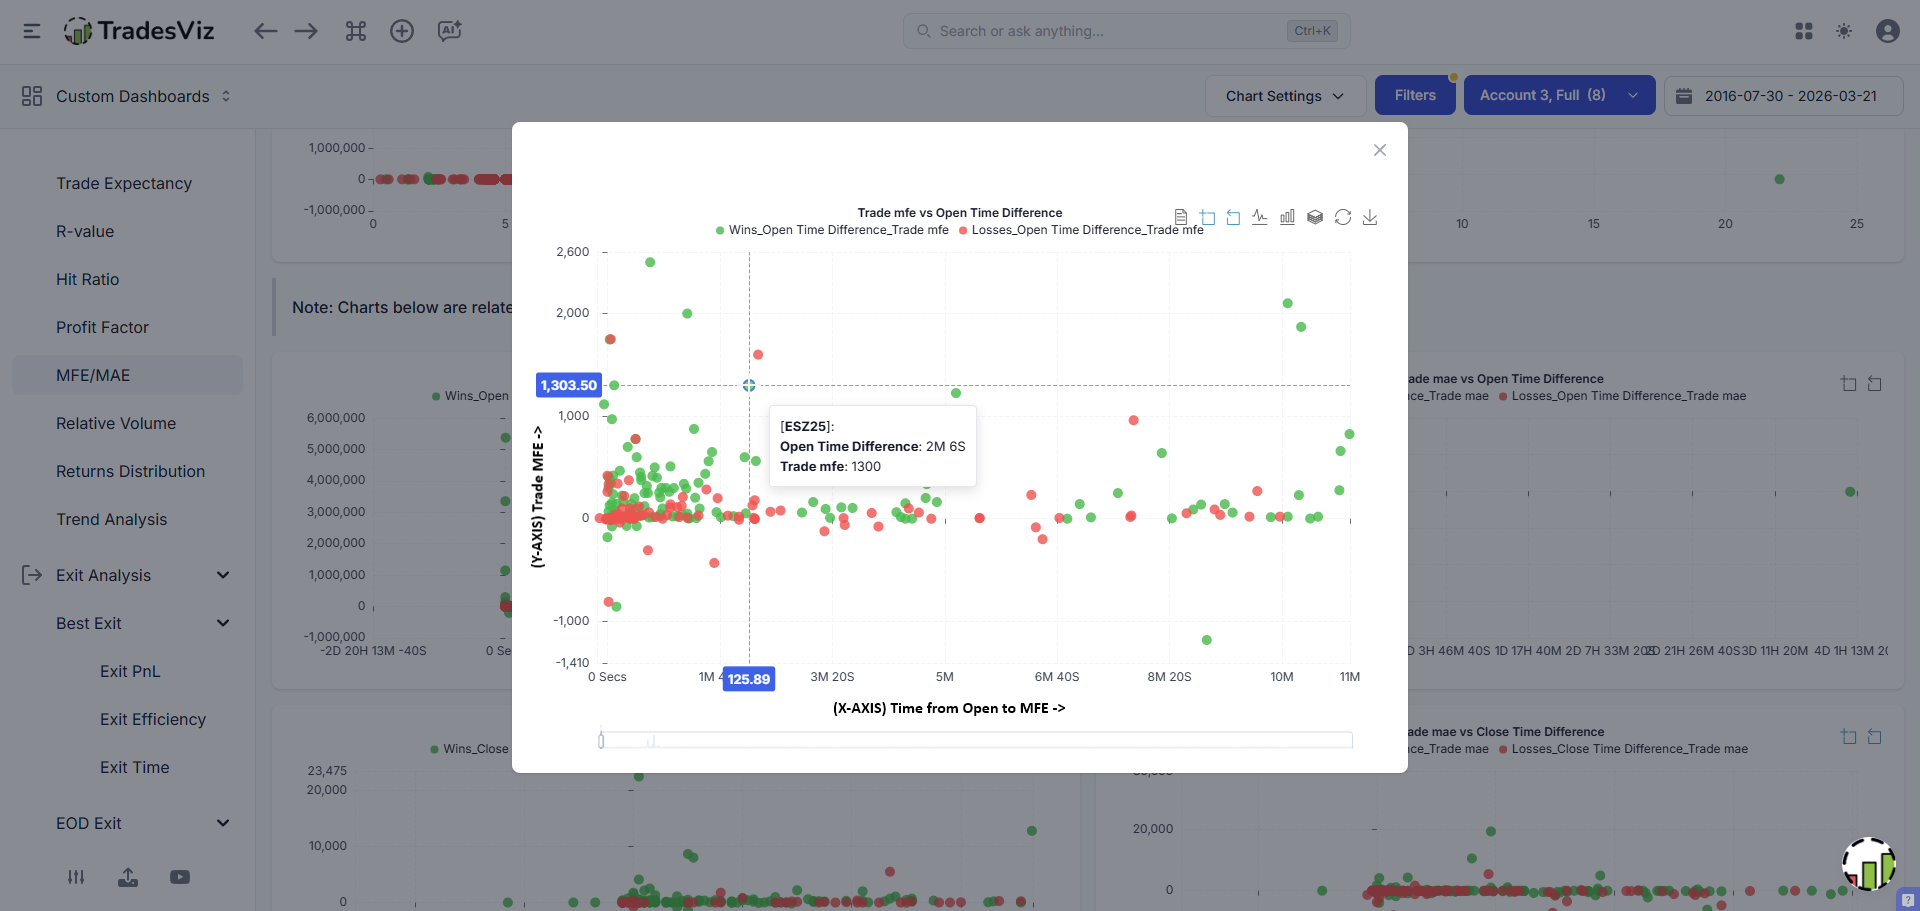
Why does this matter? If your data shows that winning setups typically hit peak profitability within 2-3 minutes, then holding those positions for 2 hours is exposing capital to reversion risk for no reason.
Time-stops are an institutional concept that almost nobody in retail trading talks about. TradesViz has this data. Use it.
The Scaling Question: Is Scaling In/Out Actually Helping You?
This is a question we see constantly, and the multi-timeframe analysis answers it definitively.
Our system distinguishes between First Exit PnL and Last Exit PnL:
- Last Exit PnL: Simulates moving your final execution (total blended position) to a different point
- First Exit PnL: Isolates just your initial entry, ignoring all subsequent scale-ins
Why does this matter? Because a lot of traders assume scaling into a position adds alpha. They add size as "confirmation" builds. But when you compare the two calculations side by side, you sometimes discover that the scale-ins were actually diluting the superior positioning of the initial entry.
Example:
- Buy 50 AAPL @ $185.00 (first entry)
- Buy 50 AAPL @ $186.50 (scale-in)
- Sell 100 AAPL @ $188.00
Your blended cost is $185.75, your profit is $225. But if you had just held the original 50 shares to $188.00, you'd have made $150 on half the capital. The scale-in added $75 of profit but required $9,325 of additional capital.
The above shows a perfect example. Was it worth trading so much at the market open?... In this case, absolutely not.
Was that worth it? The data will tell you. Run this across 100+ trades, and you'll know whether your scaling strategy is generating real alpha or just making you feel busier.
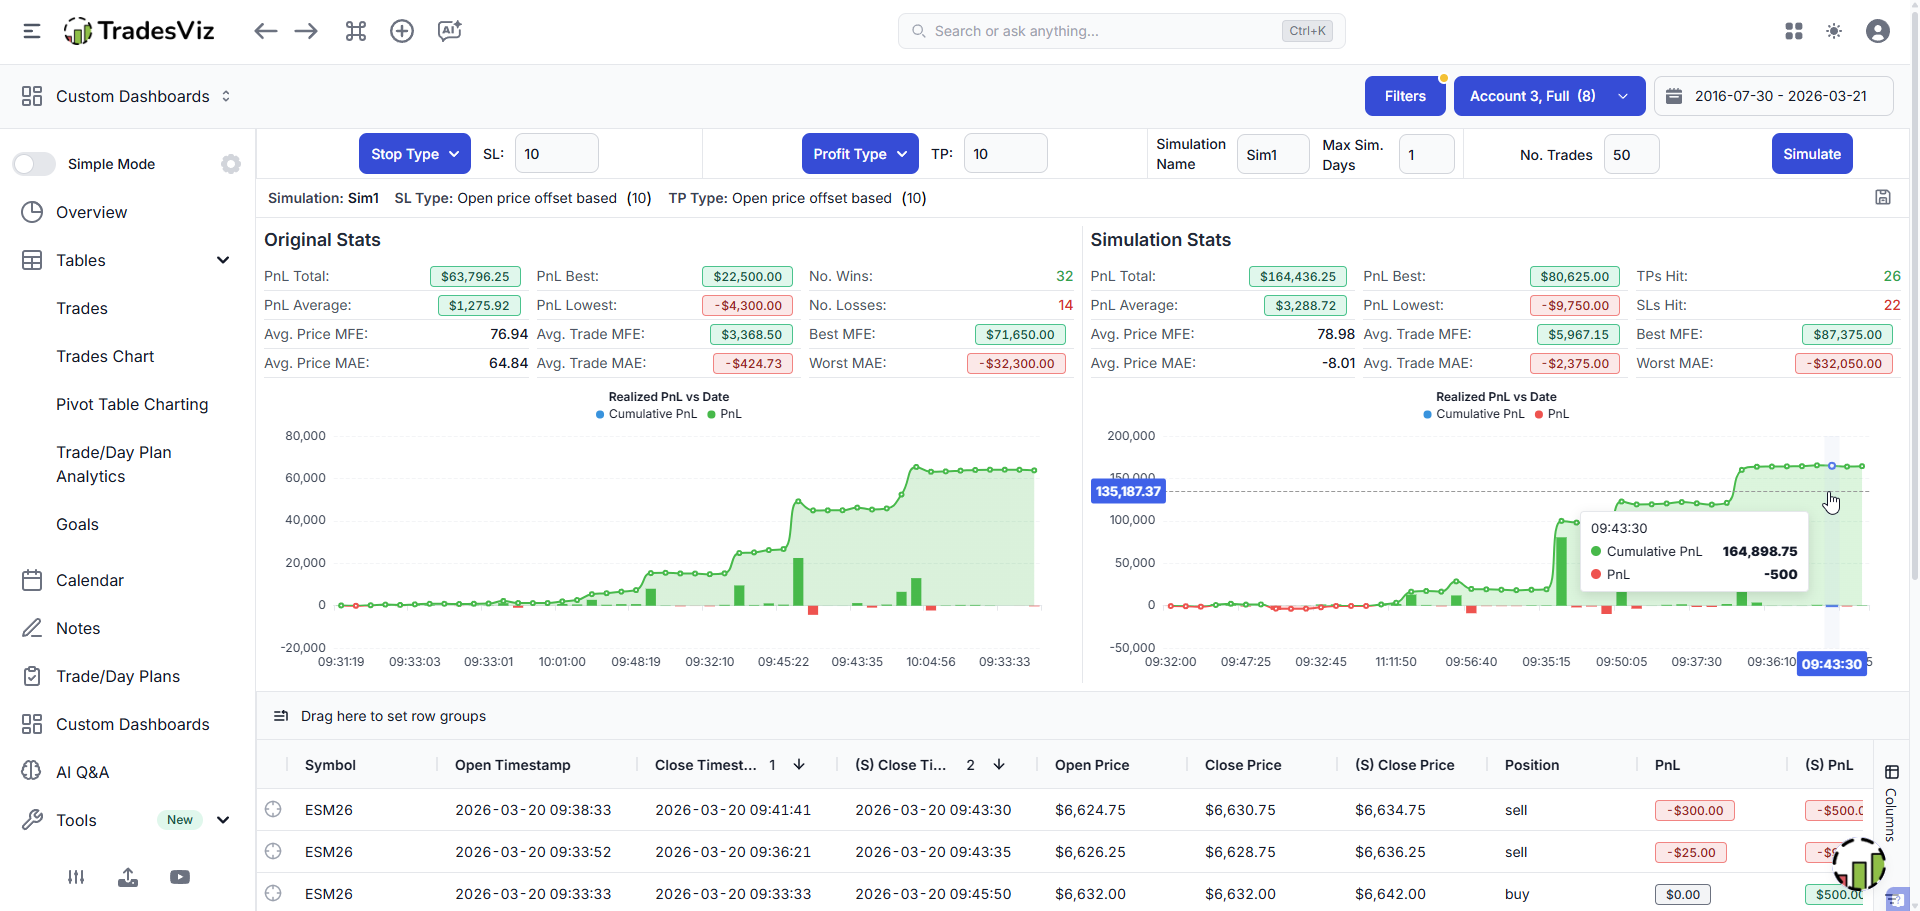
The curve on both sizes looks the same, but notice the Y-axis scale... This is the type of change you will see when you make zero changes to risk management, but still improve your exit performance.
A Framework for Better Exits: What to Do
Step 1: Establish Your Baseline
Before changing anything, check your exit analysis across your last 100+ trades and answer:
- What is your average exit efficiency?
- What is the total dollar gap between actual PnL and best exit PnL?
- What is the average time difference between your exit and the best exit?
- Does holding to EOD improve or hurt overall?
- At what multi-timeframe interval does simulated PnL peak?
- What is your average MFE duration? (i.e., how quickly do your winners peak?)
Write these down. This is your "before" picture.
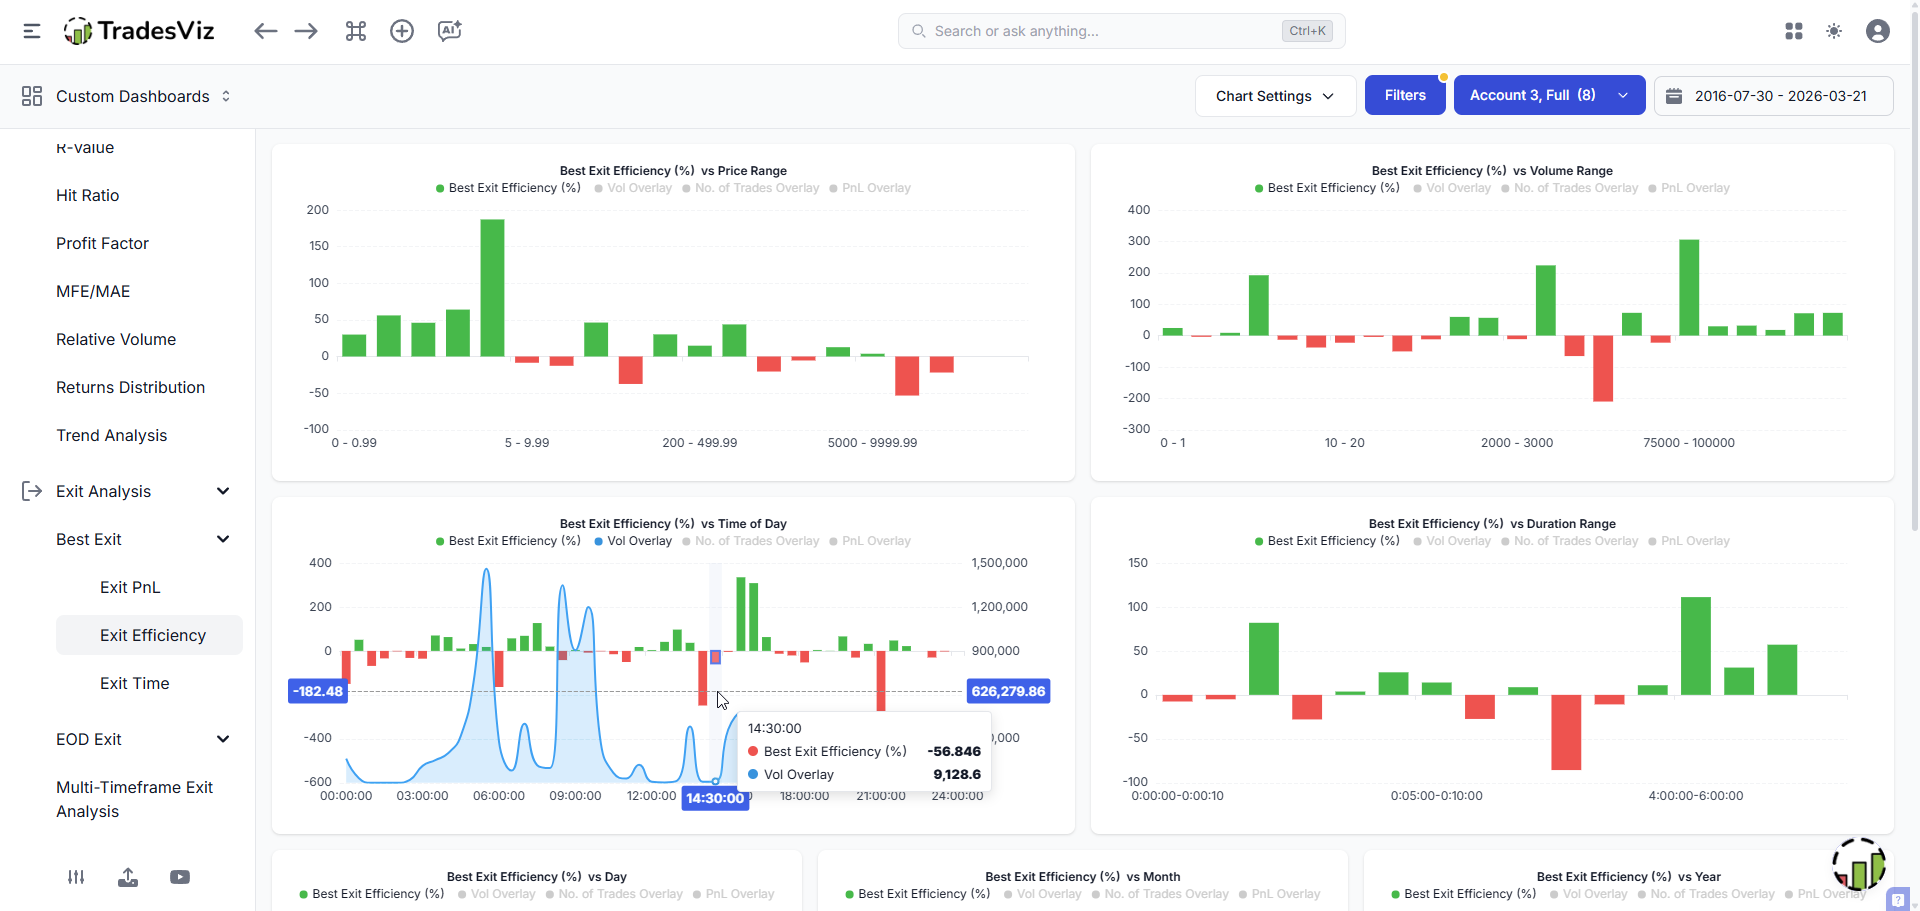
Step 2: Find Your Worst Segments
Your exits aren't uniformly bad. They're bad in specific conditions. Slice your exit efficiency by:
- Price range: might exit well on $100+ stocks but terribly on sub-$10
- Time of day: morning exits at 65% efficiency, afternoon at 35%?
- Day of week: Friday exits consistently poorly because you're rushing? - think about it!
- Trade duration: sub-15 min trades with worst efficiency? You're scalping when you should be holding
- Volume: high vs low volume names need different treatment
- Setup type: use tags to categorize and compare
When you discover that your exit efficiency drops from 62% to 38% after 11 AM, you have a specific, solvable problem. Maybe you switch to time-based exits for afternoon trades. Maybe you automate exits after a certain hour, or (finally, as a last resort), maybe you stop trading after 11 AM. Explore ALL of these options!
One of the biggest mistakes other journals (and trading gurus) FORCE you into is to simply "avoid" the red. This does NOT work.
You CANNOT simply avoid red/bad performing zones unless you have exhausted all other options. As an example, you avoid the 9:30-10 range. Next, you see more red in 10, so you avoid 10-10:30... do you see the pattern?... You will come to a state where your journal tells you not to ever take a trade. This is what other journals ask you to do (how convenient...).
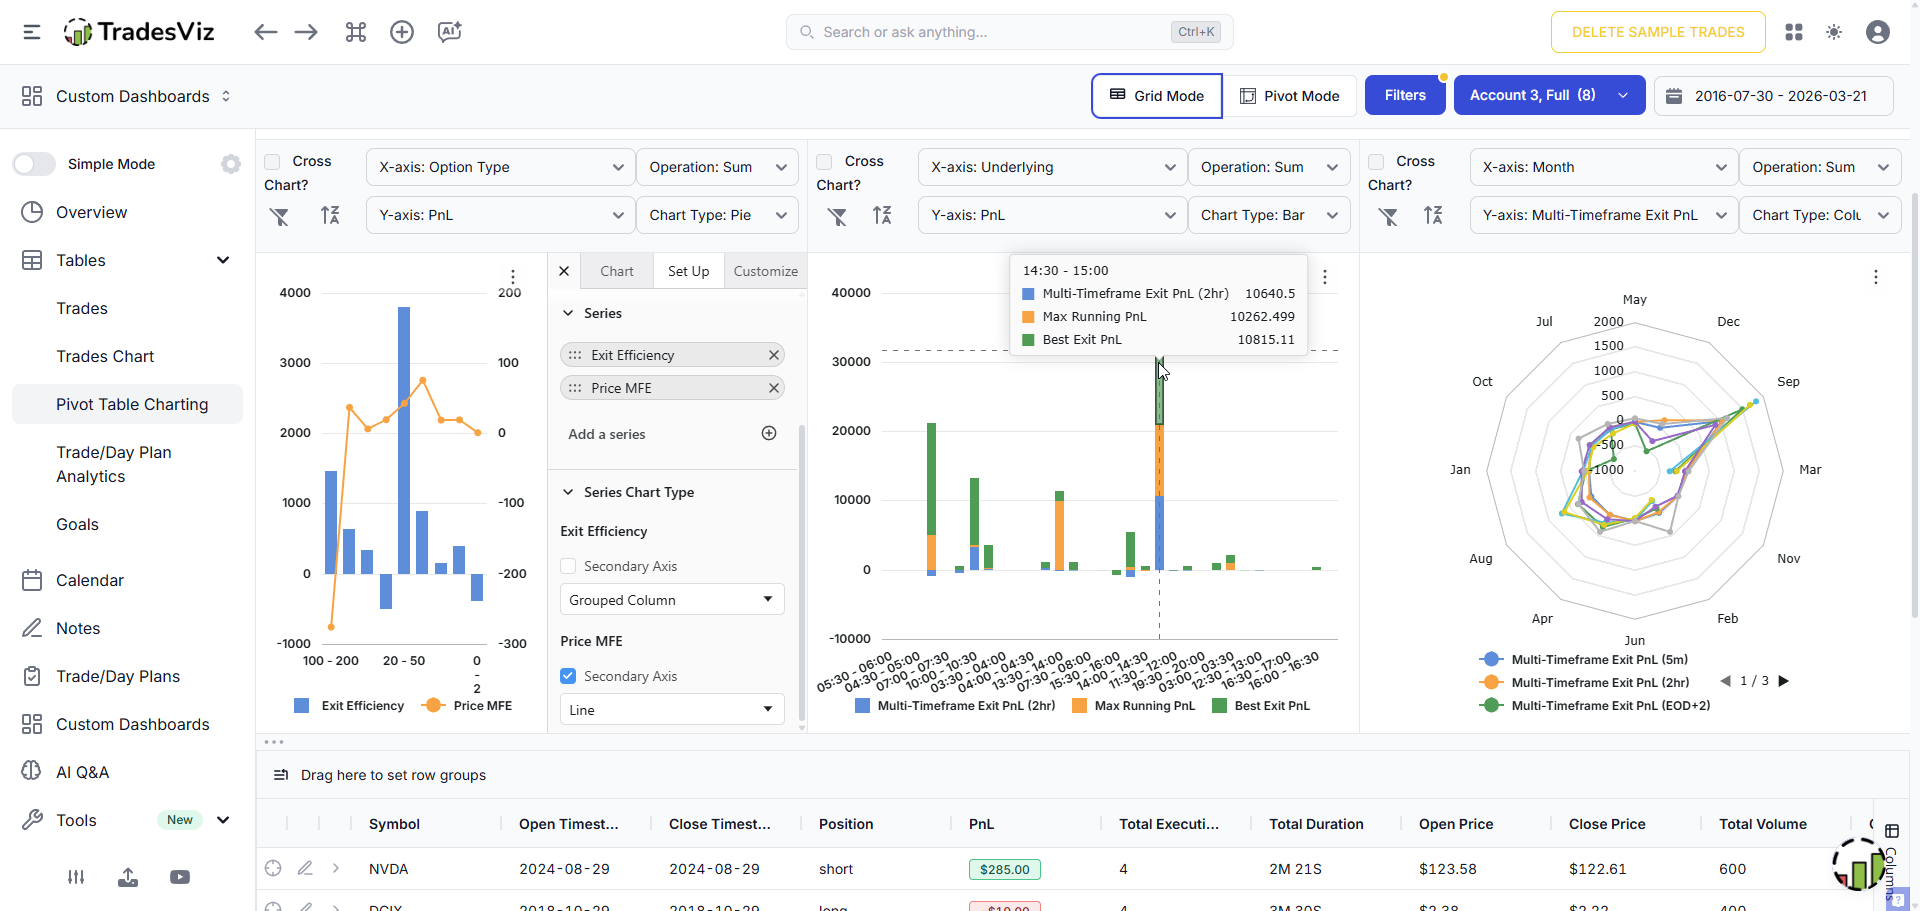
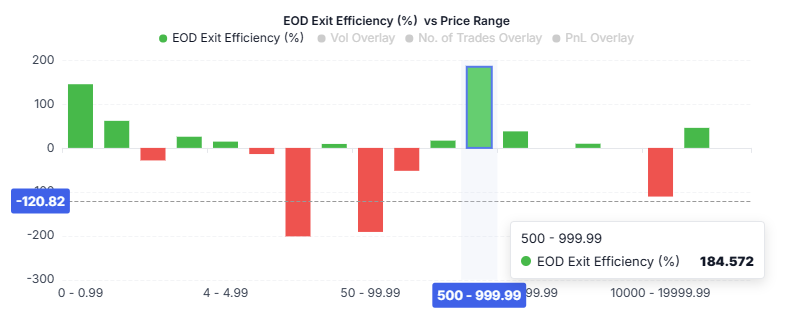
As an example, this pivot grid page shows 3 charts each with multiple data points in the chart. From left to right:
Exit efficiency vs Price MFE: Why is this interesting? This chart overlays how well you timed your exits compared to the absolute maximum potential of the trade. The X-axis categorizes these trades into specific grouped bins (e.g., "100 - 200", "20 - 50"), which represent specific price ranges.
Stacked bar chart - Multi exit comparison: As seen in the active tooltip for the 14:30 - 15:00 block, this allows you to see if your afternoon trades would perform better by holding them for a rigid time frame (2 hours) versus trying to hit the theoretical "Best Exit" peak. The important part here is that you can visually see what type of exit strategy would be better (i.e., more returns).
Radar chart - multi-timeframe seasonality: This visualizes whether certain hold durations work better in specific months. For example, the chart shows a notable spike on the green line (EOD+2) toward September, which might indicate that multi-day swing holding was highly profitable during that month, while shorter scalps (5m) stayed relatively flat year-round.
(You can ignore the chart dropdowns for each of these charts shown above, as we are using the non-cross chart mode, where we can select from ANY of the 90+ columns. Learn more here.)
Step 3: Define Exit Rules Based on the Data
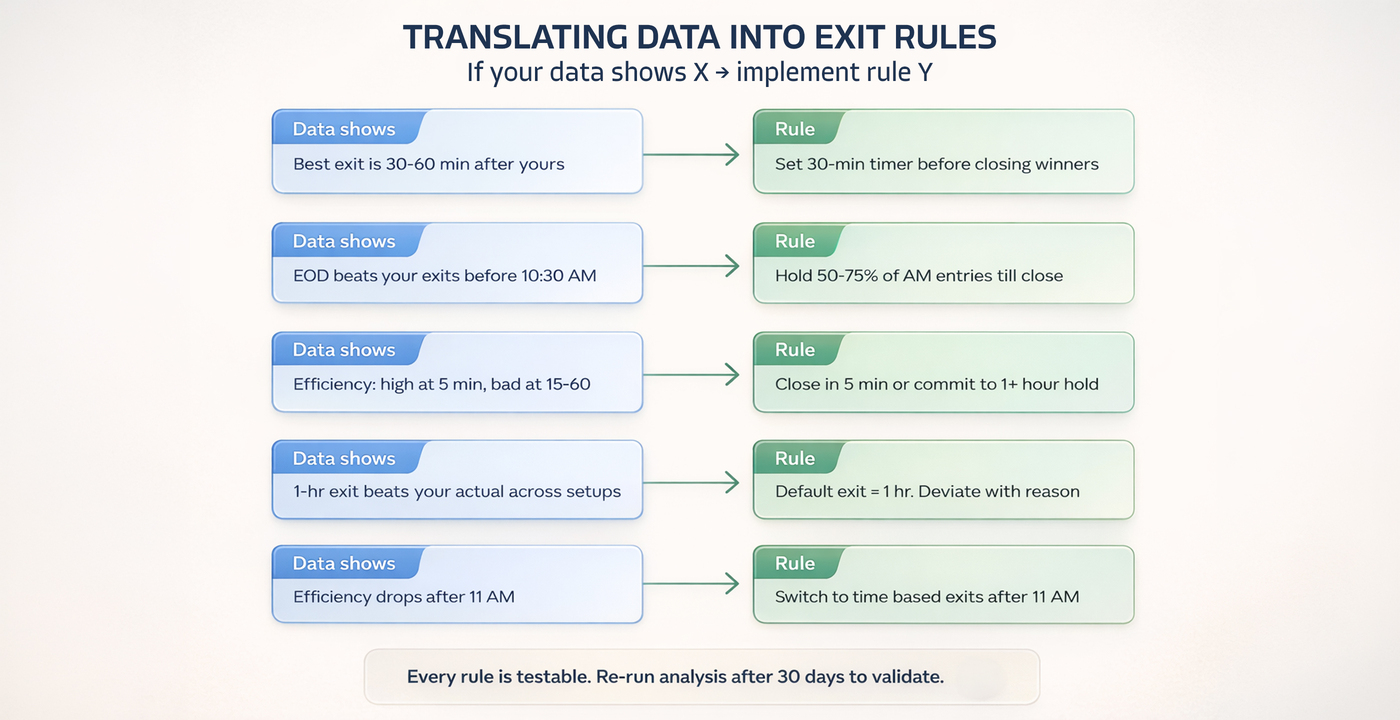
Take your worst segments and define specific rules:
Data shows: Best exit is consistently 30-60 min after yours on winners. Rule: Set a 30-min timer before closing. Trail your stop instead of taking a fixed target.
Data shows: EOD exit outperforms on trades entered before 10:30 AM. Rule: Hold 50-75% of morning entries until last 15 min of the day.
Data shows: Exit efficiency is high for quick scalps (<5 min) but terrible for 15-60 min holds. Rule: If it's not working in 5 min, close it. If it IS working, commit to holding 1+ hour with a trailing stop. No middle ground.
Data shows: MFE duration peaks at ~20 min for your setups. Rule: Implement a time-stop. If the trade hasn't hit peak momentum within 25 min, close it — the statistical window is expired.
Data shows: Multi-timeframe 1-hour exits consistently beat your actual exits. Rule: Default exit = 1 hour after entry. Need a specific, predefined reason to deviate.
You can test these before applying them live using TradesViz's Targets Simulator, which runs stop-loss and profit target scenarios across your historical trades.
Step 4: Use Partial Exits (The Data Will Tell You the Split)
Your data will often show:
- 50% off at target + 50% trailing to EOD beats both all-in and all-out
- Taking 100% at target beats holding 100% to EOD (because losers get worse)
- But the 50/50 approach captures both safety and upside
The optimal split depends on YOUR data. Not a guru's opinion. Pay attention to trades where the best exit price is dramatically higher than your actual exit — those are the trades where partials would have made the biggest difference.
Step 5: Re-Measure After 30 Days
Apply new rules for 30+ trading days. Re-run exit analysis on only those trades. Compare against baseline:
- Exit efficiency improved?
- PnL gap narrowed?
- Problem segments performing better?
- MFE duration alignment improved?
If yes, refine further. If not, the data tells you exactly where the rules need adjustment.
What NOT to Do
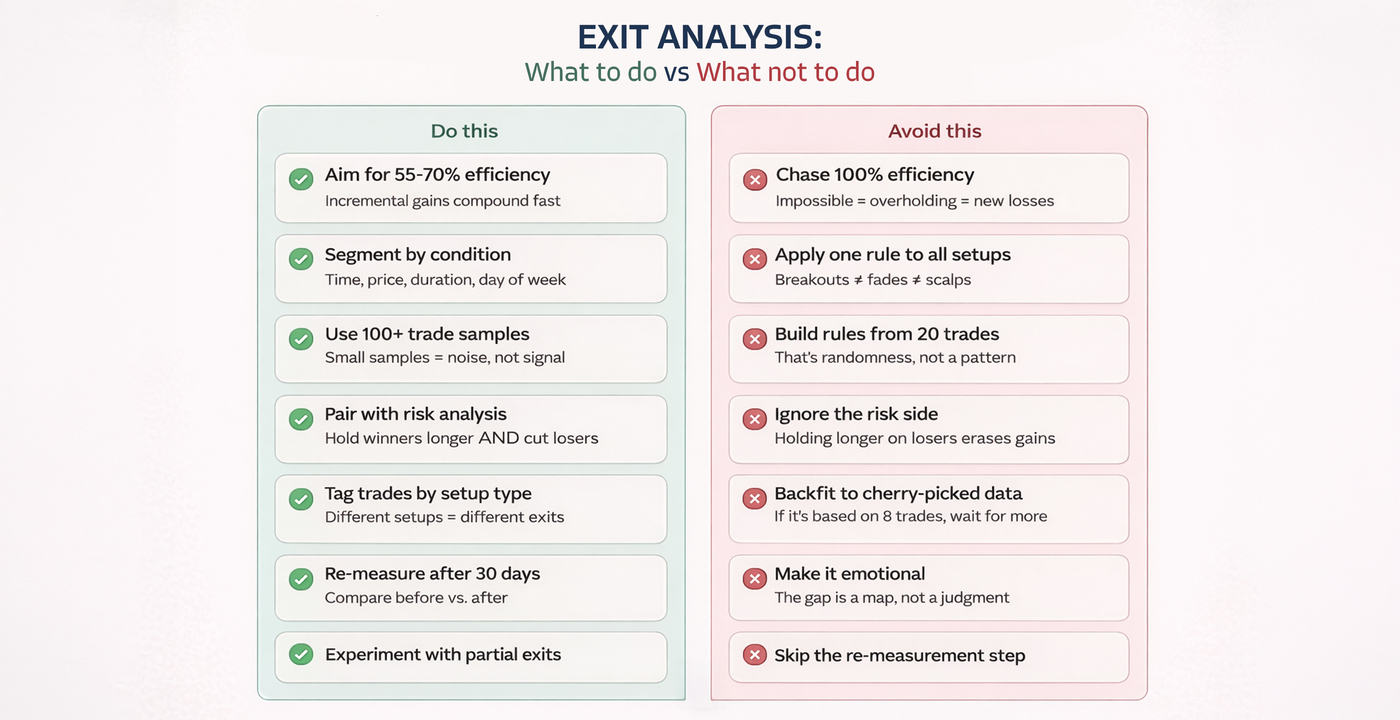
100% means you timed the exact top/bottom on every trade. Impossible. Aiming for it will make you hold too long and create new losses. If you're at 40%, aim for 55%. If you're at 55%, aim for 65%. Incremental improvement compounds over hundreds of trades.
Don't build rules from small samples
20 trades is noise, not signal. Need 50-100+ trades per segment before drawing conclusions. If best exit data shows an edge in one price range but it's based on 8 trades, don't build a rule. Collect more data.
Don't ignore the risk side
Holding winners longer is only half the equation. If your "hold longer" rule also increases average losers by a similar amount, you've gained nothing. Always pair exit optimization with running PnL and risk analysis. Hold winners longer AND cut losers at the same speed or faster.
Don't apply one rule to all setups
A breakout trade and a mean-reversion trade have completely different exit profiles. Use tags to segment by setup type. You might find breakout trades benefit from EOD holds while fades need tight targets.
Don't make it emotional
First time you see your best exit analysis and realize you've left $15,000 on the table over a year? Yeah, that stings. Don't let it. That gap is a map, not a judgment. Every dollar in that gap is recoverable going forward. That's the entire point.
Don't let "analysis paralysis" from indicators replace data from your own trades
This is worth repeating: the best indicator for your exit timing is your own exit data. Not RSI, not MACD, not Bollinger Bands. Your journal has more information about your optimal exit behavior than any indicator ever will.
What to Experiment With
Experiment 1: The "Hold 15 More Minutes" Test
Next 20 trades: hold every winning position 15 min longer. Don't move your stop. Just delay the exit. Track results separately. This works because the #1 exit mistake is closing winners too early.
Experiment 2: One Week of Time-Based Exits
Pick a timeframe from your multi-timeframe analysis. Say the data shows 1-hour exits outperform. Spend one week using strict 1-hour exits on every trade. Timer goes off, you close. No exceptions. Eliminates all emotional decisions and gives you clean data.
Experiment 3: The 50/50 Split
Half off at your original target. Other half runs with a trailing stop to EOD. Do this for 30 trades. Compare against what full exits would have produced.
Experiment 4: Time-Stop Implementation
If your MFE duration data shows setups peak within 20 min, try closing any trade that hasn't moved meaningfully within 25 min. This is an institutional technique that prevents capital from sitting in dead trades.
Experiment 5: Day-of-Week Variation
Your exit data almost certainly shows different performance by day. Try different rules for different days - tighter targets Monday/Friday, wider targets Tuesday-Thursday. Two rules, not twenty.
Putting It All Together
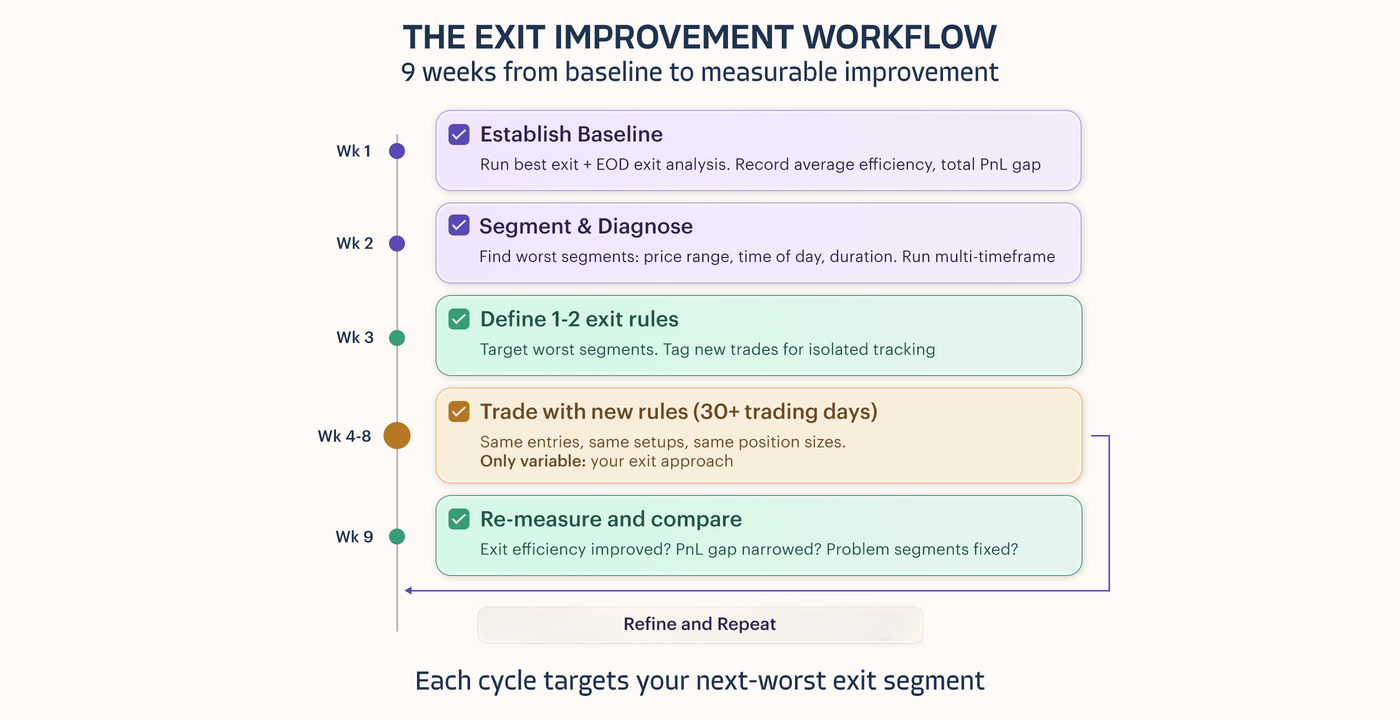
Week 1: Import trades into TradesViz. Run best exit + EOD exit analysis. Record baseline: avg exit efficiency, total PnL gap, best exit time distribution, MFE duration.
Week 2: Segment the data. Worst price ranges? Worst time of day? Worst durations? Run multi-timeframe analysis to find optimal hold duration. Check MFE/MAE duration for time-stop opportunities.
Week 3: Define 1-2 exit rules targeting worst segments. Tag new trades using tag groups so you can isolate results.
Weeks 4-8: Trade with new rules. Same entries, same setups, same sizing. Only variable is exits.
Week 9: Re-run analysis on only weeks 4-8 trades. Compare. Iterate.
Ongoing: Each cycle targets your next-worst segment. Traders who compound small exit improvements over months end up with dramatically different equity curves.
The Bottom Line
The trading education industry has failed you on exits. The influencers give you platitudes. The other journals give you a calendar and call it analysis. Nobody - and we mean nobody has built what we've built for exit analysis.
We have four types of exit simulation (best exit, EOD exit, multi-timeframe with first/last execution, and MFE/MAE duration tracking), all sliceable by every dimension that matters, all explorable down to the individual trade, and all available in your custom dashboard.
"Let your winners run" isn't a strategy. It's a bumper sticker. A strategy is knowing from your own data exactly how long to hold, when to scale out, and when the statistical window for your setup has expired.
Finally, you may have understood that exit analysis is really just the concepts of emotions and trading psychology in numbers. Think about it.
In fact, a lot of more-than-surface-level data is just mapping of psychology to statistics. We introduced trade plans to bridge this gap in a more generic way, but even without taking all of that effort, your TradesViz journal can show you so much about your trading persona.
Start measuring your exits. The data is already in your trades, and TradesViz shows you the most important parts of it...
Deep Dives: Exit Analysis on TradesViz
- Best Exit Analysis — Risk-constrained optimal exit simulation
- EOD Exit Analysis — Hold-till-close benchmark
- Multi-Timeframe Exit PnL — Fixed-interval exit simulation with first/last execution
- Multi-Timeframe Exit Visualization — All simulations compared in one view
- MFE/MAE Duration Analysis — Time-to-peak tracking for time-stops
- Running PnL & Risk Analysis — MAE, MFE, and when to cut losers
- MFE/MAE Charts — Scatter plot analysis of trade excursions
- Targets Simulator — Backtest exit rules against history
Related Reading
- R-Value and Profit Factor — Measure your edge in risk units
- Trading Psychology Tracking — Quantify the cost of emotions
- Candlestick Backtesting — Data-driven pattern analysis
- Tags Complete Guide — Segment trades for isolated analysis
- Advanced Stats — Full metrics reference