Here's something for your weekend research.
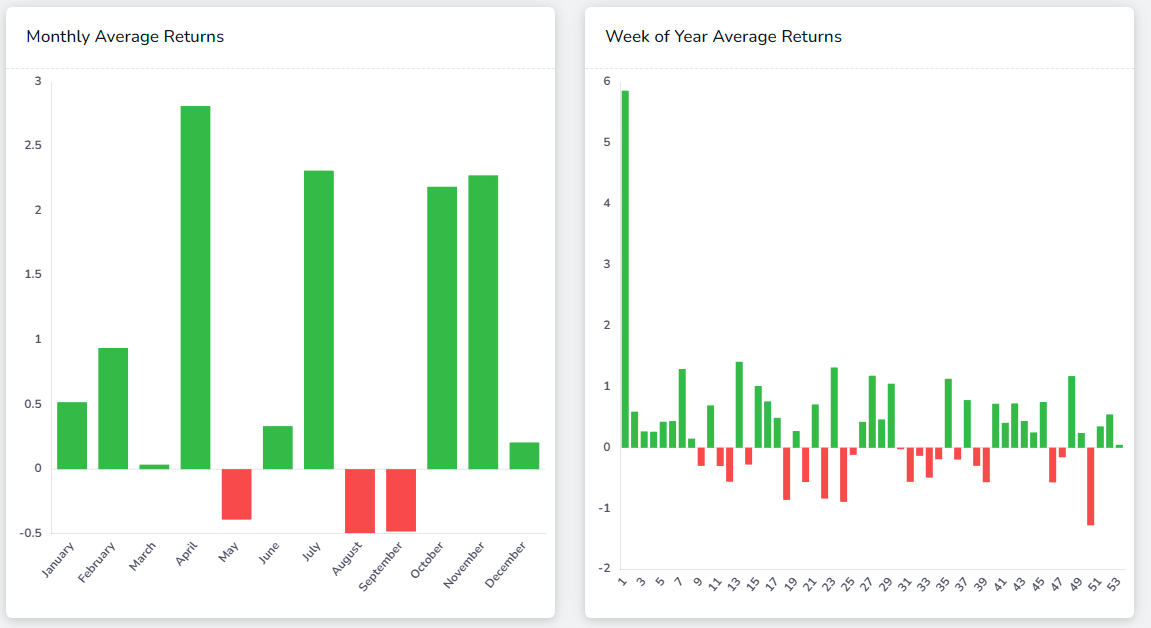
$SPY seasonality for the last 10 years.
Available from your https://t.co/gnY7J21ec6 dashboard (click long the wind icon on the top right corner).
Use this as *one* of the data points when deciding what/how to trade going forward.
As a user of any *service*, you should always know about how the service is improving.
At TradesViz, we regularly publish changelogs about new features to keep our users updated above all the latest updates.
Here's the latest:
We built https://t.co/2blWUcCMIh from the ground up to be an all-in-one platform where you have everything related to trades analysis. 🔬
Our charting + journaling system is still the best compared to any platform. 🏆
All it takes is 5 mins - give it a try! 👍
Focus on the TRUTH that is your DATA. 📚
Your journal filled with your trades, tags, notes, charts is the best book *YOU* can ever read. 🔖
It has all the solutions to your mistakes, the best paths you can take, and more. 🛣️
All you have to do is take a look.
#tradingjournal
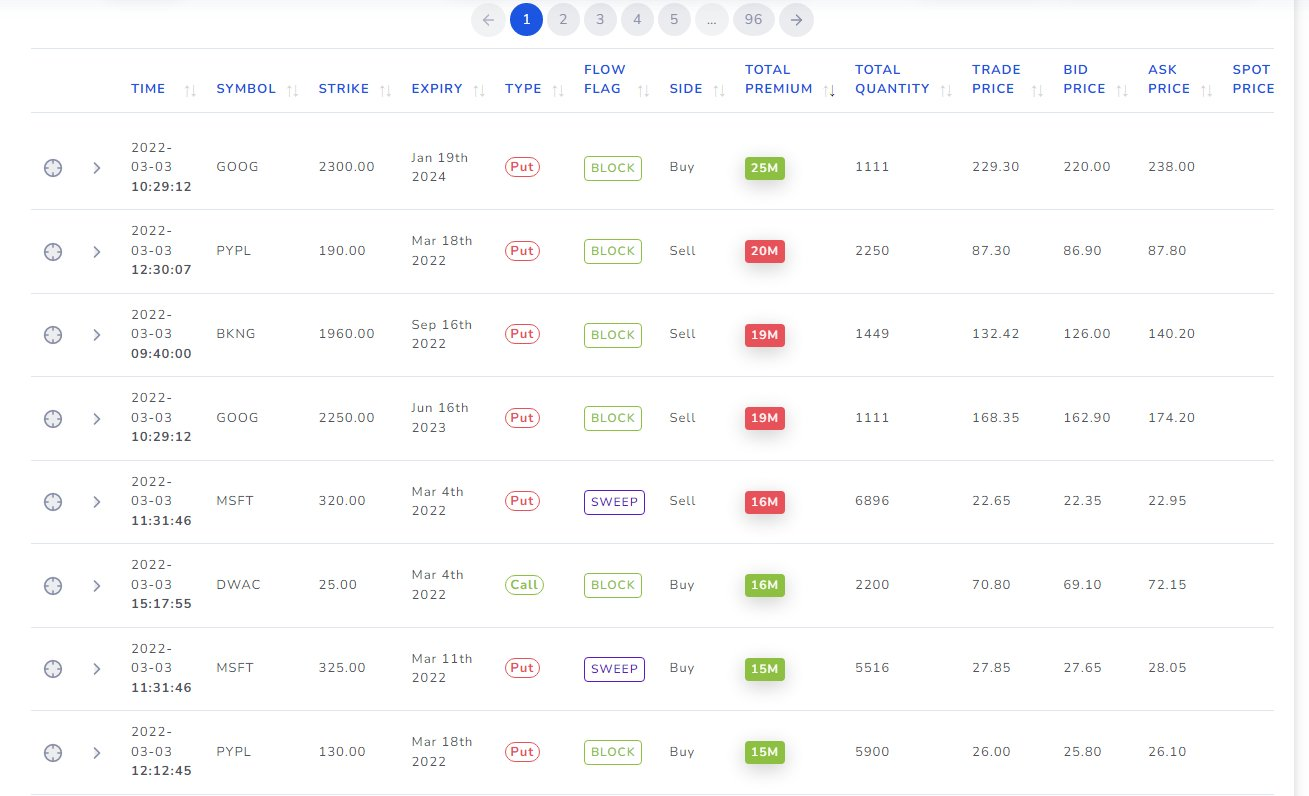
Top top from last trading session:
$GOOG
$PYPL
$BKNG
$MSFT
$DWAC
Top Flow difference: Auto, Agriculture, Semiconductors
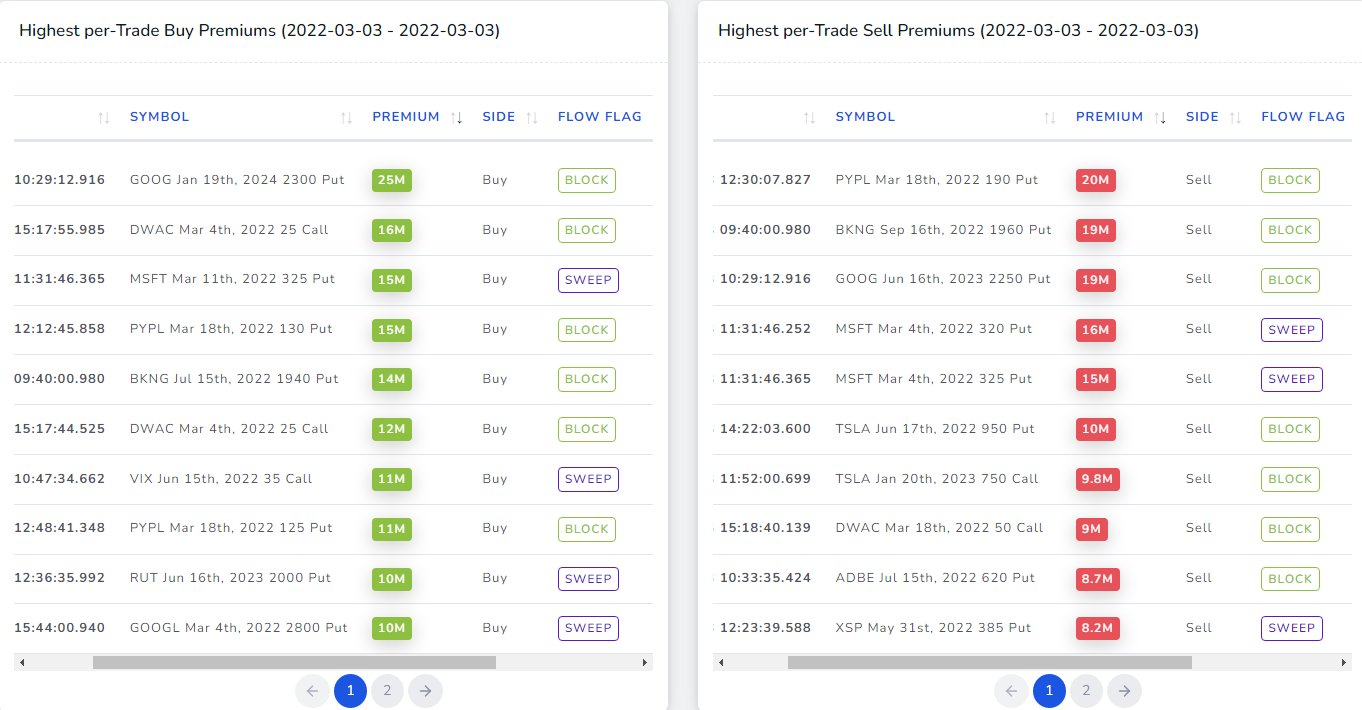
Highest per-trade premium
* in-flow: $GOOG
* out-flow: $PYPL
Discover more trends that help you to trade everyday ➡️https://t.co/7SjhzNX4AU
Here is more analysis of the $SPY options flow:
* Options flow (bullish/bearish)
* biggest flow difference in contracts
* 410 strike 3/18 expiry trend
* 15 strike/expiry heatmap - notice the trend change
Integrate options flow into your journal ▶️
https://t.co/7SjhzNEVmM
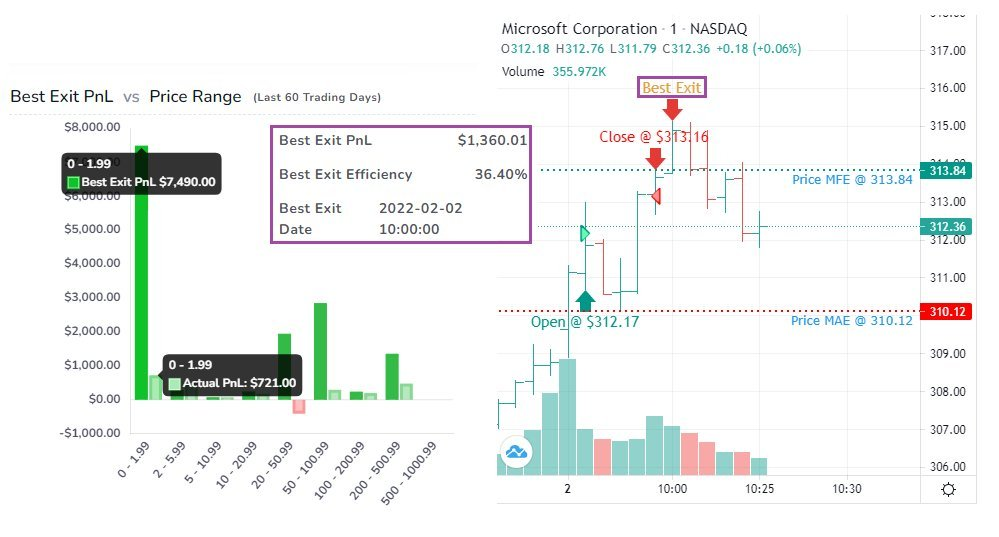
Ever wonder how much money you could have made if you stayed in that trade for a little longer?
Here is the answer 👉https://t.co/kHVVkqz1Os
Now you can make changes to your strategy in a data-driven way with https://t.co/gnY7J1JDky
#tradingjournal
Some interesting $TSLA trends for you to analyze 👀
* Notice the spread leg 1150/1725 strikes - 90 mil 😱
* Notice the gradual drop before the purchase
* Notice the heatmap last 10 days to find strike correlations
Analyze before your trade.
▶️ https://t.co/7SjhzNX4AU
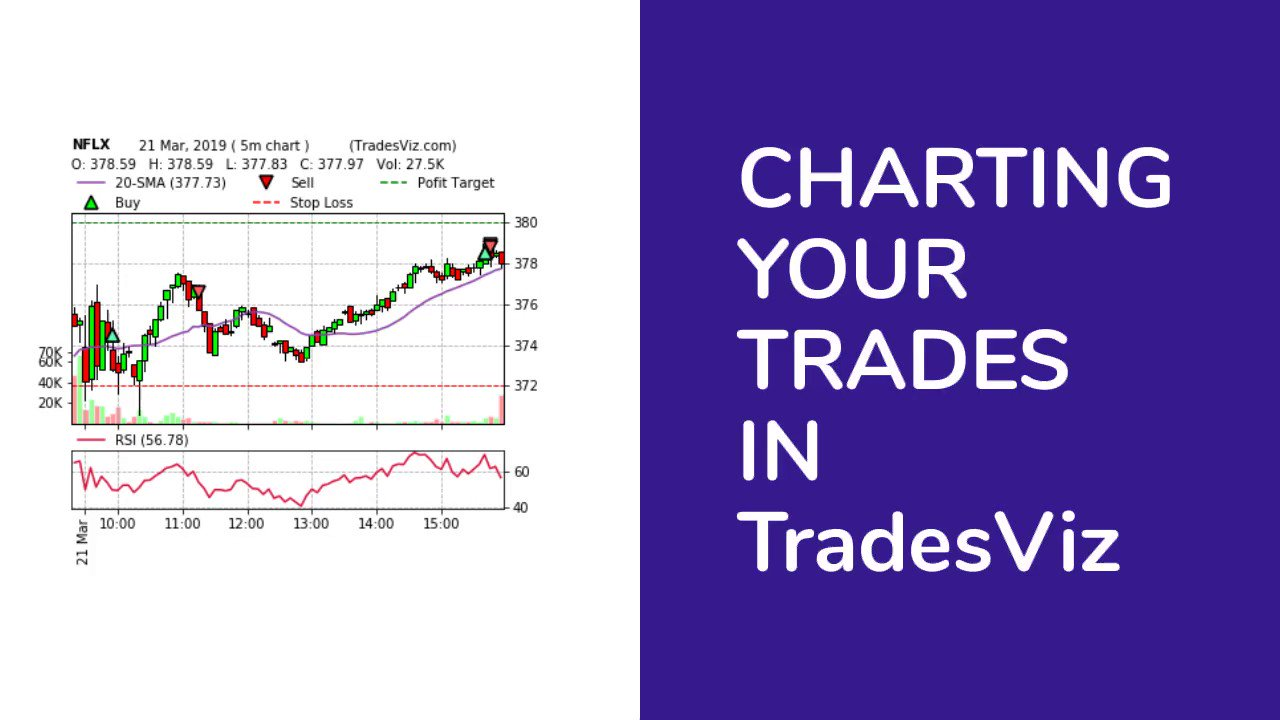
A good technical analysis plot can help you easily recall the decisions you made when you made each execution.
https://t.co/xz5WeV5Rrq has the most comprehensive trade execution-based charting among ANY journal.
Sign up for free and try it out!
#tradingjournal #MSFT
The market always provides ample data you can use to correlate with your performance.
The question is - how?
At TradesViz, we try to make these complex analyses as easy and understandable as possible.
Explore a chart and see for yourself: https://t.co/gnY7J1JDky