blog-post-image
By TradesViz On in Introduction

Multi chart trading simulator: Trade any symbols in multiple timeframes in a single screen

A first in ANY trading journal/simulation platform online: multi-chart, multi-timeframe trading simulator dashboard. Trade multiple symbols on multiple timeframes - all synced in the same page!


blog-post-image
By TradesViz On in Introduction

Pivot Grid + Charting: Visualize and analyze ANY statistic and metric on TradesViz

The next big thing on TradesViz journal: An all-in-one grid + pivot table where any column or data can be visualized and explored intuitively. Potential combinations of metrics: 400+ This is by far the most powerful singular trading performance analytics feature available online. Try it out!


blog-post-image
By TradesViz On in Changelog

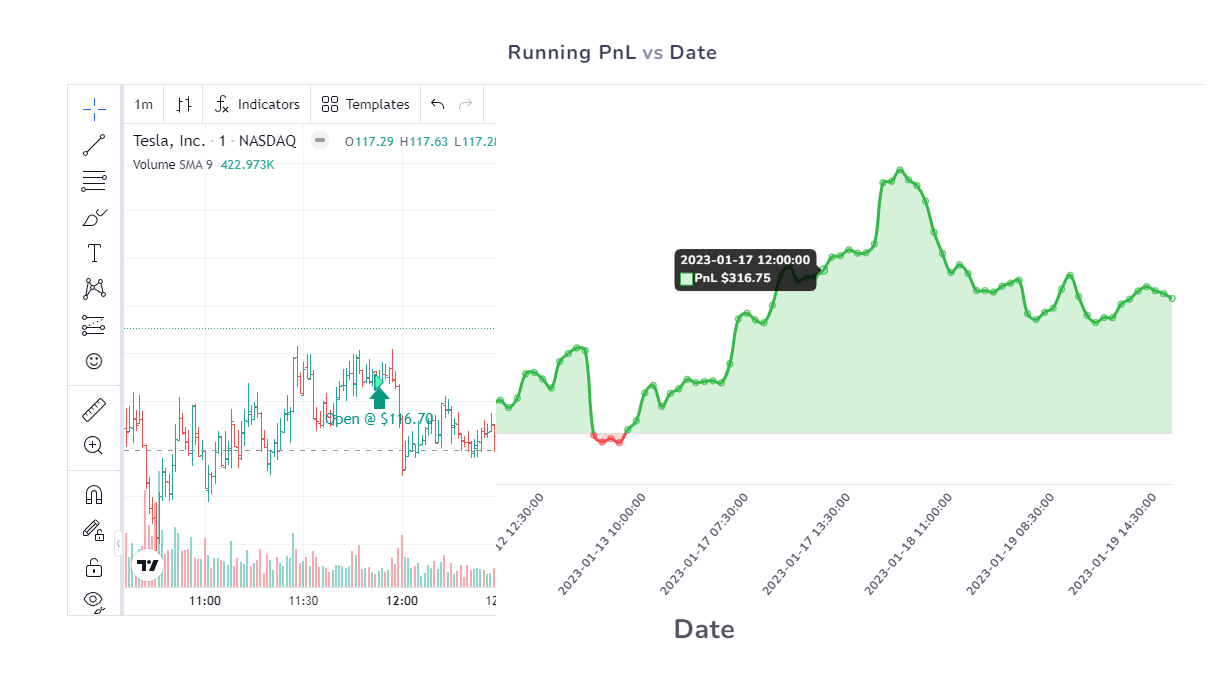
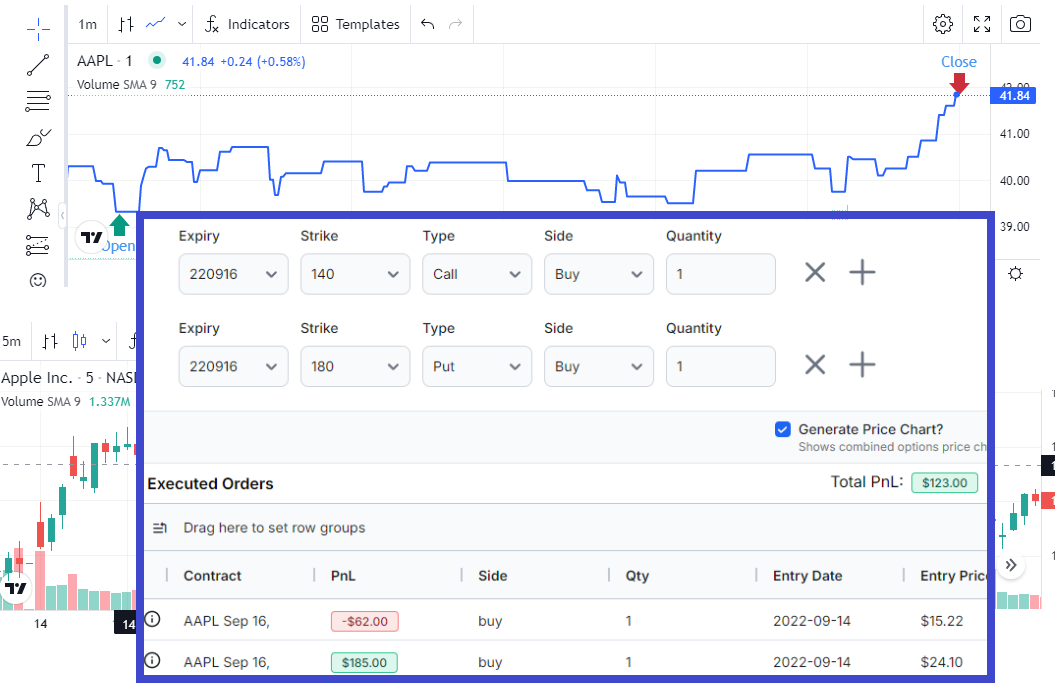
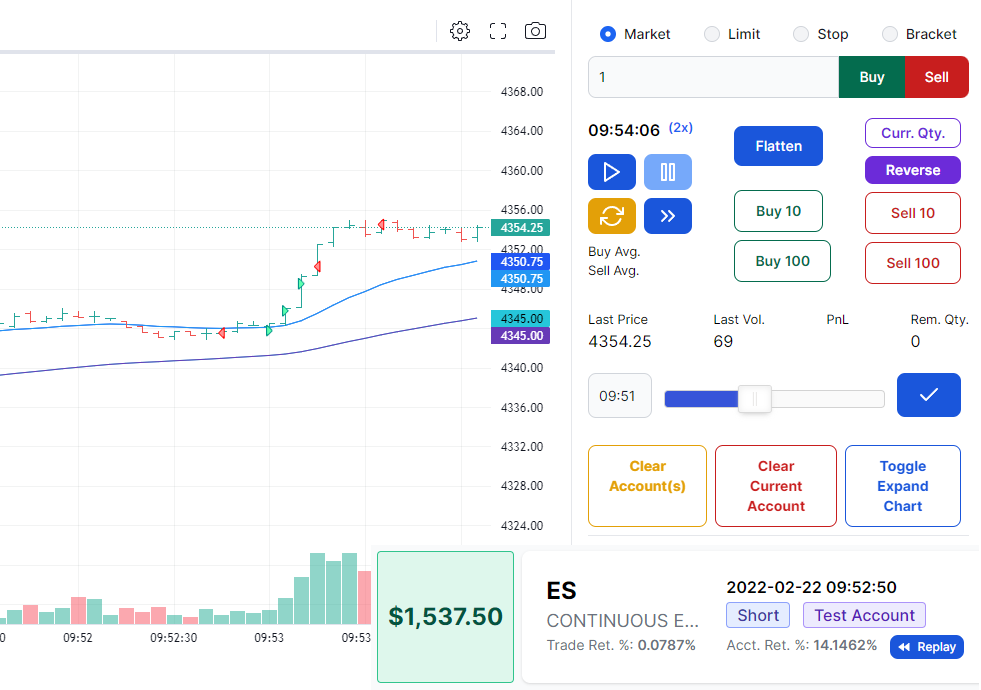
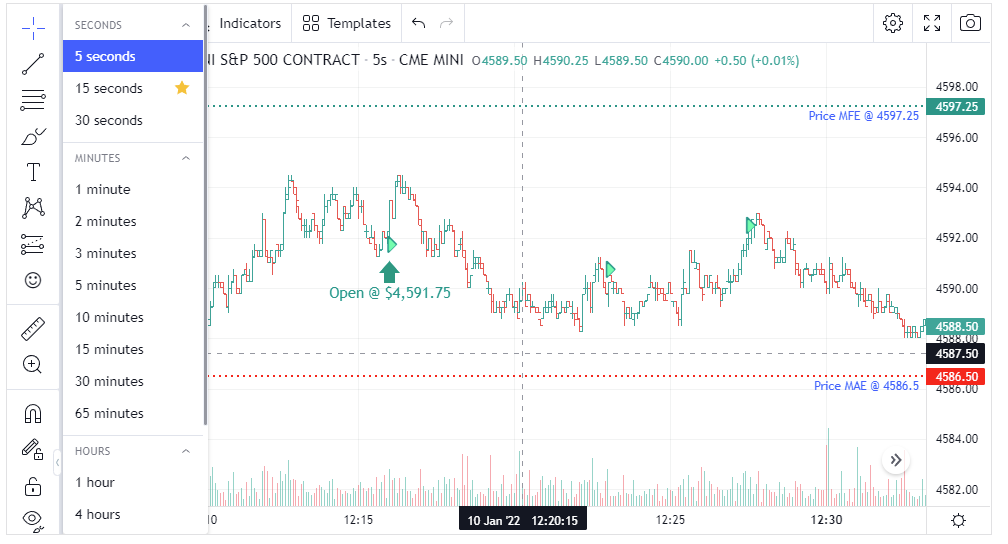
Sep 2022 to Jan 2023 Updates: Simulator, Options spread PnL, EOD Exit + more feaures!

A LONG list of new features to TradesViz - a lot of it, being the first time ever on any online trading journal. This is a must-read change log - showing how much we are committed to improving TradesViz every single day!


blog-post-image
By TradesViz On in Visualizations

New feature: Unrealized Running PnL Charts

View full running pnl including unrealized till the current date for your trades - available as a chart in Trade explore view!


blog-post-image
By TradesViz On in Introduction

New: Options spreads execution Simulator/Backtester

What if you had taken that spread during that day? What would have been the outcome? How do options prices/strategies move based on the underlying? Have you ever visualized a summed-up chart of your entire options spread? This feature will answer all the above questions and more + help you in understanding the options/underlying pricing correlation.