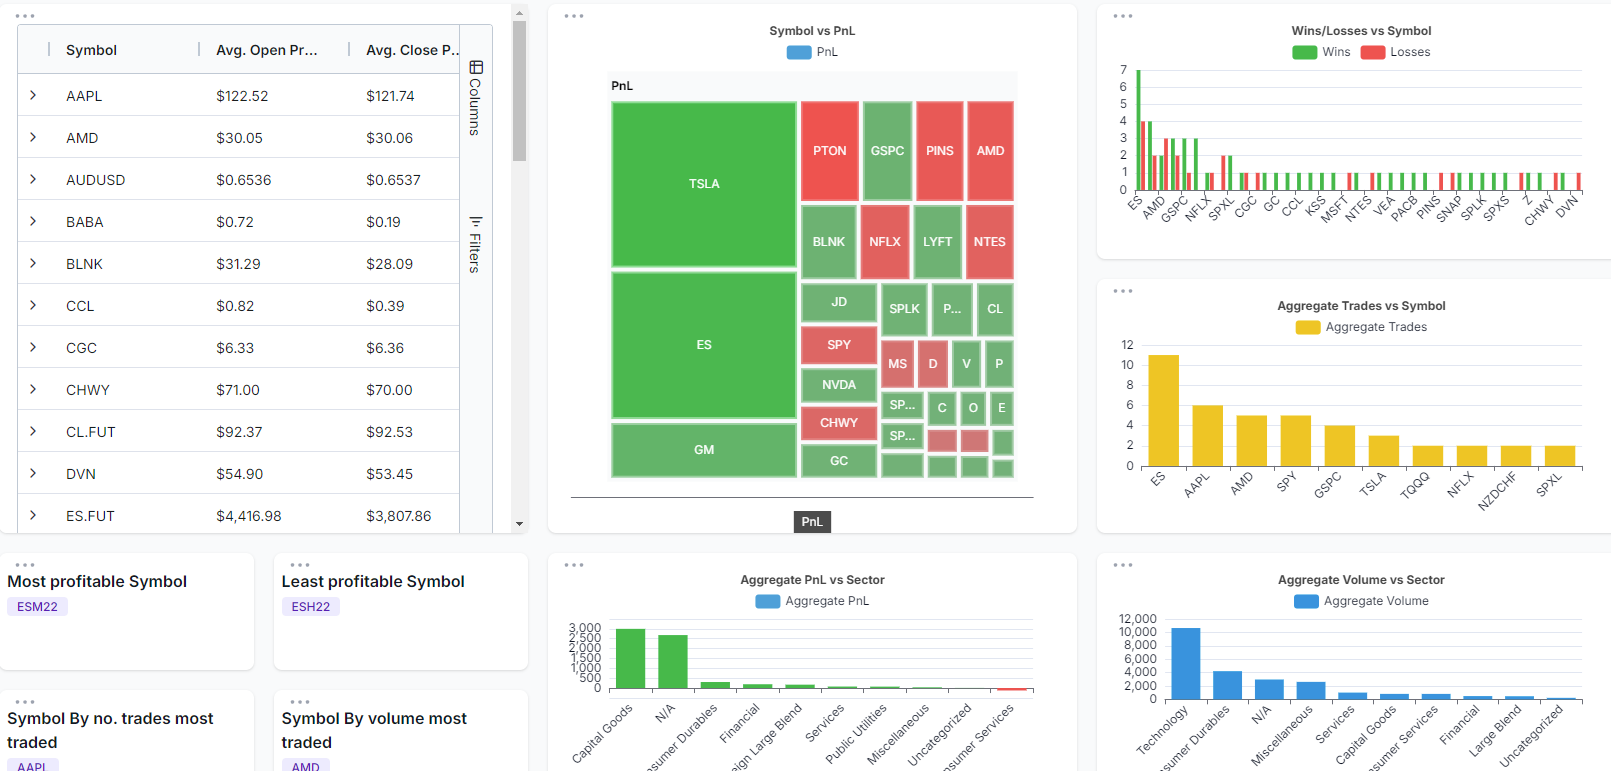
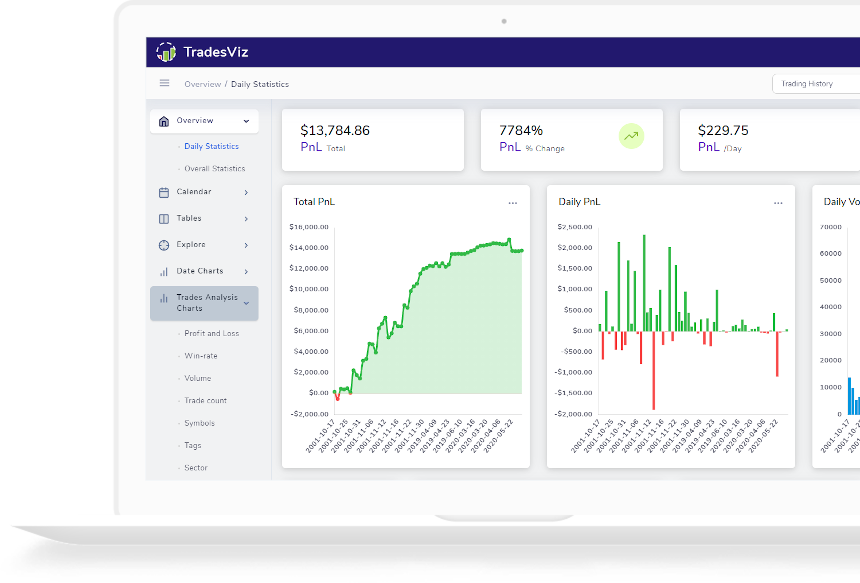
How to create a custom dashboard in TradesViz
Learn how to create a custom dashboard with any charts and statistics you want! We really mean it when we say TradesViz is THE MOST FLEXIBLE trading journal available!
Guides, changelogs, deep dives and everything trade journaling.
Learn how to create a custom dashboard with any charts and statistics you want! We really mean it when we say TradesViz is THE MOST FLEXIBLE trading journal available!
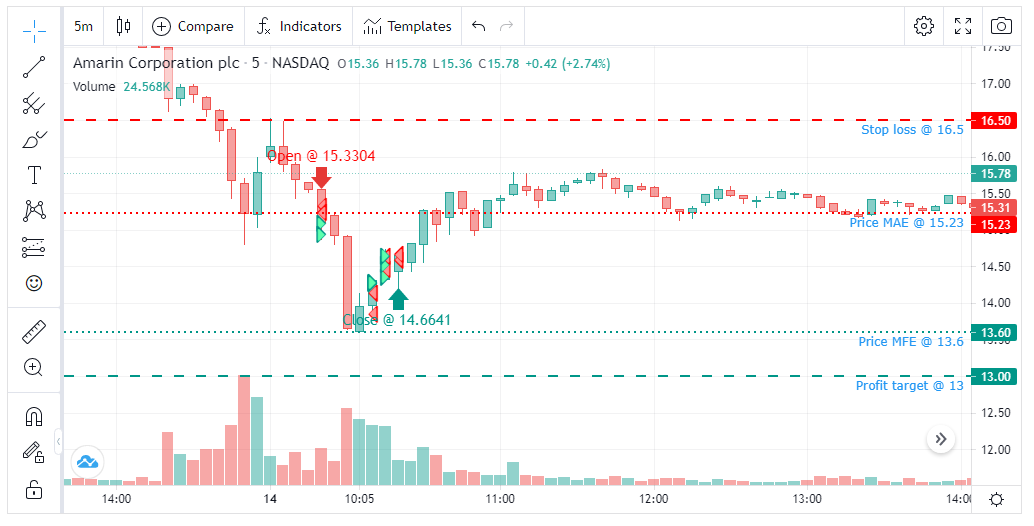
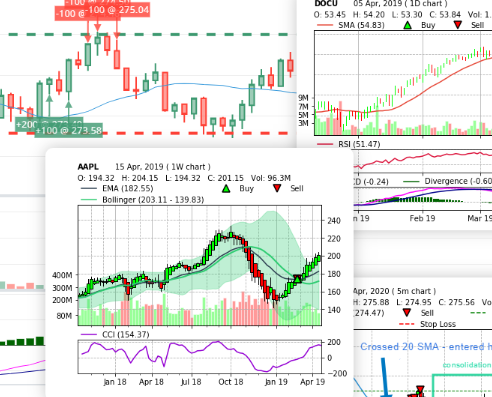
TradingView charts are now available for ALL your trades! 70+ Indicators, draw your technical analysis and save them on any chart, load and save custom indicator templates to use on any chart! Static charts, Custom interactive chats, and now we have the popular TradingView charts for your trades!
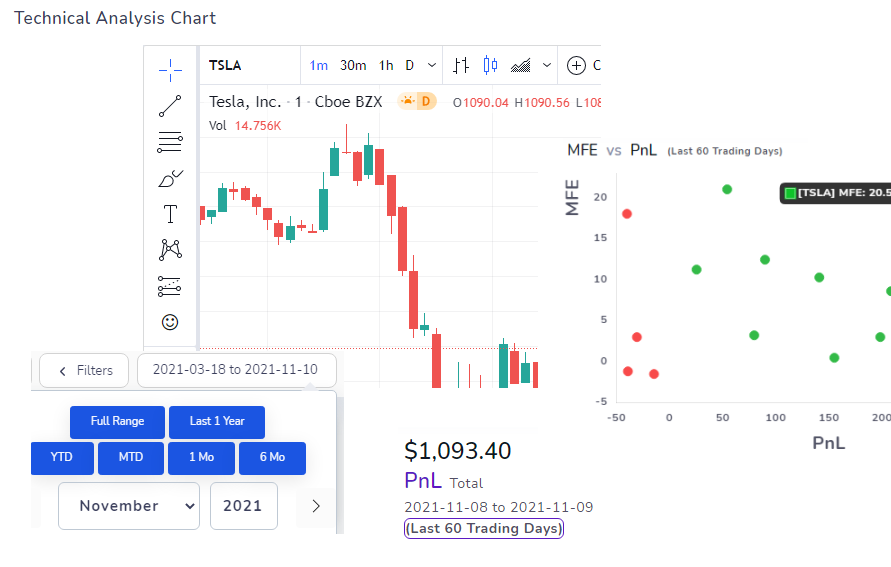
As we are continually improving our platform, over the last few months, we have focused on charts, analysis, and visualizations along with making our interface a bit easier to use and navigate.
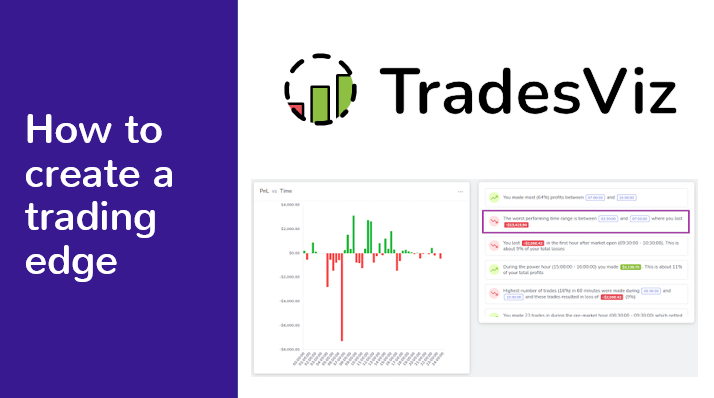
In collaboration with ChartLearning, we created a detailed post on how you can best utilize TradesViz tools to find your own trading edge. Learn with real examples on how to use the interactive charts and auto-insights from TradesViz to improve your trading expectancy.
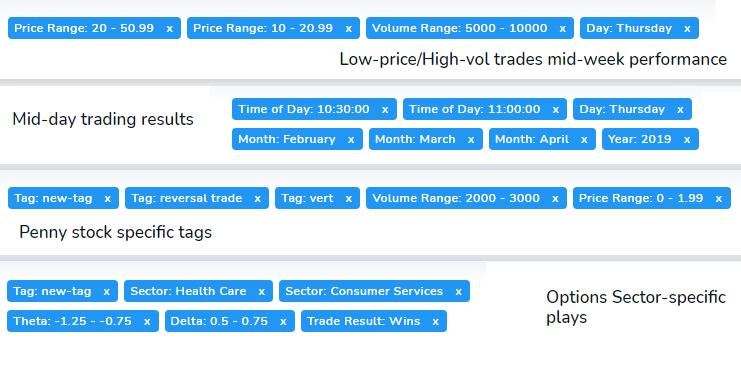
Build a trade report using conditions ranging from price, volume, ATR, win/loss, etc., and save it to access and view statistics of trades filtered by those conditions any time!
How has trade journaling changed in the last year? How has TradesViz helped traders achieve what was not possible before? Read to learn more!
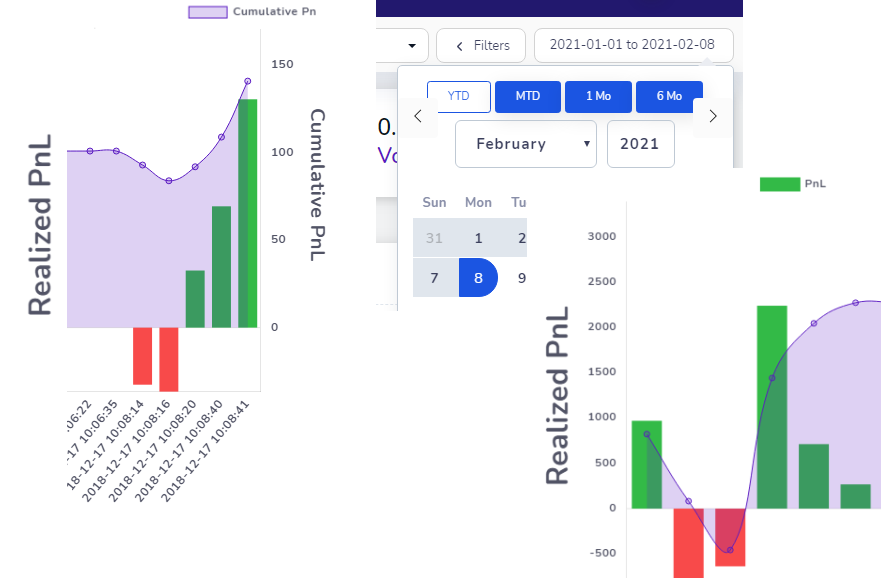
What to know how you performed in-between every trade in a trading day or in-between every execution in a trade? Take a look at the all-new continuous pnl charts - now available in all trade and day explore charts!
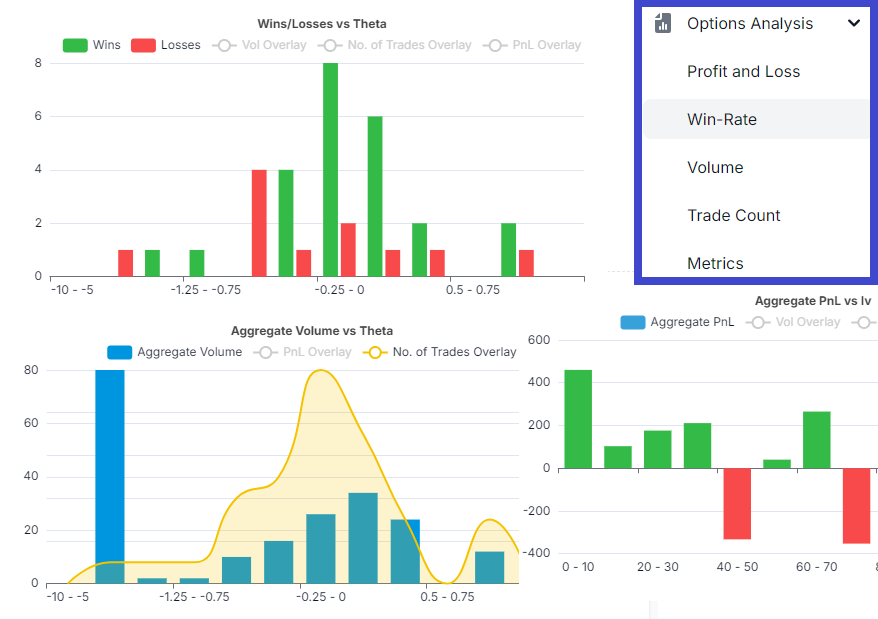
Not only can you analyze your stock trades in-depth with TradesViz, but you can now also analyze all your options trades with their greeks! Learn more about how to use these chart features and how they can benefit your options trading!
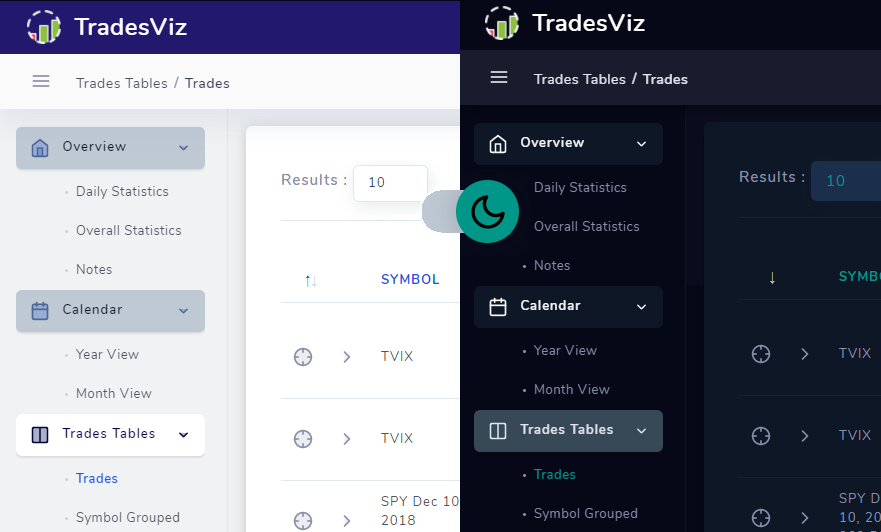
You can now switch between light and dark mode with a single click in your dashboard itself!
Learn how to set global default chart settings so that multiple charts according to your specifications are automatically generated for every trade imported from your broker's export files.
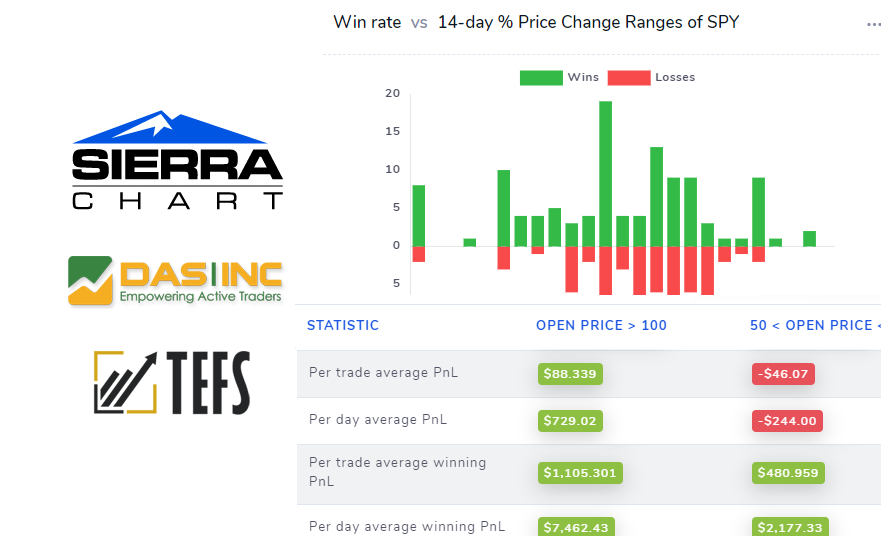
Details about changes and updates to TradesViz made this month! Changes include added support for more trading platform formats, new indicators to plot with, table to compare statistics of different trade groups.
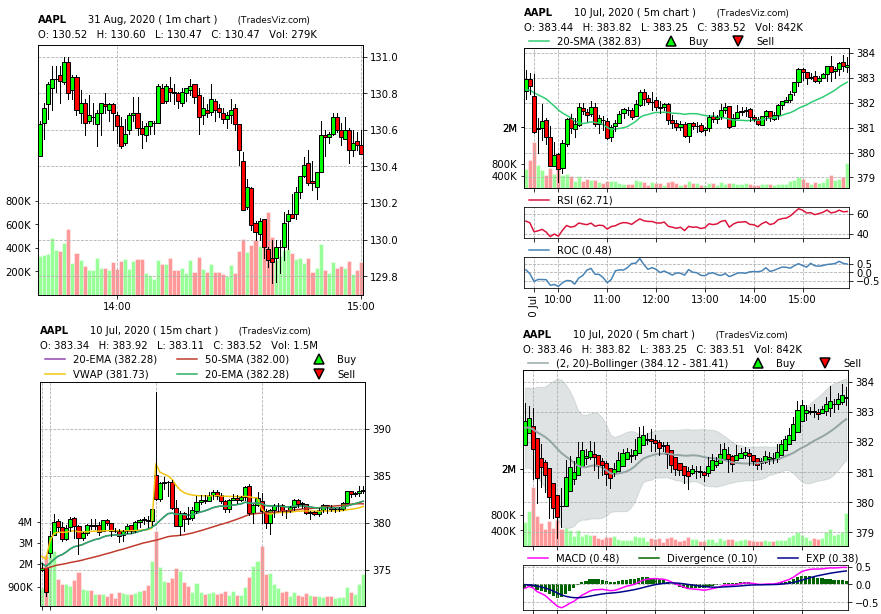
The most feature-filled symbol chart generator on an online trade logging platform out there! Learn how to add indicators, modify indicator parameters, draw on charts, even copy charts, and play around with a FULLY interactive bar-chart with indicators plotted!