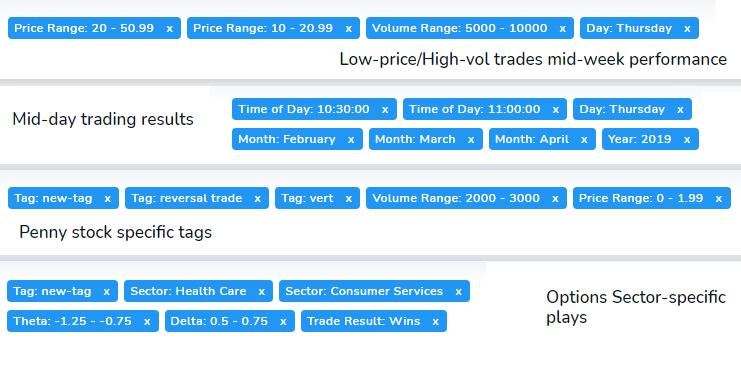
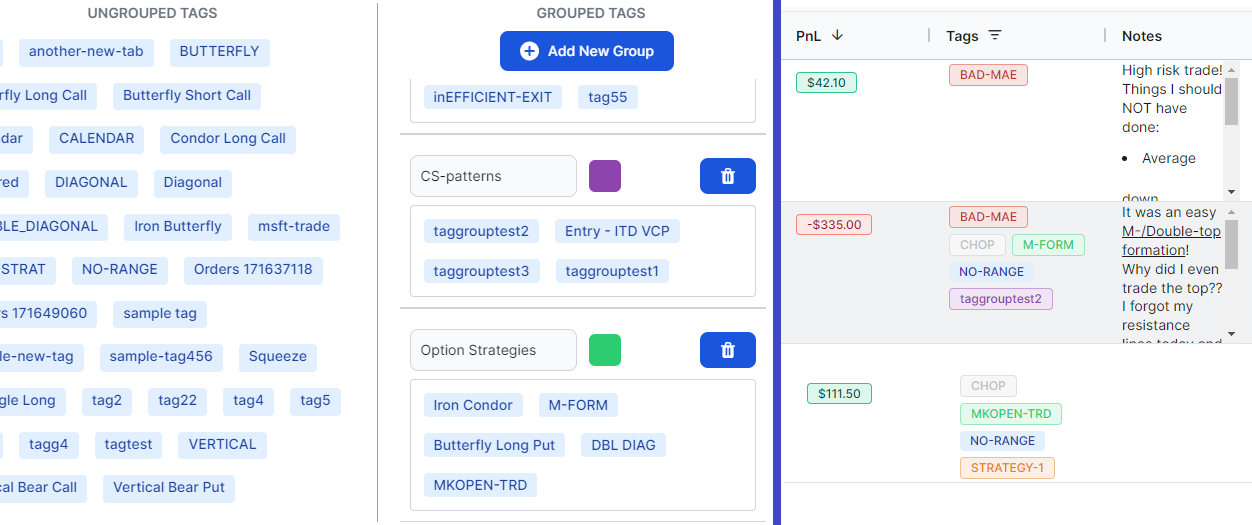
blog-post-image
By TradesViz On in Introduction

New feature: Dashboard Points/Ticks toggle (Switch all charts from PnL to Points/Ticks)

View your PnL in points and ticks across most charts in your dashboard!


blog-post-image
By TradesViz On in Visualizations

New: EOD Exit Analysis Charts

We've already seen the "best" exit, but what happens if you just held your positions till EOD? These charts help answer the question if your strategy is really better than just buy and hold intraday.


blog-post-image
By TradesViz On in Introduction

New feature: Dashboard R-value toggle (Switch all charts from PnL to R-value)

R-value charts for your entire dashboard!


blog-post-image
By TradesViz On in Changelog

June 2022 to Sep 2022 Updates: More 100% auto-import, Charting improvements, Group tags & more!

A long-awaited changelog. It's been a few very busy months with lots of new features added with a focus on auto-sync and charting improvements!


blog-post-image
By TradesViz On in Visualizations

New Tabs: Tag groups analysis & Tag groups summary

We wouldn't just stop at tag groups. With the introduction of tag groups, the first 2 new tabs are about visualizing your tag groups statistics and finding which tags within each tag groups you should focus on.