Every serious trader knows the feeling. You're sitting at your desk, your journal is clean, your plan is set, and your charts are open. But *finding* the right trade? That's where things get messy. You've got one tab open for your screener, another for your charting platform, a third for your journal, and maybe a fourth for options flow or watchlist management. You're constantly copy-pasting tickers, losing context, and burning mental energy on logistics instead of decision-making.
That's exactly what we built.
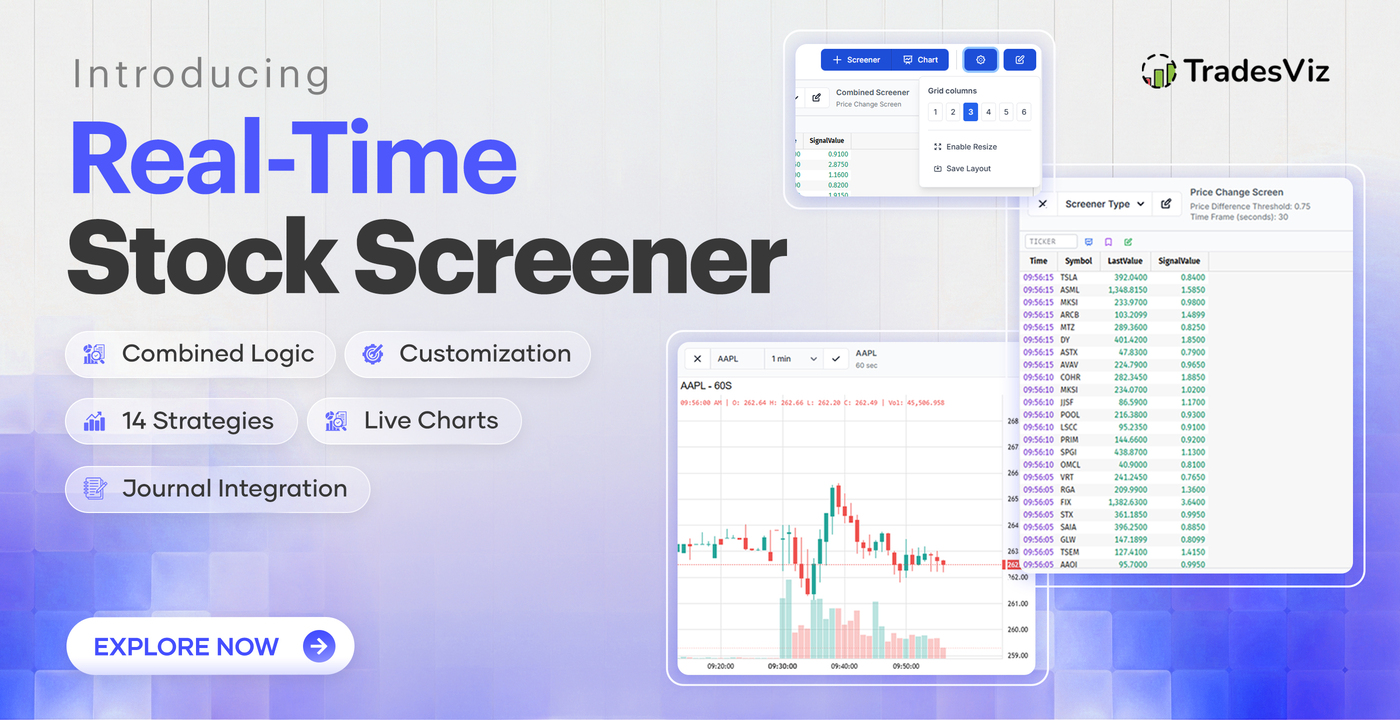
Not a static end-of-day scanner. Not a "top movers" widget pulled from a free API. A proper, real-time screener that runs during market hours, with 14 unique screening strategies, live charts, customizable layouts, and here's the part that matters - direct integration into your trading journal.
This isn't a bolt-on. This was built from the ground up to solve a real problem: the gap between finding a trade and recording it. We've been building this for the last 6 months - the data processing pipeline, infrastructure, servers, UI/UX - it's all 100% built and owned by the TradesViz team. We think it's ready for you to use and benefit from.
Apart from journaling, TradesViz has many features that have completely changed how traders handle and use market data - this includes a built-in options flow+screener, stock screener (EOD based), seasonality, SEC 13F data, and fundamentals. Now, a full-fledged, live stock screener enters the list, making TradesViz the most comprehensive trading partner for any trader.
Why Does a Trading Journal Need a Screener?
Let's address the obvious question head-on: why would a journaling platform build a screener?
The answer comes from watching how traders actually work. We've been doing this since 2019, and a pattern is clear: the traders who improve fastest are the ones who can connect their discovery process to their review process. When you find a stock, take a trade, and then later sit down to journal it, there's a disconnect. You forget why you entered. You can't remember what caught your eye. The screener alert that triggered it is buried in another application's notification history. Early on (in 2022), we caught this and introduced the real-time note-taking feature (which is still a favorite among traders), but the features we have now take all of that to another level.
Now imagine: you spot a stock making new highs on your screener. Right-click. "Save to Today's Note." The symbol, the price, the signal, the exact exchange time, and all of it drop directly into your daily journal. When you sit down to review later, the breadcrumb trail is already there.
This is what we mean when we say our features are designed to complement each other. It's the same philosophy behind our custom dashboards, AI Q&A, pivot grids, and exit analysis - every tool is stronger because it's aware of the others.
No other journal has attempted this. And honestly? Given the engineering required, we understand why :)
How to Access the Screener
You can get to the real-time screener in three ways:
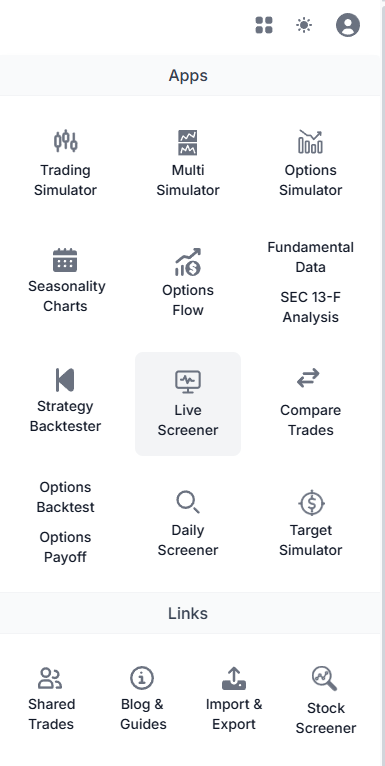
- Application Drawer: Click the grid icon in the top-right corner of your dashboard. You'll find "Live Screener" in the tools section.
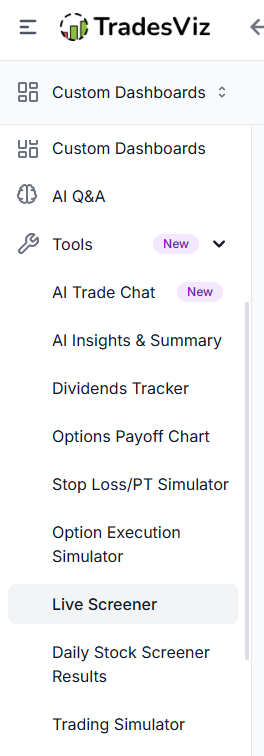
- Sidebar: Navigate to the tools section in the sidebar and click on "Live Screener".
 |
 |
The screener is available during US market hours: 8:30 AM - 5:00 PM Eastern Time, Monday through Friday (excluding market holidays). This isn't arbitrary - real-time screening requires live market data, and outside of these hours, there simply isn't a feed to screen against, so you will just see a blank screen with a notification at the bottom right corner.
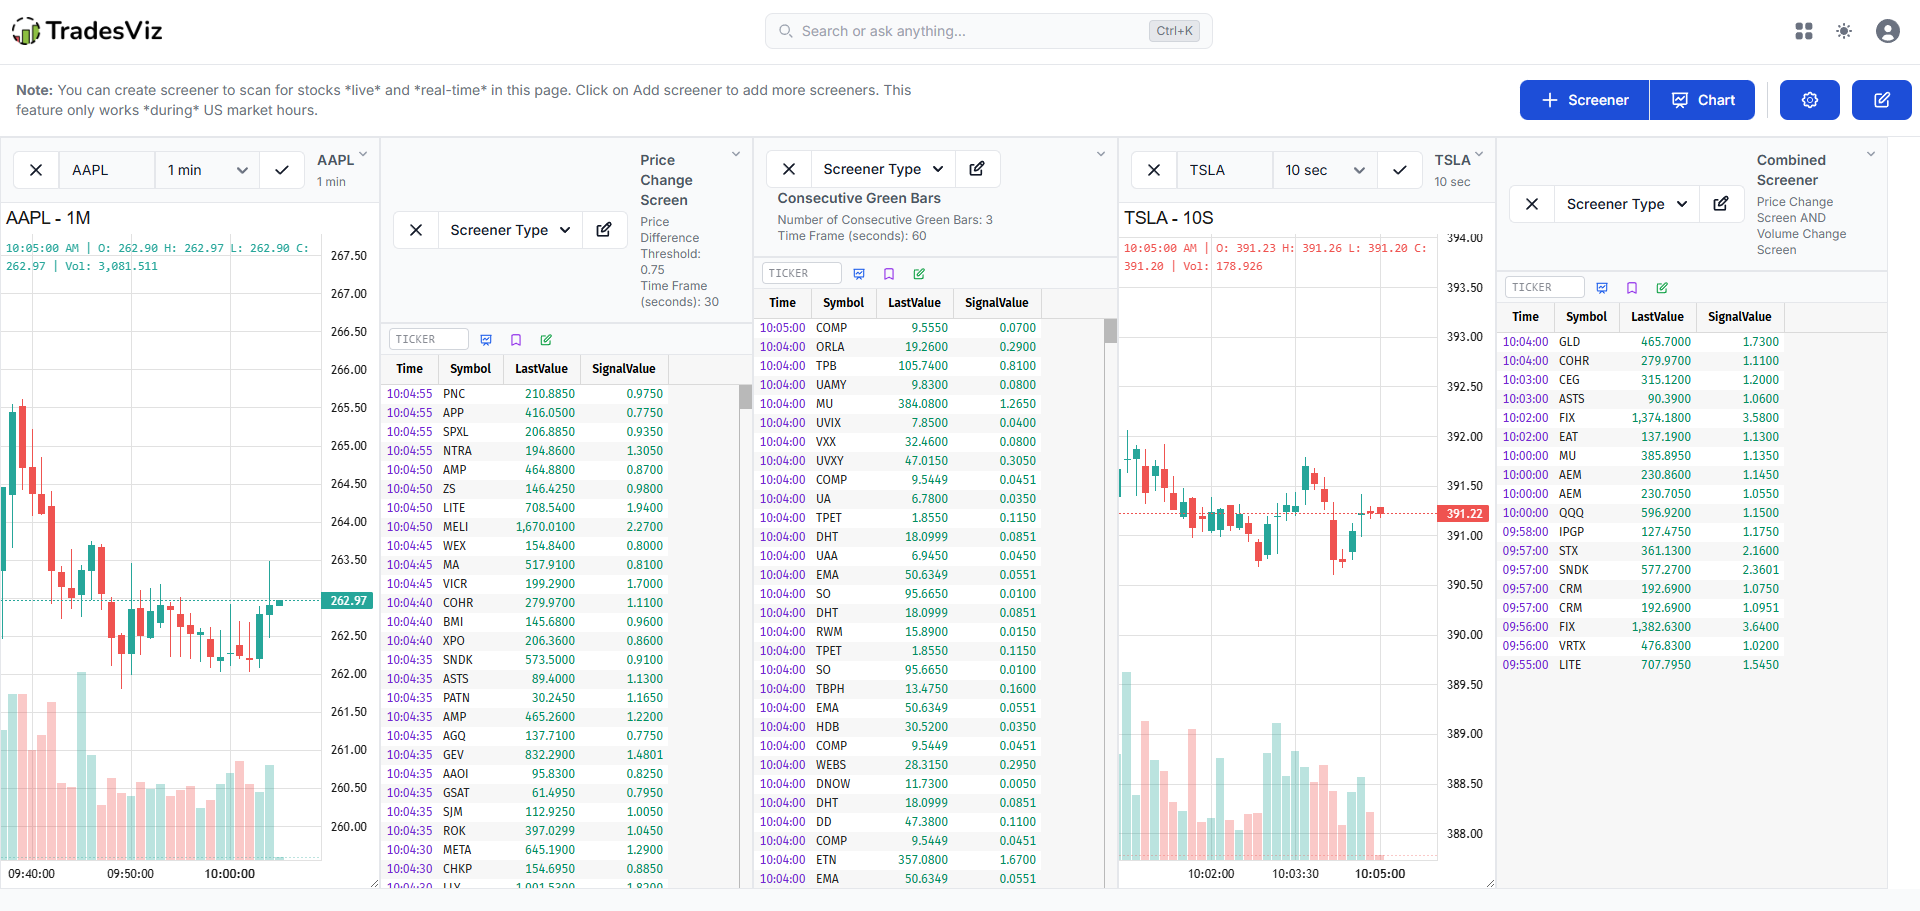
The Screener Interface: A Quick Tour
When you open the screener, you'll see a clean grid layout. The toolbar at the top gives you everything you need:
- Screener button: Adds a new screener element to your grid. Choose from 14 screening strategies.
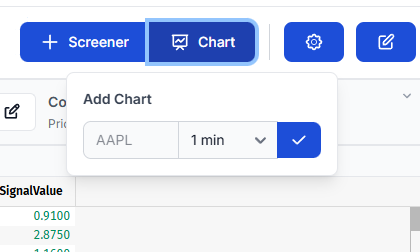
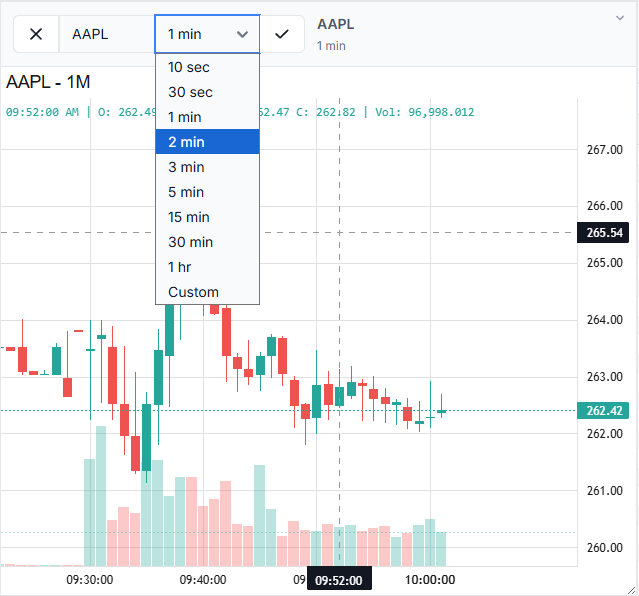
- Chart button: Adds a live chart to your grid. Enter a ticker, pick a timeframe, and it appears alongside your screeners.
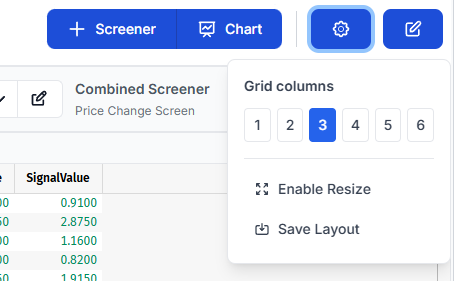
- Settings button: Configure grid columns (1-6), toggle resize mode for custom element widths, and save your layout.
- Save Snapshot button: Captures your entire screener dashboard state and writes it straight to today's journal (day explore tab).
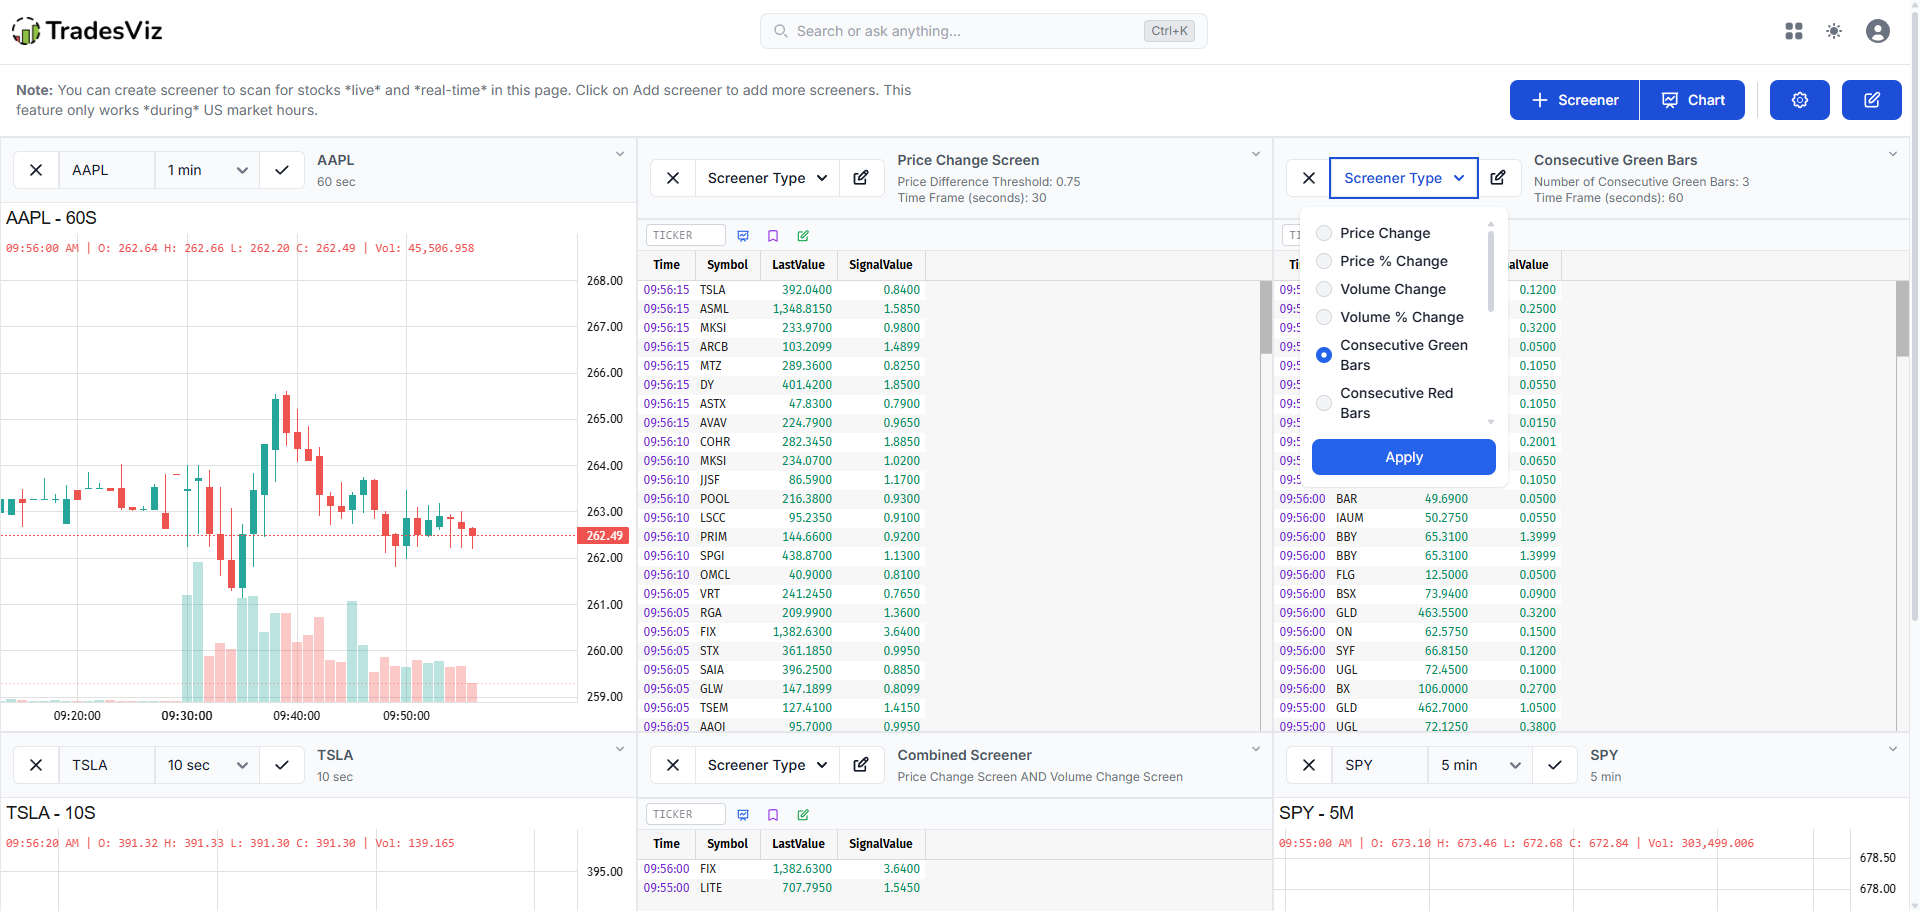
The grid supports max of 6 columns. Each element can be a screener or a chart and can be resized independently when resize mode is on. And here's the key part: your layout can be saved by clicking onthe gear icon and selecting "Save Layout". Close the browser, come back tomorrow, and everything is exactly where you left it. Same screeners, same charts, same column widths.
14 Screening Strategies: How to Use Them
This is where the screener gets serious. We didn't build a single generic scanner and call it a day. There are 14 distinct screening strategies, each designed for a specific type of market condition or trading style. Every screener supports configurable filters for minimum/maximum price and minimum volume, so you can always filter out penny stocks, illiquid names, or mega-caps that don't suit your strategy.
Let's walk through each one.
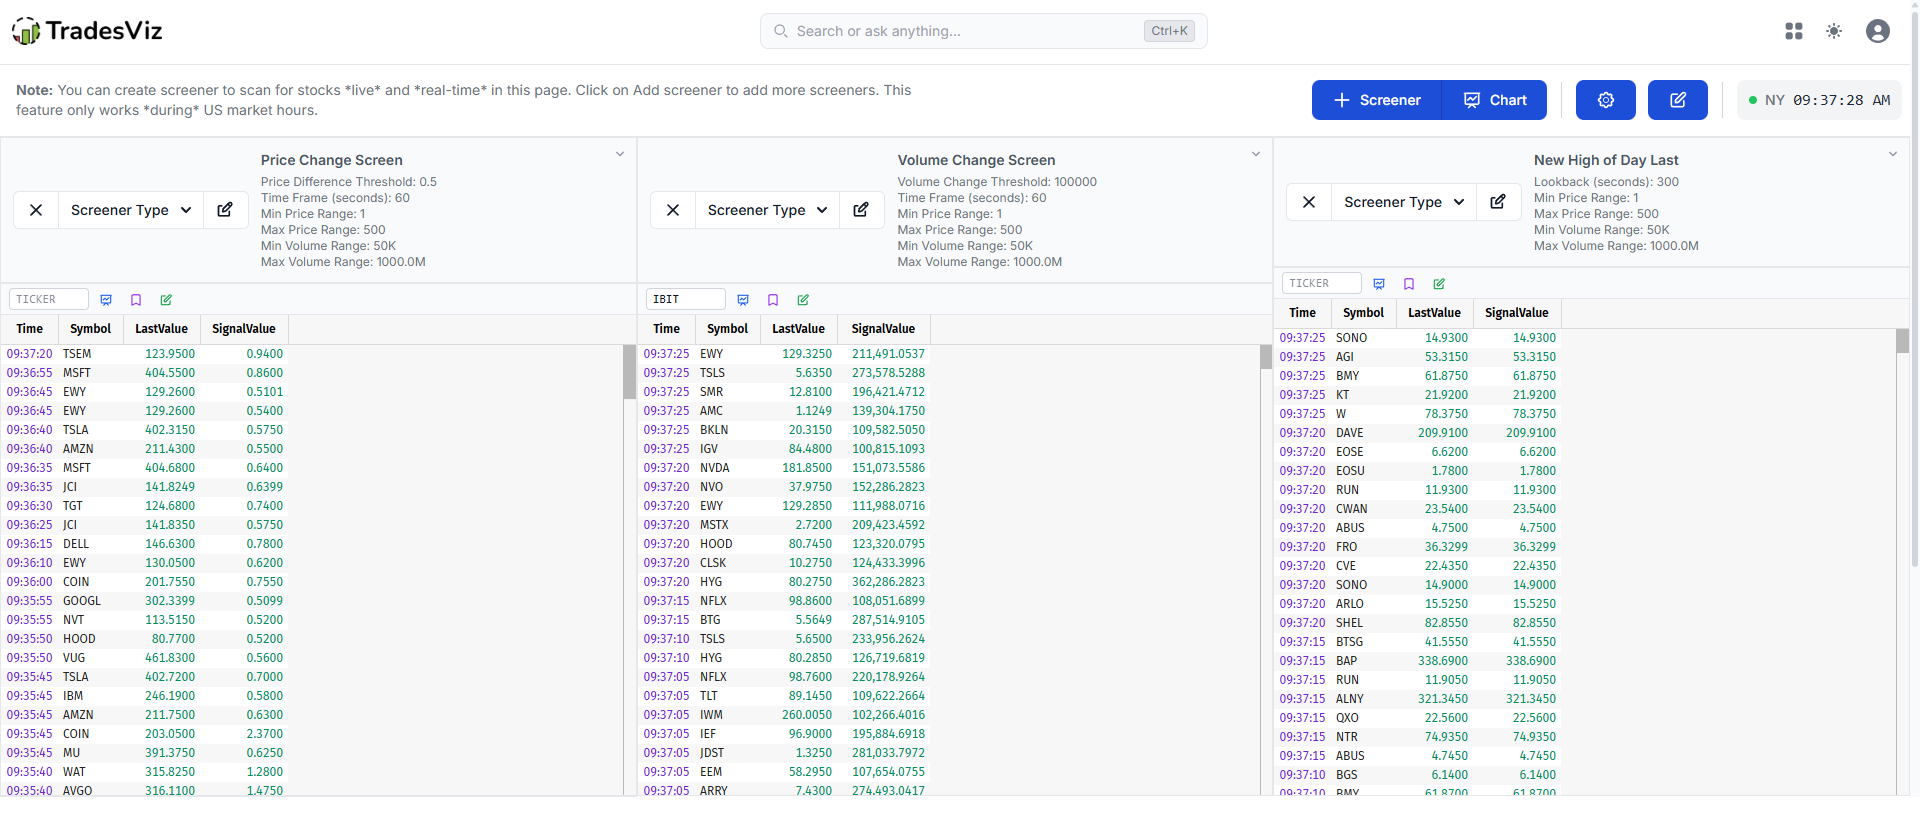
1. Price Change Screen
Detects stocks with an absolute price change exceeding a threshold within a time window.
- Default: $0.50 price move within 60 seconds
- Filters: Price $1–$500, minimum volume 50,000
- Best for: Momentum day traders looking for sudden moves. If something jumps $0.50 in a minute, something is happening - news, institutional activity, or a technical breakout.
2. Price Percentage Change
Screens for stocks with a percentage price move beyond a threshold within a time window. This normalizes across different price levels - a $0.50 move on a $10 stock is much more significant than on a $200 stock.
- Default: 3.0% move within 120 seconds
- Filters: Price $1-$500, minimum volume 50,000
- Best for: Finding stocks that are moving disproportionately relative to their price. Great for small-cap and mid-cap momentum plays.
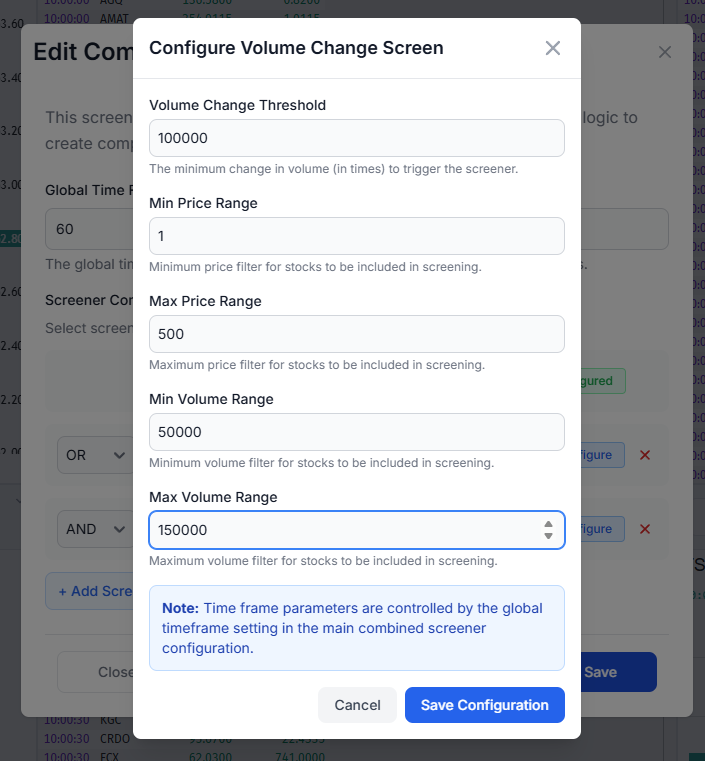
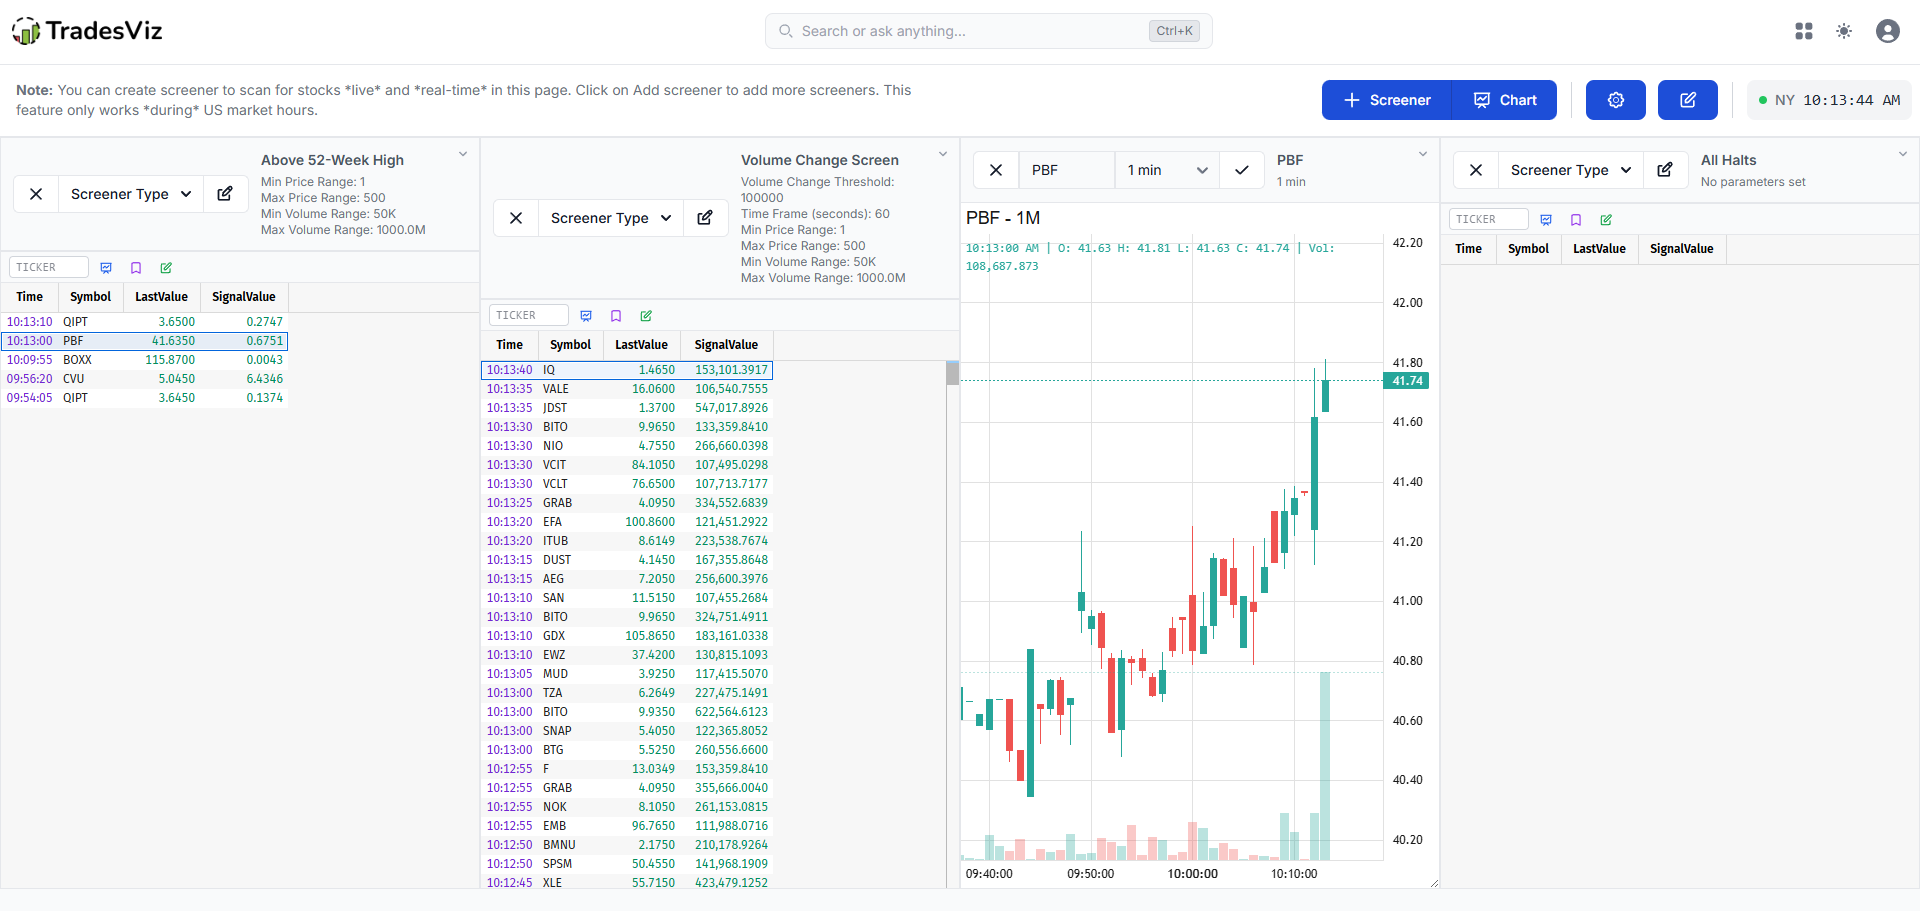
3. Volume Change Screen
Identifies stocks with a raw volume increase exceeding a threshold within a time window.
- Default: 100,000-share volume change within 60 seconds
- Filters: Price $1-$500, minimum volume 50,000
- Best for: Spotting institutional participation. When 100K+ shares change hands in under a minute, someone big is involved.
4. Volume Percentage Change
Screens for percentage-based volume spikes relative to the stock's recent activity.
- Default: 200% volume change within 60 seconds
- Filters: Price $1-$500, minimum volume 50,000
- Best for: Catching early moves on lower-volume stocks before the crowd notices. A 200% volume spike on a stock that normally trades 500 shares per bar is a massive signal.
5. Consecutive Green Bars
Detects stocks printing N consecutive up bars.
- Default: 4 consecutive green bars, 60-second bar duration
- Filters: Price $1-$500, minimum volume 50,000
- Best for: Trend followers. Four green bars in a row indicate sustained buying pressure, not just a spike. Can also be useful as a "don't short this" warning for contrarian traders.
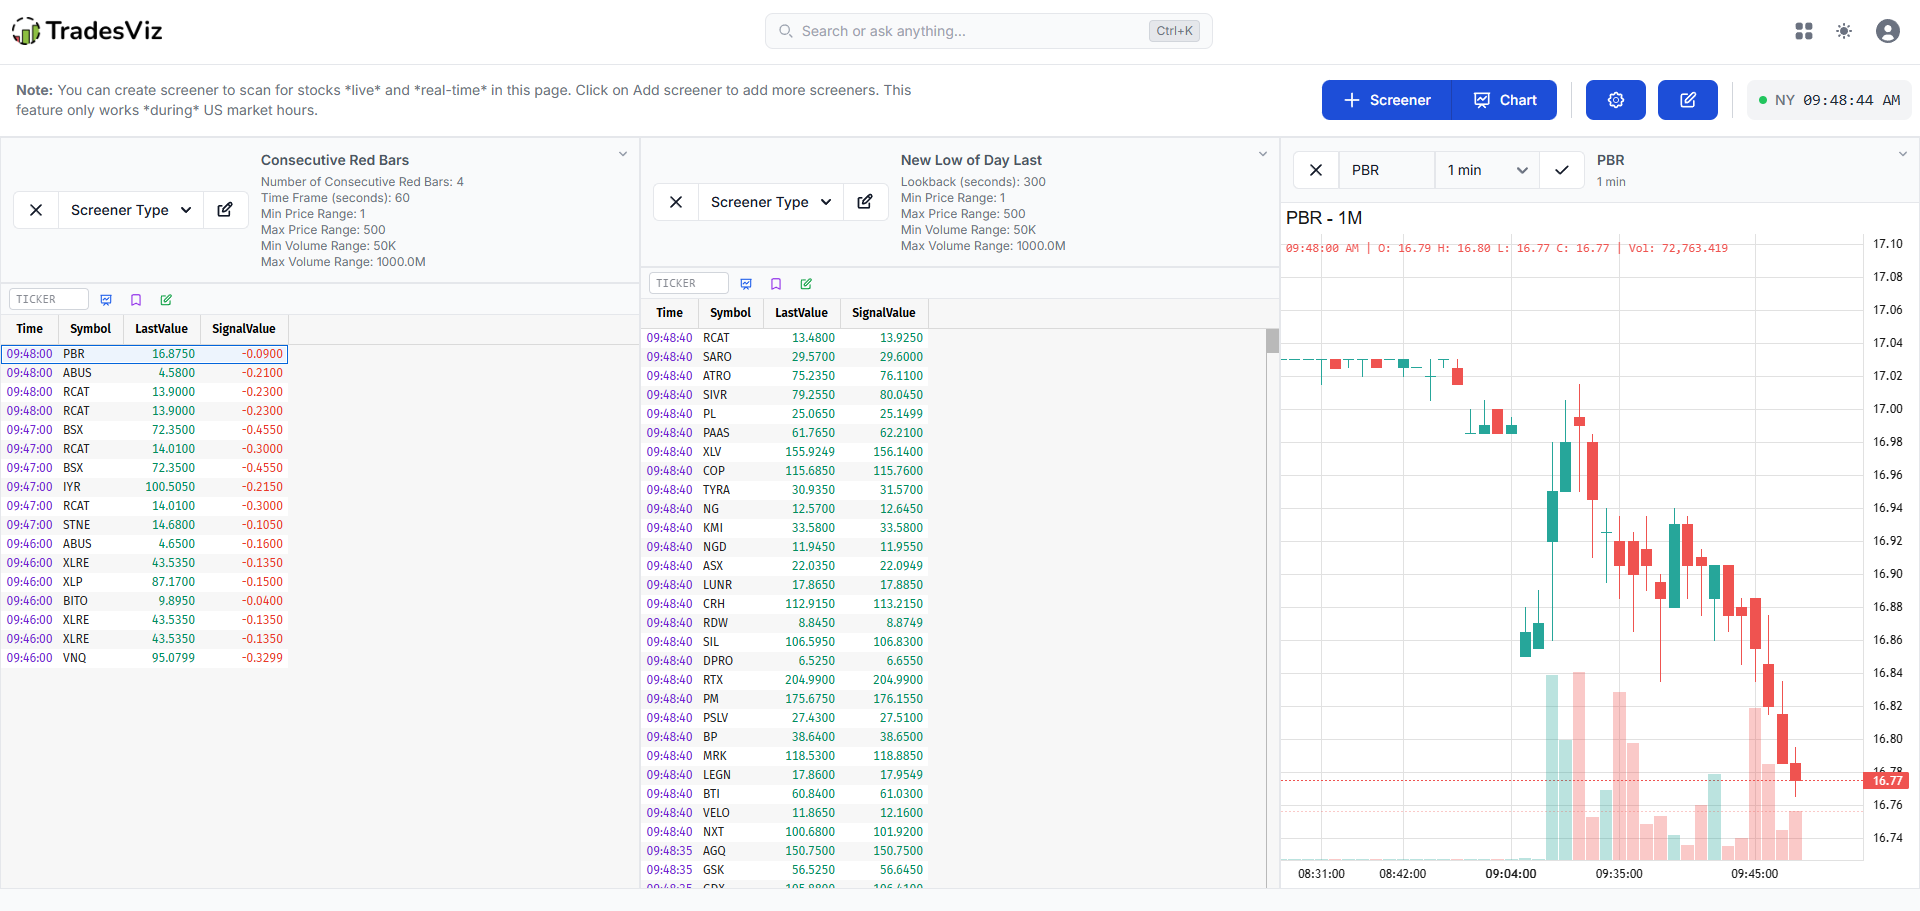
6. Consecutive Red Bars
The opposite of the previous screener - detects N consecutive down bars.
- Default: 4 consecutive red bars, 60-second bar duration
- Filters: Price $1–$500, minimum volume 50,000
- Best for: Short sellers or bounce traders. Four red bars could signal a capitulation low or the start of a sustained move down. The right interpretation depends on your strategy.
7. New High of Day
Flags stocks that have made a new intraday high within a lookback window.
- Default: New HOD within the last 300 seconds (5 minutes)
- Filters: Price $1–$500, minimum volume 50,000
- Best for: Breakout traders. A stock making new highs repeatedly is showing strength. Combine with volume confirmation for the highest probability setups.
8. New Low of Day
Flags stocks making new intraday lows within a lookback window.
- Default: New LOD within the last 300 seconds
- Filters: Price $1-$500, minimum volume 50,000
- Best for: Short sellers and mean-reversion traders watching for potential reversals at new lows.
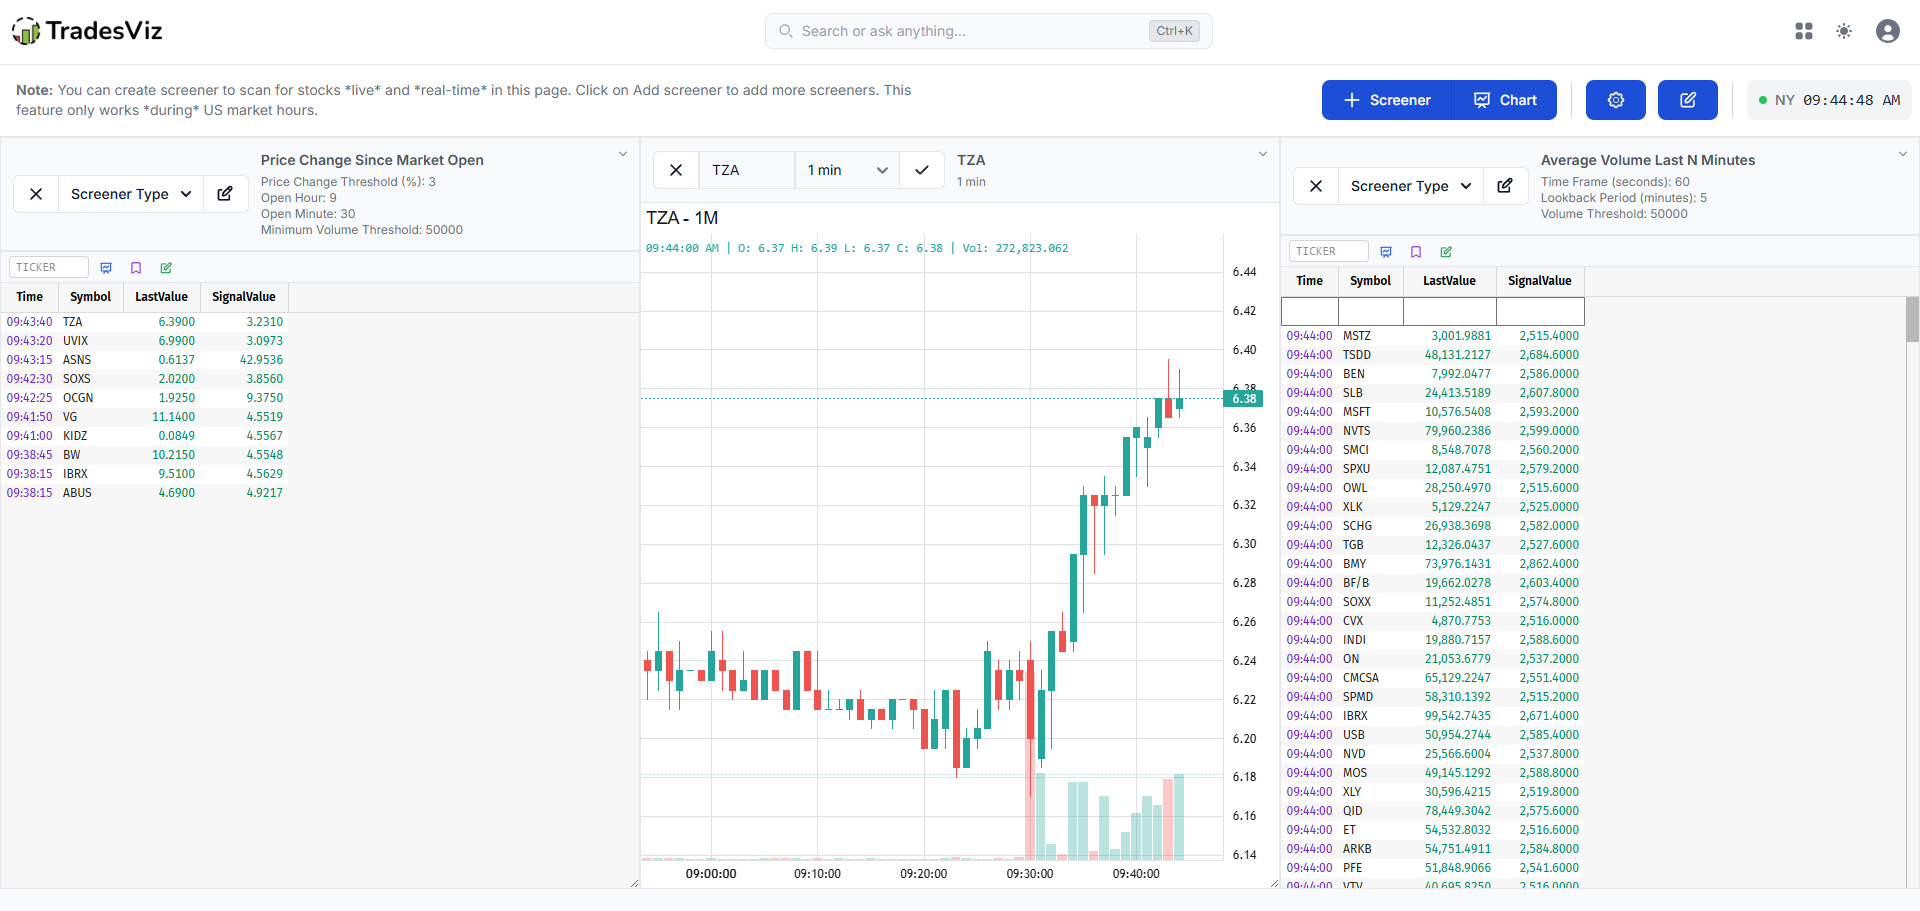
9. Price Change Since Market Open
Screens for stocks that have moved a significant percentage from a reference time (typically market open at 9:30 AM).
- Default: 5.0% change since 9:30 AM, minimum volume 50,000
- Best for: Gap traders and opening range breakout strategies. Stocks that have moved 5%+ from the open are the day's movers, and they tend to attract more attention (and liquidity) as the day progresses.
10. Average Volume Last N Minutes
Identifies stocks where the average per-bar volume over a recent window exceeds a threshold.
- Default: Average volume > 50,000 per minute over the last 5 minutes
- Best for: Ensuring liquidity before entry. This screener answers: "Is this stock actually tradeable right now, or did it have one spike and die?" Consistently high average volume = sustained interest.
11. All Halts
Displays all currently halted stocks. No parameters needed.
- Best for: Halt watchers. Stocks halt for a reason - usually extreme volatility or pending news. When they resume, the move that follows can be significant. Many day traders specialize in post-halt plays.
12. Above 52-Week High
Screens for stocks currently trading above their 52-week high.
- Filters: Price $1-$500, minimum volume 50,000
- Best for: Breakout and trend-following strategies. Stocks at 52-week highs have cleared all overhead resistance - there's literally nobody above you who's underwater on their position.
13. Below 52-Week Low
Screens for stocks currently trading below their 52-week low.
- Filters: Price $1–$500, minimum volume 50,000
- Best for: Contrarian and deep-value traders. Also useful for shorts - a stock making new 52-week lows with expanding volume is showing persistent selling pressure.
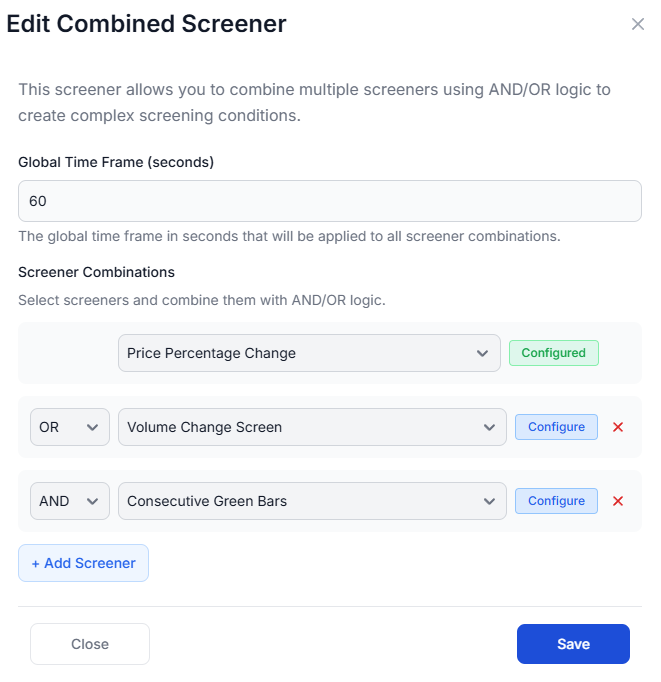
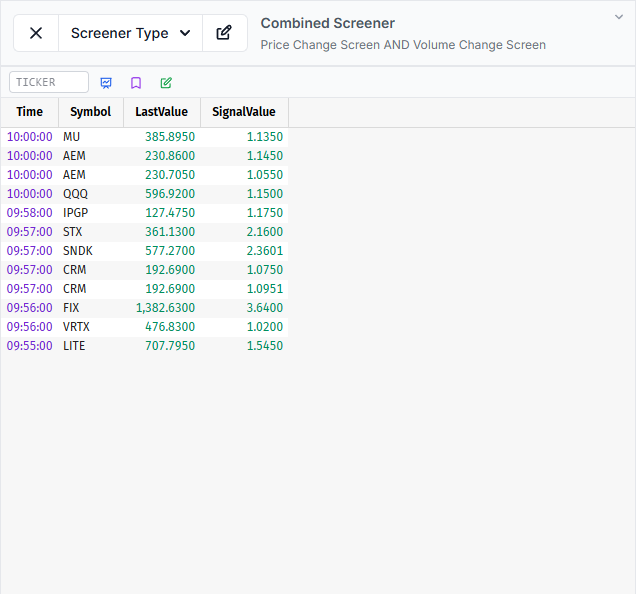
14. Combined Screener
This one is special. The Combined Screener lets you chain multiple screening conditions together using AND/OR logic.
- Example: "Price Change > $0.50 in 60s AND Volume Change > 100K in 60s" - only stocks meeting both conditions appear.
- Example: "New High of Day OR Consecutive 4 Green Bars" - stocks meeting either condition show up.
- Best for: Advanced traders who want confluence-based screening. This is how professionals scan - not looking for just price or volume, but price with volume with structure.
Each sub-screener within the combined screener can be individually configured with its own parameters. A global timeframe setting keeps them synchronized.
 |
 |
Screener Workflows: Suggested Setups for Different Trading Styles
The 14 screeners aren't meant to be used in isolation. Here are some practical setups based on different trading approaches. These are starting points - the whole idea is that you tune them to your style.
Momentum Day Trader
Add 3-4 screeners to your grid: Price Change, Volume Change, New High of Day, and a live chart set to 1-minute on your primary watch symbol. Set grid columns to 2. When a symbol appears across multiple screeners, that's your signal to investigate.
Opening Range Breakout Trader
Start with Price Change Since Open (set open time to 9:30, threshold at 3%) and Average Volume Last 5 Min. Add a chart set to 5-minute timeframe. After the first 30 minutes, review which stocks appear in both screeners. These are the names that gapped and held, with sustained volume, which are prime ORB (opening range breakout) candidates.
Reversal/Mean-Reversion Trader
Use Consecutive Red Bars (5 bars, 1-minute duration) alongside New Low of Day. When a stock shows up in both, it might be approaching capitulation. Add a chart to watch for stabilization patterns before entering.
Breakout Scanner
Run Above 52-Week High with Volume Percentage Change (300%+). These are stocks breaking multi-month resistance with conviction behind the move. Add All Halts as a passive monitor; breakout stocks occasionally trigger halts on the way up.
Live Charts Inside the Screener
You can add live charts directly into your screener grid alongside your screeners. This is important because switching between your screener and your charting platform is exactly the kind of context-switching that kills execution speed.
Each chart supports:
- Any US stock ticker
- 9 preset timeframes: 10 seconds, 30 seconds, 1 minute, 2 minutes, 3 minutes, 5 minutes, 15 minutes, 30 minutes, 1 hour
- Custom timeframes: Define any duration in seconds, minutes, or hours (minimum 10 seconds, maximum 4 hours)
- Live updates: charts stream in real-time, same as the screener results
Want to change the symbol? Just type a new ticker in the chart element's input field and hit Apply. You can have as many charts as you want in your grid - one for SPY to track the overall market, one for the ticker you're actively watching, and maybe a third on a longer timeframe for context.
 |
 |
Journal Integration: The Feature No Other Screener Has
Sure, there are 1000 different screener products on the market, and if you are reading, you are probably using one of them. But none of them have this.
This is what separates this from every standalone screener on the market. Everything you discover is one click away from being in your journal.
Symbol Action Bar
Each screener element has a quick symbol action bar - a ticker input with dedicated buttons for the three most common actions:
- Open Chart: Instantly creates a new live chart in your grid for that symbol at a 1-minute timeframe
- Add to Watchlist: Adds the symbol to today's daily watchlist
- Save to Today's Note: Records the symbol directly into today's journal entry
The workflow is simple: you see a ticker in the screener results, copy it (Deephaven's built-in table supports Ctrl+C / right-click → Copy Cell), paste it into the action bar, and hit Enter or click any action button. It's built for efficiency - no tab switching, no context loss.
This is also useful when you hear about a name from another source - a chat room, a news headline, a friend, and want to quickly pull it into your screener workflow.
Save Snapshot to Note
The toolbar's snapshot button captures your entire screener layout. Every active screener, every parameter setting, and writes it as a table in today's notes section (day explore) in your TradesViz account. Think of it as a "state capture" of your scanning setup. This is valuable for review: "What was I looking for today? What screens were active? Were my parameters too tight or too loose?"
Over time, correlating your screener configurations with your actual trading results reveals which scanning strategies lead to your best trades.
Customization: Layouts, Columns, and Persistence
The screener grid is fully customizable:
- Grid Columns: 1 to 6 columns. Running one large screener full-width? Use 1 column. Running 6 screeners plus 2 charts? Try 3 or 4 columns.
- Resize Mode: When enabled, individual elements can be dragged to custom widths. Maybe you want your primary screener wider than the secondary ones, or your chart to take up more space. This is all possible.
- Saved Layouts: Click "Save Layout" in the Settings dropdown, and your entire grid configuration - which screeners, which charts, their parameters, their widths, and their order is saved to your account. Come back tomorrow, next week, or next month, and it's all there.
Each screener element can also be individually configured:
- Change screener type on the fly via a dropdown - no need to delete and re-add
- Edit all parameters via a configuration modal (threshold, time window, price range, volume filters)
- Collapse/expand individual elements to save space while keeping them active
A Note on Data Transparency
We want to be upfront about something. The real-time data powering this screener uses unconsolidated market data. For the vast majority of actively traded US stocks, you'll never notice a difference - the data is fast, accurate, and reliable.
However, for lower-volume or thinly traded stocks, there may occasionally be gaps or missing data points. This is a natural characteristic of unconsolidated feeds. We're mentioning this because transparency matters to us - we'd rather tell you about a limitation than have you discover it and wonder what's going on.
For the type of stocks most day traders and active traders screen for - liquid names with real volume - this is a non-issue. And our default filters (minimum volume of 50,000 shares, minimum price of $1.00) are specifically calibrated to keep you focused on names where the data is robust.
The Bigger Picture: How the Screener Fits Into TradesViz
The screener doesn't exist in a vacuum. It's part of a larger ecosystem designed around one idea: everything a trader needs should be in one place, and everything should be connected.
Here's how the screener ties into other TradesViz features:
- Daily Screener Results: Already familiar with our end-of-day stock screener? The real-time screener is its live counterpart. Use daily results for pre-market prep, and the live screener for in-session scanning.
- Daily Watchlist: Symbols saved from the screener land directly in your daily watchlist, ready for review alongside your open positions and trade plans.
- Journal Notes: Every screener alert you save becomes part of your trade narrative. When you review trades later, you see exactly what caught your attention and when.
- Custom Dashboard: Build a custom dashboard that includes screener-derived metrics alongside your PnL, R-value trends, and other analytics.
- Trade Charts: After importing trades from your broker, overlay your entries and exits on technical charts. The screener helps you find the trade; the charts tab helps you review it.
- Trade Plans: Use screener observations to build and refine your trading plans. If your screener consistently shows you momentum plays, codify that into a plan with entry rules, stops, and targets.
- Tags: Tag trades that originated from screener alerts. Later, use tag analysis and pivot grids to see if screener-sourced trades outperform your other setups.
- AI Q&A: Ask questions like "What's my average R-value on trades I tagged as screener alerts?" and get instant answers with charts - no spreadsheet required!
A Trading Journal with a Stock Screener: An Industry First!
Let's just say it plainly: no other trading journal has a real-time stock screener. Not one.
Some journals have a "top movers" widget. Some show you end-of-day scan results. A few integrate with third-party screener platforms via links. None - zero have a native, real-time, configurable, multi-strategy stock screener built directly into the platform.
And that's before we talk about the journal integration, which makes the screener 2x more useful than any standalone scanner.
Now, think about what this means from a cost perspective, because the math is almost comical:
The typical active trader's tool stack:
- Trading Journal: $30-$50/month (competitors charge $35-$60/month for far fewer features)
- Real-time Screener: $30-$100/month (standalone screener subscriptions)
- Options Flow: $50-$150/month (standalone flow platforms)
- Charting: $15-$40/month (if not included with broker)
Total: $125–$340/month
TradesViz Platinum: Includes the journal, the real-time screener, options flow, seasonality, fundamentals, simulators, AI analytics, custom dashboards, auto-sync from 40+ brokers, and hundreds of other features... for a fraction of that cost.
We've talked about this pricing advantage in our State of Journaling 2025 and our 2026 comparison guide. The value gap is only getting wider, and the screener makes it even more absurd.
It's not about being cheap. It's about the fact that our focus is on building features that genuinely help traders, not building a marketing machine that extracts maximum revenue while shipping the bare minimum. Every dollar you spend on TradesViz goes into engineering. If you've read our blog long enough, you know this isn't a talking point - it's the pattern you've been watching play out since 2019.
Feature-for-Feature: Screener Pricing Comparison
| Feature | TradesViz | Standalone Screener A | Standalone Screener B | Competitor Journals |
|---|---|---|---|---|
| Real-time screening | ✅ | ✅ | ✅ | ❌ |
| 14 screening strategies | ✅ | Varies | Varies | ❌ |
| Combined AND/OR logic | ✅ | Some | ✅ | ❌ |
| Live charts in same view | ✅ | ✅ | ❌ | ❌ |
| Journal integration | ✅ | ❌ | ❌ | ❌ |
| Save to watchlist | ✅ | ❌ | ✅ | ❌ |
| Layout persistence | ✅ | ✅ | ✅ | ❌ |
| Includes full trading journal | ✅ | ❌ | ❌ | Journal only |
| Includes options flow | ✅ | ❌ | ❌ | ❌ |
| Includes AI analytics | ✅ | ❌ | ❌ | Limited |
| Approximate monthly cost | Included in Platinum | $30–$100/mo | $50–$150/mo | $35–$60/mo (no screener) |
The column on the far right is really all you need to see. Competitor journals charge $35–$60 per month and don't have a screener at all. They don't have options flow. Many don't have custom dashboards. Some still don't even have proper options support. And somehow, they charge more.
Practical Tips for Getting the Most Out of the Screener
Before we wrap up, here are a few things we've learned from building this and watching traders use it:
- (!!) Don't run 10 screeners at once: Start with 2–3. Get familiar with how each one behaves during different market conditions. Adding more later is easy; being overwhelmed on day one isn't productive.
- Use the volume filters: The default minimum volume of 50,000 is there for a reason. Screening without volume filters will flood you with illiquid names that you can't realistically trade.
- Save your layout early: Once you find a setup you like (say, 3 columns with Price Change + Volume Change + a chart), save it. You don't want to rebuild your grid every session.
- Note everything: The ticker actions menu is the fastest path from "I see something interesting" to "It's in my journal." Build the habit of entering the symbol → Save to Note on stocks that catch your eye, even if you don't trade them. Your future self will thank you during review.
- Review your snapshots: Periodically look back at the screener snapshots saved in your journal notes. Are your scanning parameters aligned with the trades you actually took? Are you screening for momentum but trading reversals? This kind of alignment check is incredibly valuable.
- Use the Combined Screener once you're comfortable: The AND/OR logic is powerful but adds complexity. Master the individual screeners first, understand which combinations produce the best results for your style, and then codify those combinations into a Combined screen.
What's Next
The real-time screener is live and available to all Platinum users. As with every feature we ship, it will continue to evolve based on feedback and usage patterns. We have ideas for what comes next - but we'd rather hear from you first about what matters most for your workflow.
If you're already a TradesViz user, head to your dashboard, open the application drawer, and try the screener today. If you're not a user yet, start your free trial and see for yourself what it looks like when a trading journal is built by engineers who actually care about solving traders' problems.
For a detailed breakdown of everything else TradesViz offers, start with our 2026 journal comparison, explore our custom dashboard guide, or dive into our AI Q&A documentation.
We'll keep building. You keep trading. And we'll make sure you have the tools to get better at it every single day.