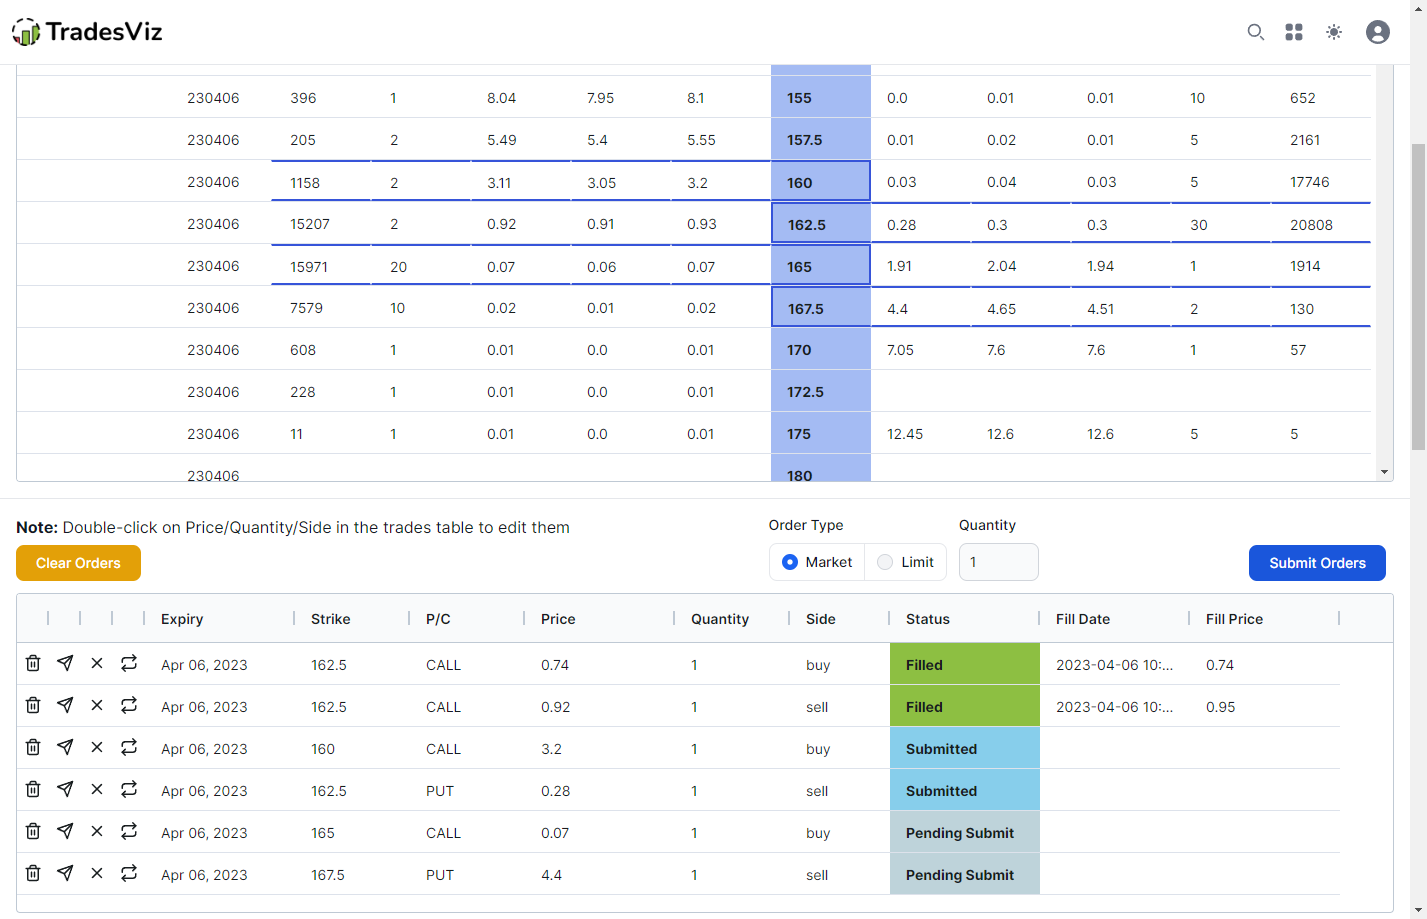
This is one of our biggest features in 2023. For the first time *ever*, you can simulate your options trades in TradesViz itself.
To our knowledge, there are no other online OPTIONS simulation tools available - one that can work with the same feature set as our stock/future/forex simulator.
In this blog post, we will unveil and talk about all the features of our new full-fledged options simulator.
First, we will celebrate the differences between our existing options spread simulator and this options chain simulator. You can find more info about our existing options spread simulator here: https://www.tradesviz.com/blog/options-execution-simulation/.
- The options execution simulator is primarily for learning the correlations between the underlying along with the charting of the options spread/legs. This means you can view the exact options OHLC chart, and view the exact pnl per minute for the options strategy you are trying to simulate.
- This options simulator on the other hand is primarily for trading practice. It is designed to be just like the option chain you see in your trading platform. You can place orders, see them get filled in real-time and check your pnl then and there as it's automatically logged to your journal. There are no options OHLC charting in this simulator but we may add it in the future.
- The key difference is:
- If you want to really learn the options vs price vs pnl correlations for complex strategies, check the options executions simulator.
- If you want to practice and improve your real-time options trading, use this options simulator.
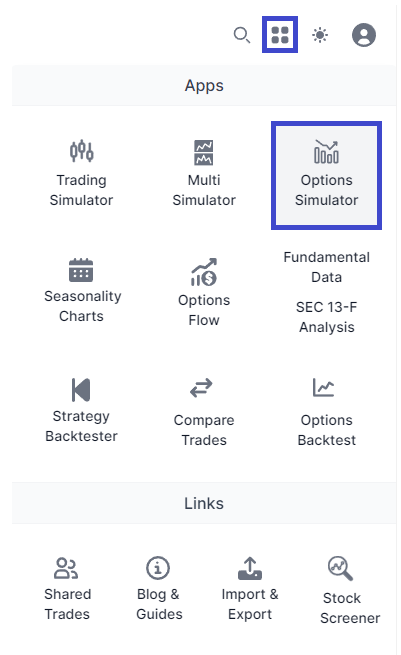
You can visit the options simulator by clicking on the 3-line icon on the top right corner of your dashboard and clicking on the "Options simulator" option.
Once you launch the option simulator page, you will see a screen similar to that of our multi-chart-simulator with a central control section at the top.
- Select the symbol you want to simulator (US stocks and indices. For example, you can type in SPX to simulate an SPX options chain)
- Select the date (data since 2022 Jan is available)
- Press play button
Once you press the pay button, you will see the options chain load up. Please note that depending on the total volume of trades made that day, loading options can take up to a few minutes.
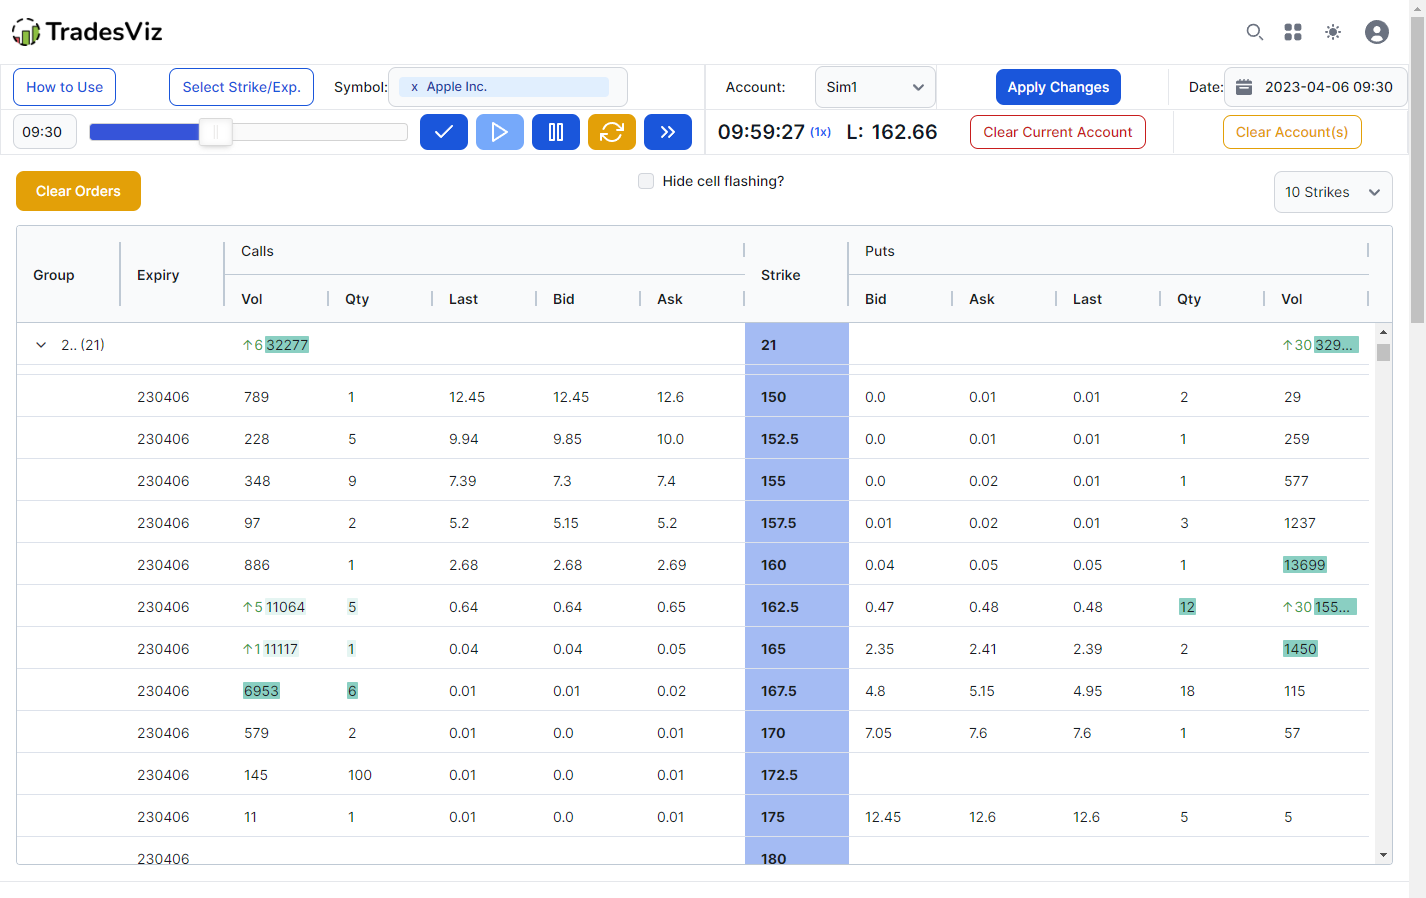
This is the same advanced table we use for our pivot tables in the main dashboard so you can expect the highest speed, and zero lag when it comes to table-related operations.
After you see both the chart and the options chain, the simulation will automatically start and you can start trading.
Trading using the TradesViz options chain is very simple:
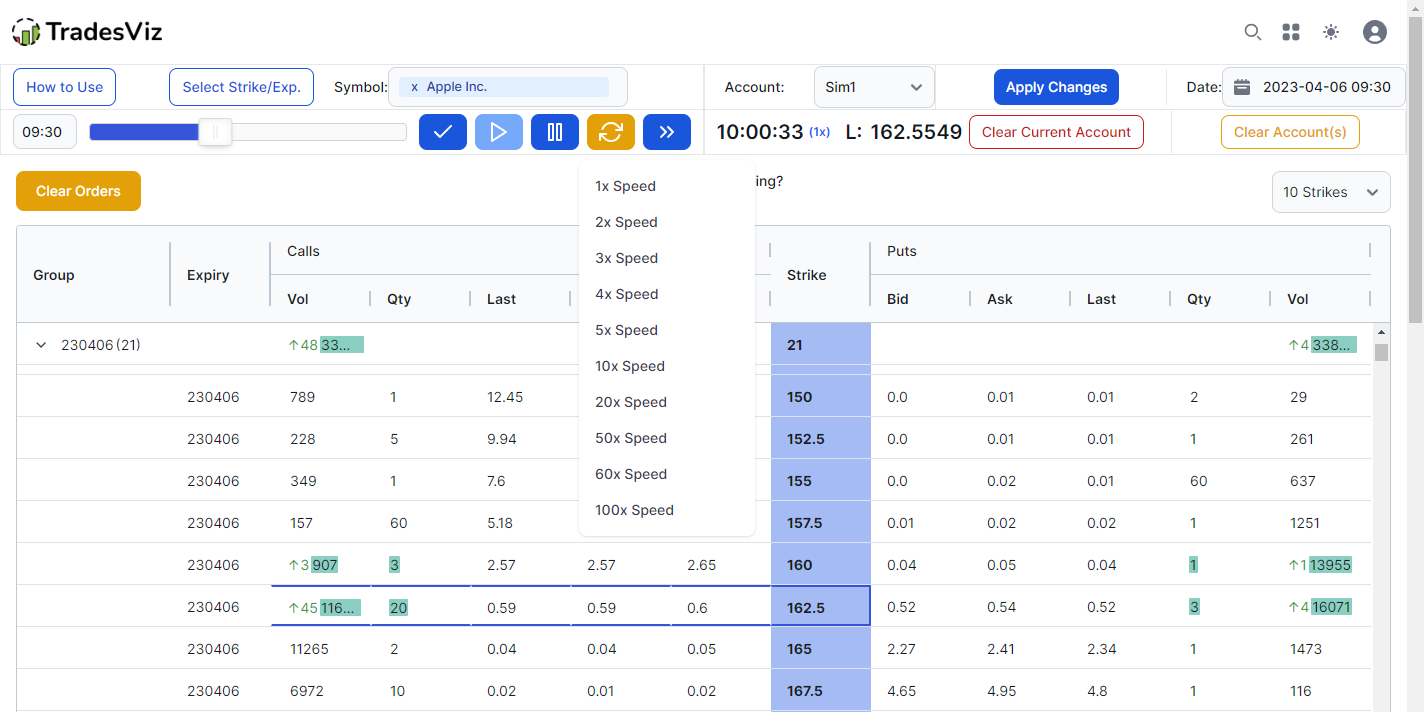
- Click on any bid or ask the cell to sell and buy respectively.
- Clicking on any of the cells will immediately place a "pending to send" order in the orders box right below the chain.
- You can then send the order as either a limit or market order.
- Note that you can select multiple executions at once thus creating options strategies like you would in any normal chain.
Here is a video demo of simple options simulation execution of options legs on an AAPL chain:
The order section has multiple buttons on the left side of each order/row:
- Delete Order: This will close or remove the order if it is in "pending to send" or in the "submitted" state. Active/filled orders cannot be canceled.
- Repeat Order: This will create a clone/copy of the order as a "pending to send" order in the orders table.
- Close Order: This will create a clone/copy of the order with the opposite side as a "pending to send" order in the orders table.
- Send Order: Sends an order to be simulated with the current state of the running options chain.
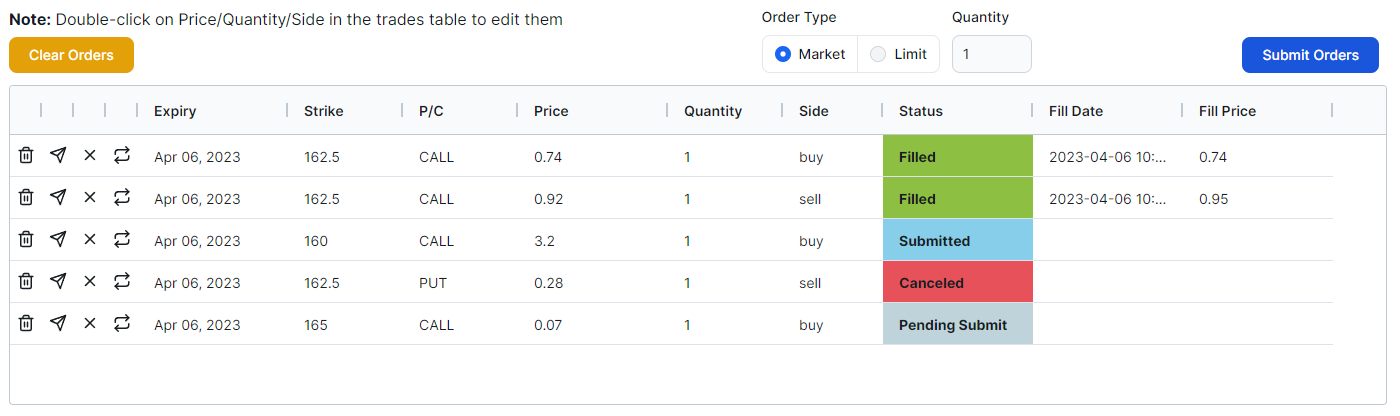
Each order can be in one of 4 stats:
- Pending submit: This is the state when an order has just been created (by clicking on bid/ask in the chain or by cloning an exiting order)
- Submitted: An order is changed to the submitted state when it is sent to the simulator and is waiting for a fill. In this state, you can still cancel the order.
- Filled: Once there is a price match (either market or limit), an order is considered filled and an entry is automatically added to your journal.
- Canceled: Orders that are canceled are just there for your reference and cannot be re-sent - however, you can clone them.
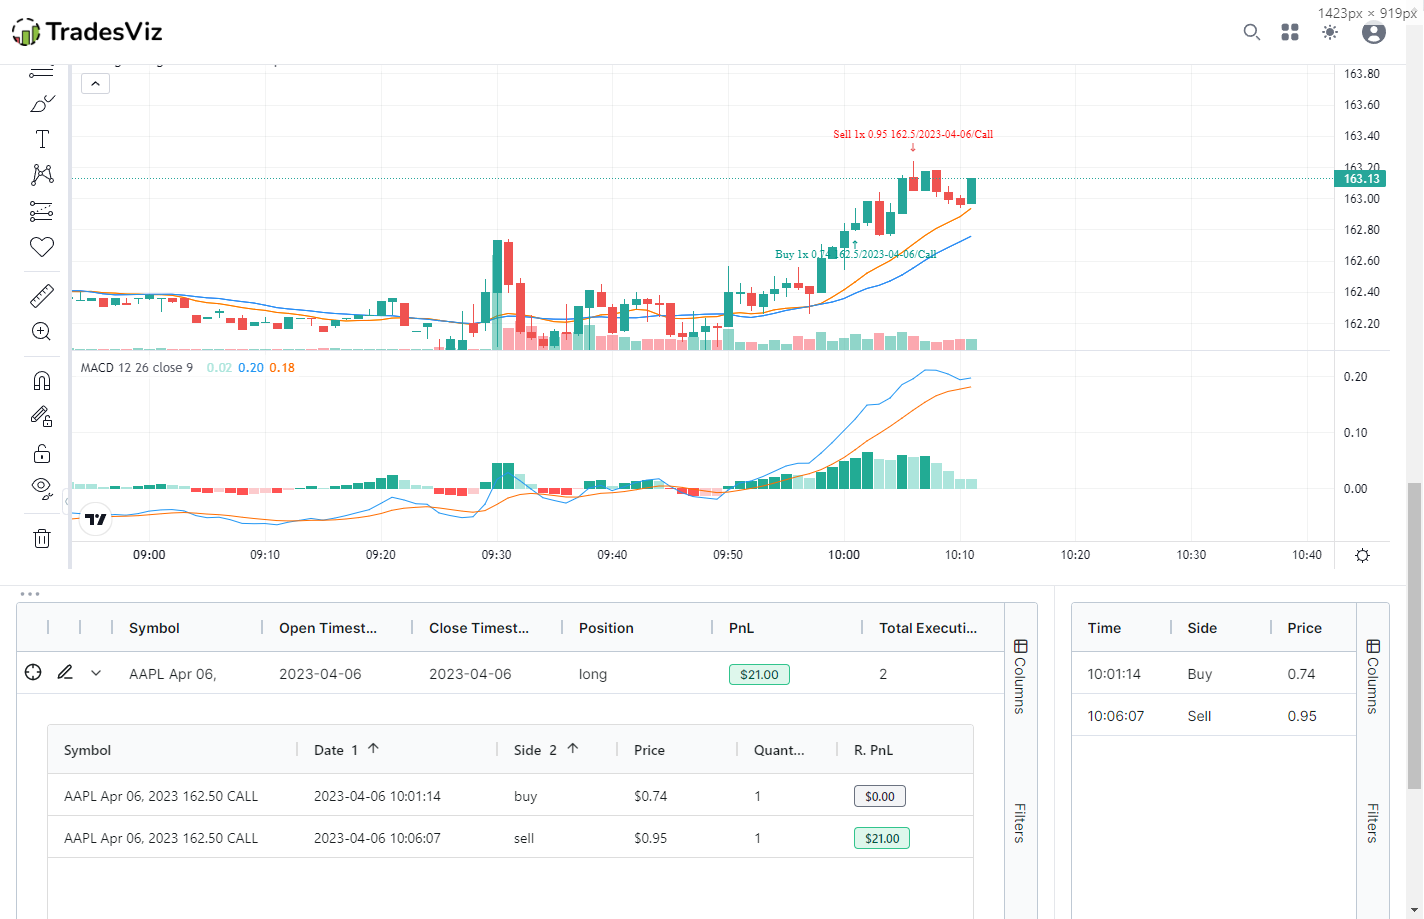
Below the order entry is where you will see the live chart - this chart is similar to the chart in our regular stock/future simulators where you will see movements in the seconds-level. You can freely change the timeframe of the chart and this chart will also show your options executions.
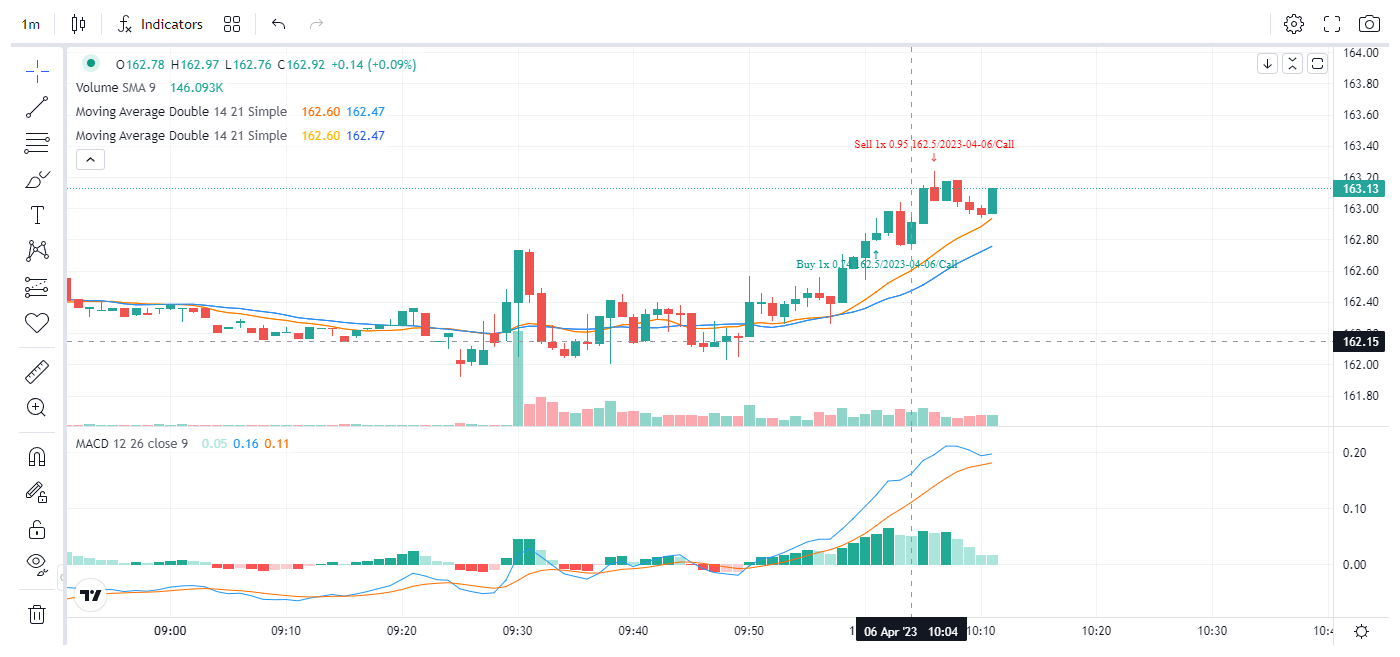
As with our other simulators, you can easily speed up the simulation process by up to 100x, pause, and also seek to any time of the day, and all the elements - options chain and the table will be updated/refreshed accordingly.
Remember that all your executed orders are saved to the trading account you choose at the top right corner. We suggest creating a dedicated account for your simulation trades. All your orders are also shown at the bottom with the pnl and all the relevant details.
That completes the walkthrough of the options simulation on TradesViz. A first in trade journaling, and even in the entire FinTech SaaS space. Here are some tips we have for you to effectively use the simulator:
- When you start the simulator, wait for a few seconds so that all the charts are loaded completely.
- Loading very frequently traded options like 0-DTE SPX or SPY options can take some time.
- Experiment with limit and market orders to see how your options strategy would work - spreads in options are very important and the TradesViz options simulator is the best place to experience this in real time.
- Adjust your strikes range by using the dropdown at the top left corner of the chain. By default, the options chain table shows ALL the expires and 10 strikes (each above and below the current price). You can also use the filters in the table itself - by hovering your mouse pointer over the columns and clicking on 3 lines icon > filter icon to filter this with even finer detail.
Update Sep 2025:
You can now resize the options simulator layout charts by dragging the border lines between the charts. This works well with the already available multi-layout mode. Double-clicking the border will reset the size. Check the video below!
That's it for now! Please let us know your feedback by emailing us at [email protected]. We have improved the other simulators (single and multi-chart) based on your feedback since the launch and we are looking forward to do the same with this feature also!
We hope, with this feature, we are making TradesViz the #1 platform for journaling, simulation, analyzing and more for not just stock/futures/forex traders, but for options traders as well.