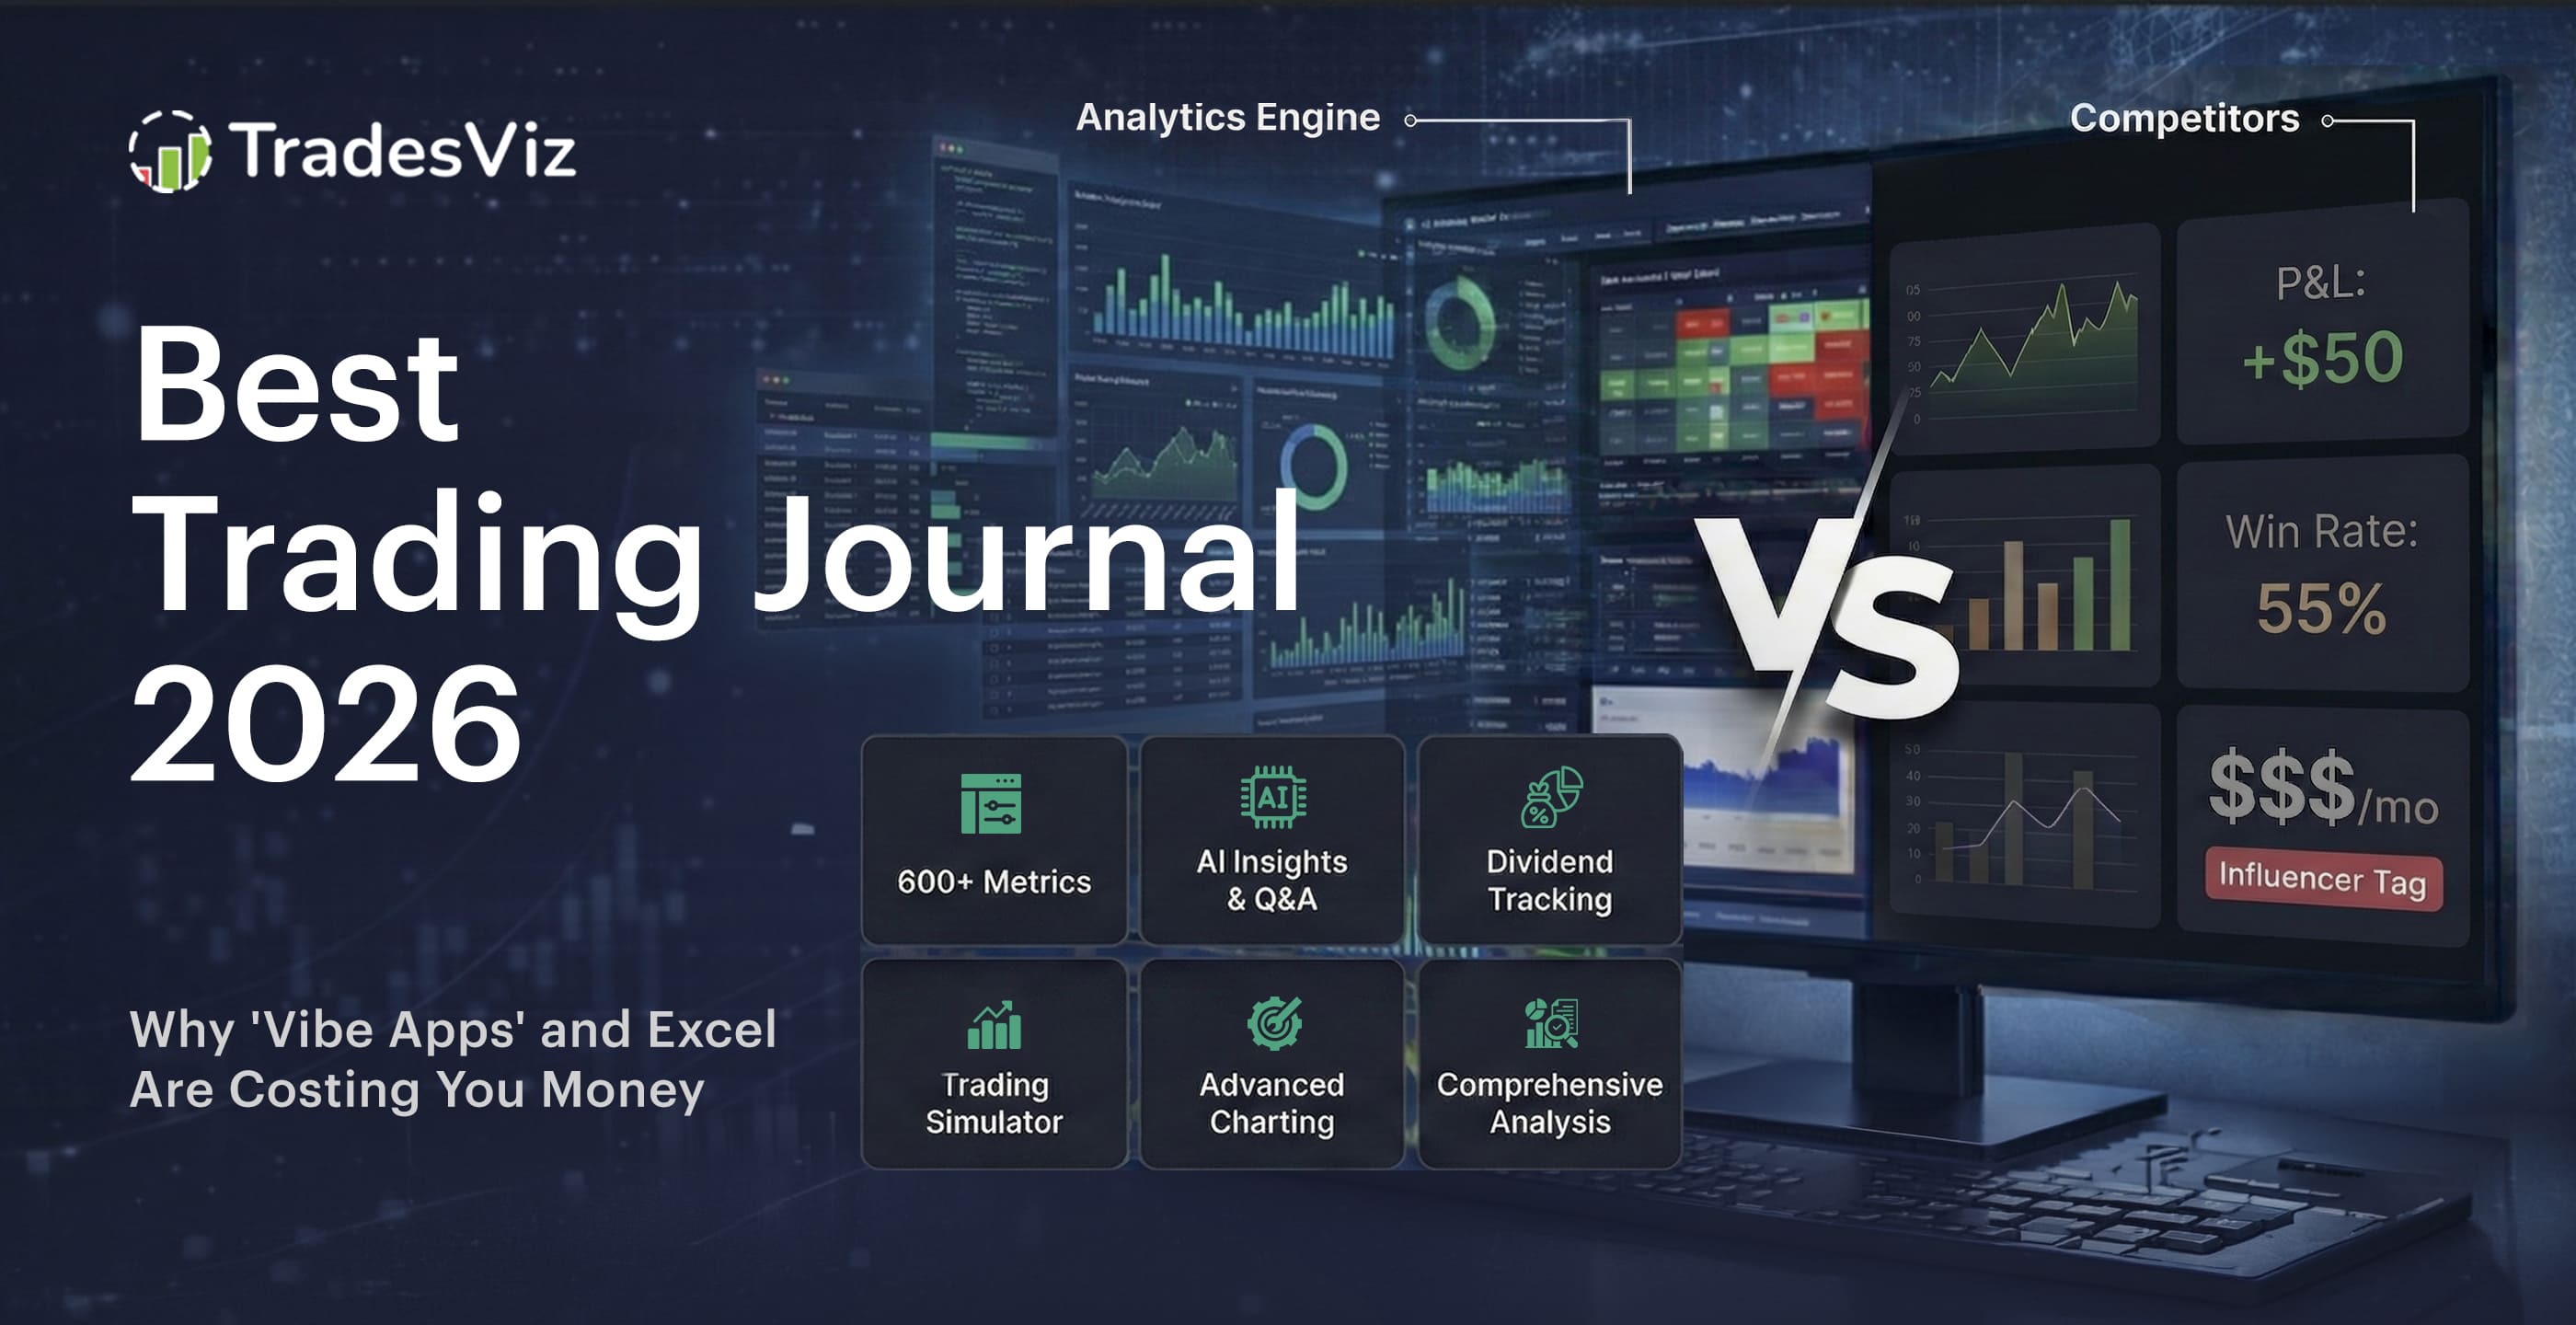
Let's be honest about why you're reading this...
You Googled "best trading journal 2026." You scrolled. You found the same recycled listicles, repackaged from 2022, pasted into 2024 templates, and republished with a new year in the title. Every single one ranked the same five tools, in the same order, with the same affiliate links.
You noticed. Because you're a serious trader looking for a legitimate solution.
Here's what those articles won't tell you: the tools they recommend are built to generate commissions for the blogger, not alpha for the trader. The economics are simple. The app with the highest affiliate payout gets the #1 spot. Nobody in that content supply chain has ever calculated an expectancy on their own book.
This is not a ranking. This is a technical audit. We're going to define what a professional automated trading journal must do in 2026, explain why the popular options fail those criteria, and show you what it looks like when someone actually builds the engine instead of the toy.
The Three Failed Archetypes of 2026
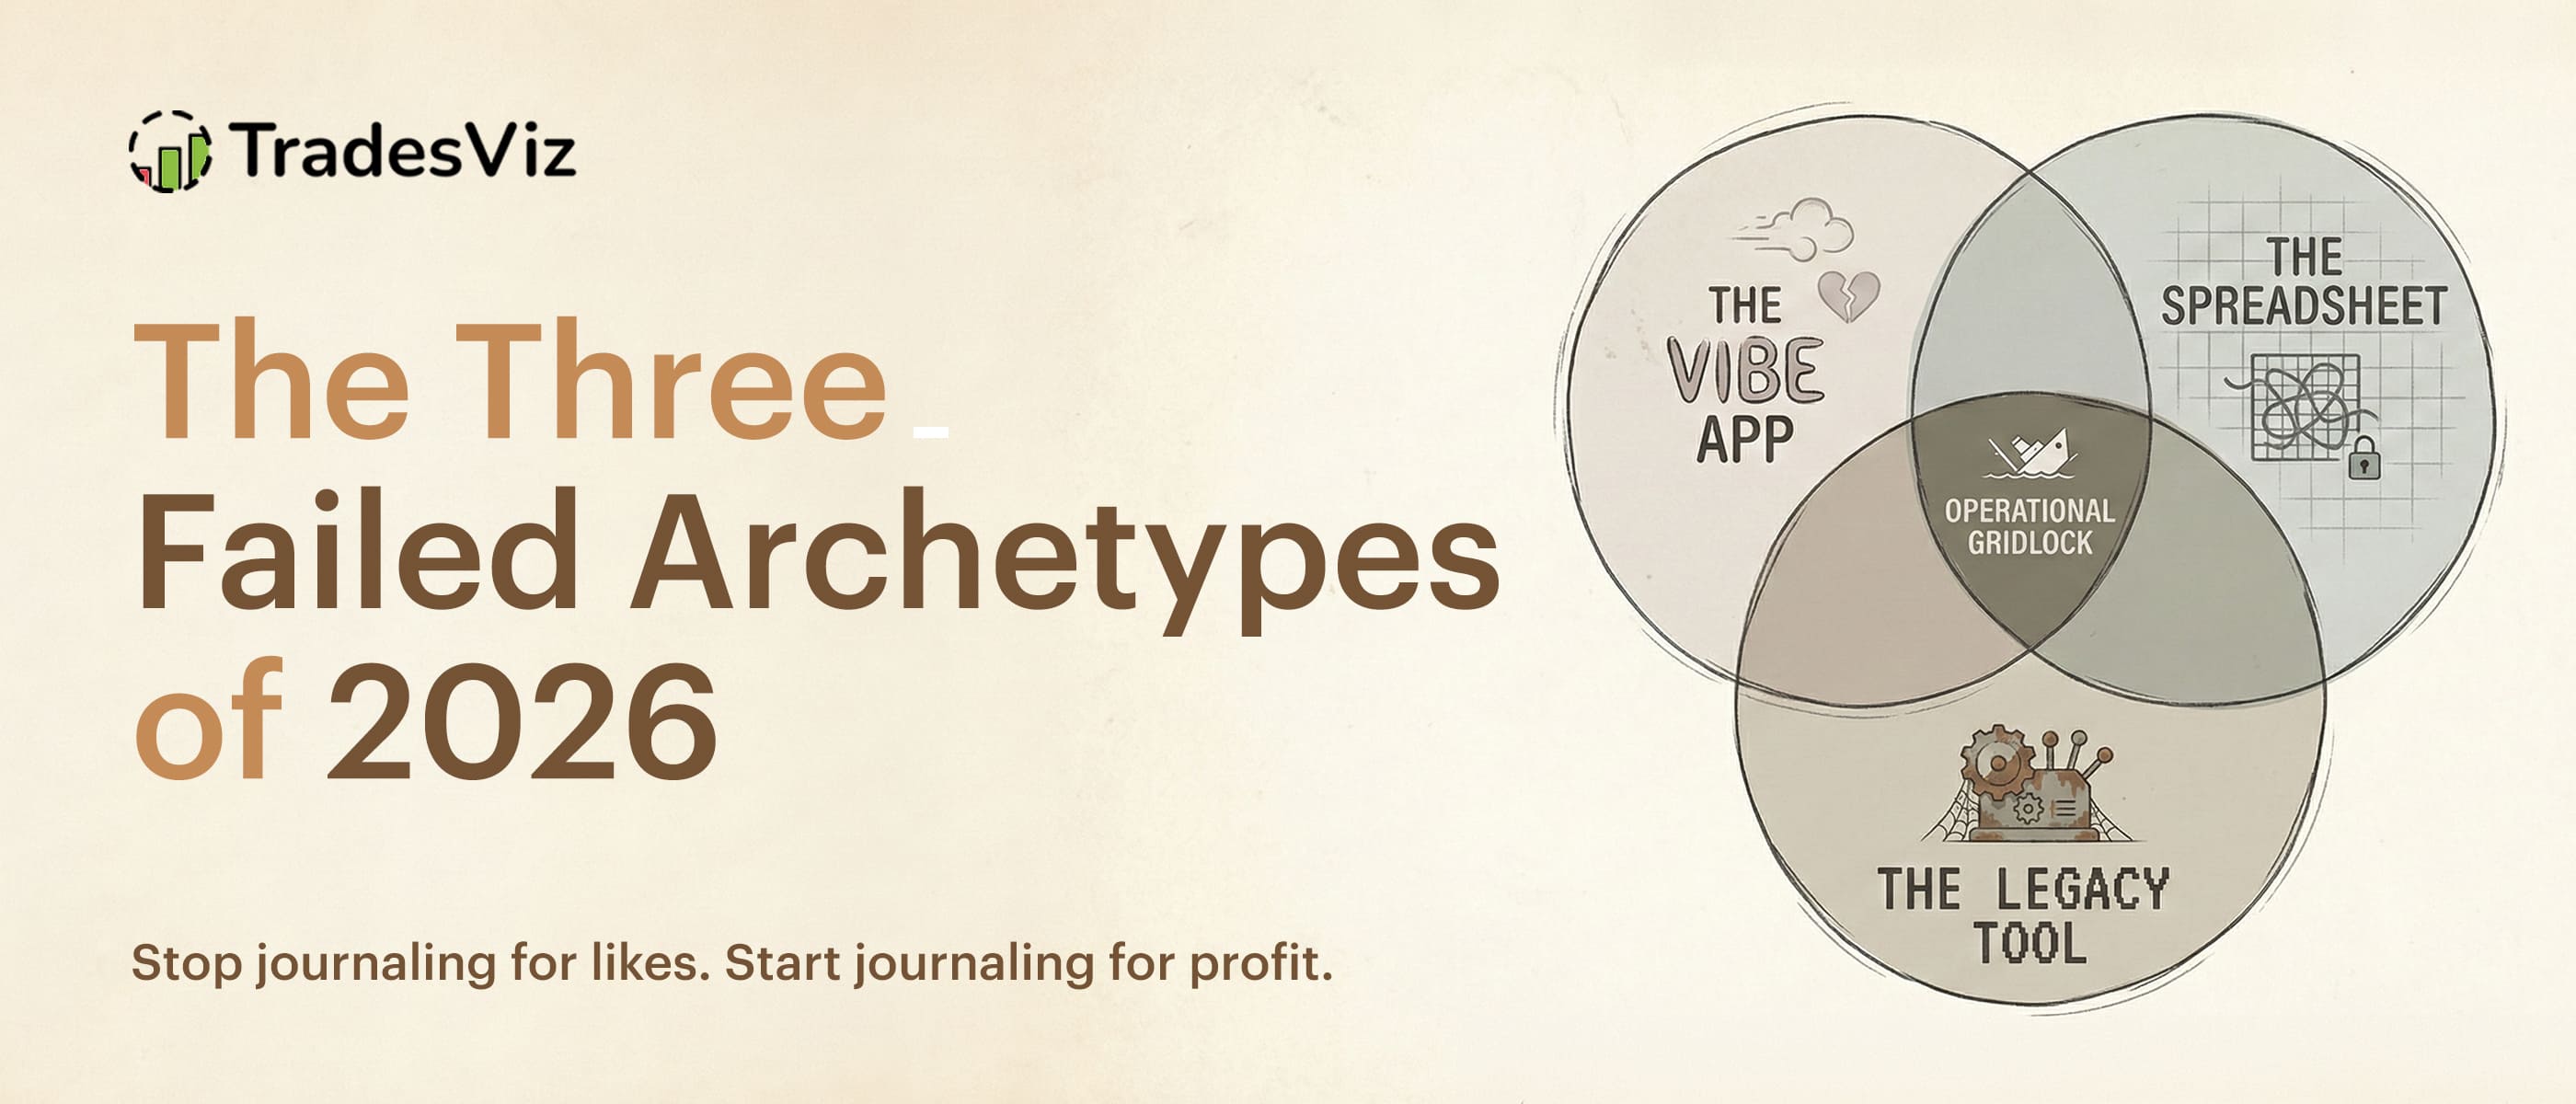
To understand the necessity of an Analytics Engine, we must first ruthlessly excise the obsolete. The current market for trading software is flooded with "Slop" - low-utility applications that prioritize form over function. These tools fall into three distinct, failing archetypes. You likely subscribe to one of them right now.
The "Vibe" & "Psych" Trap
There is a disturbing trend in modern fintech to "gamify" the act of losing money. These applications are designed by marketers, not engineers. They are built on the premise that if the software looks like a video game or a social media feed, the user will remain engaged long enough to pay the monthly subscription, regardless of their trading performance.
You know these applications. Launched by trading influencer(s) with hundreds of thousands of YouTube subscribers. Sleek. Dark mode with neon accents.
And functionally hollow.
No amount of "Mental State" tagging will fix a strategy that ignores institutional order flow. If you buy a 0-DTE call option because you "felt disciplined" and the app gave you a "Good Job" badge, but the entire institutional market was selling blocks of that same strike, your "Happy" tag is irrelevant data.
The Vibe App is dangerous because it feels professional while providing zero professional utility. It is a participation trophy for the financial markets. It focuses on the trader's internal state, which is subjective and often irrelevant, rather than the external market reality.
These apps prioritize the creation of "P&L Cards" for social media. This creates a feedback loop where you start optimizing for trades that look good publicly - high win-rate scalps, instead of trades that pay well - lower win-rate, high R-multiple trend trades. A study showed that traders in a simulated gamified trading app took on more risky trades than those in a non-gamified environment, driven by their goal to "win the game" or move up the leaderboard.
Your journal should be a private laboratory for dissecting failure, not a public billboard for vanity metrics.
...and the comparison doesn't end there... read on...
The "AI" Checkbox Problem: These apps slap "AI-powered" on their marketing page because they bolted on a chatbot that gives you vague motivational feedback like "You seem to overtrade on Fridays. Consider being more patient." That's not AI. That's a fortune cookie with your name on it.
Real AI in a trading journal means converting natural language into database queries against your actual data. It means you type "show my average R-value for trades before noon vs. after noon" and get back a chart in 15 seconds that would've taken 15 minutes in a spreadsheet. More on this later.
The Technical Vacuity: Beyond the psychology, these apps are data-thin. Try answering this question: "Show me my win rate on breakout setups, only when SPY is below its 200 SMA, and time is after 11 AM." The Vibe App can't answer this. It doesn't have the database architecture for multi-conditional queries. It was designed for scrolling and sharing screenshots to Instagram, not analyzing.
The Multi-Asset Disaster
Try importing complex options positions. Watch it panic. These apps treat options as an afterthought — a checkbox on the feature page that technically exists but produces no usable analytics. No Greeks tracking. No spread visualization. No strategy-level P&L. You might get your options trades in the journal (if the import doesn't break), but you'll get nothing out of them. Meanwhile, TradesViz has this.
The USA-Only Blindspot: Trade on the NSE in India? The ASX in Australia? The TSX in Canada? Good luck. These apps think the United States is the only country that trades. If your broker isn't Schwab or Robinhood, etc., you're either stuck with CSV gymnastics or you're simply not welcome.
These are tools optimized for Instagram stories, not P&L improvement. If your journal is better at generating content than insights, it's working against you.
How TradesViz Compares
Check our X/Twitter feed for yourself. The polar opposite of the above. Insights into features that you will use every day and tips on how to effectively analyze your trades. We don't care about anyone's public pnl. Did you have a good month? Excellent. Now study and learn what you did well. Bad month? No problem. Practice again in the simulator and try not to repeat your mistakes. Also, daily screener results from the dashboard of TradesViz - nothing external, just pure useful data, as long as you are a participant in the market. The goal is not to glorify your pnl, but to seek ways to improve and move to the next goal.
On the design/"looks" side, look, the goal is to get you the data you need in the most efficient way possible. Don't expect fancy neon/Apple-like graphics in a data analytics platform. Learn to look for utility. It's super easy to create the most beautiful dashboard to show your massive losses in the most pleasing way possible, but... is that what you are here for?... Is that why you trade?
The Spreadsheet Cosplay
"I'll just build my own. It's free."
The Spreadsheet is the hallmark of the stubborn amateur. It is born from a desire to save $30 a month while sacrificing dozens of hours of potential analysis time each week. The argument for the spreadsheet is "customizability." The reality of the spreadsheet is "friction" and "dimensionality collapse."
The Scalability Wall
Manual entry works for a swing trader taking 3 trades a week. It is structurally impossible for a scalper or an active options trader. If you're typing "Long AAPL 180C 2/21" by hand, you're a data entry clerk, not a trader. Spreadsheets offer complete customization, cost nothing, and don't require learning new software - but it works only "to a point." As volume increases, the friction of logging entry, exit, stop, target, fees, and commissions becomes a second job. You stop logging "small losses," you round off commissions, and your dataset becomes corrupted by your own exhaustion.
And... let's not forget the DIYers. The new generation of "I'll just vibe code my own journaling app" category. Here's a quick fun fact: We discovered at least 20 vibe-coded app slop on various social media claiming they are doing something brand new, only to disappear in ~30 days. This is not only new traders looking to make some $$ by assuming a journaling app is simple to create, but also new users who are swept by the Claude-wave where they assume maintenance, updates, reliability, integration, support, etc., are also "magically" included in the new vibe-coded app slop they create in 2 weeks. For 1 broker. For 1 file format.
Fine for your first 100 trades when you're learning what matters. A full-time unpaid job after that. Your time has value - stop being your own data entry clerk.
How TradesViz Compares
- In-house dev team (Skillsets: Math/ML/AI/DS, Trading & Research) and daily live chat support with average TAT of 24 hrs via email & minutes via live chat.
- New, useful features and integrations every few weeks (going strong since 2020).
- Highest satisfaction rates among traders willing to learn.
- Costs $0.50 a day.
Remember: Nothing is truly free. Quality software needs a talented team that can provide reliable support - not for weeks or months, but for Years.
Anyways, our question is, how much do you value your time?... Should be a simple answer (we hope..).
The Legacy Stagnator
These are the tools that have been around since the mid-2010s. They've survived on brand inertia and SEO legacy. The question isn't whether they were good in 2017. The question is whether they've done anything since.
Let's look at the evidence:
- One tool launched a web-version in 2024.
- Another one *just* introduced interactive TradingView charts. (TradesViz did this in 2021)
- Some of these don't even have full options support (i.e "working on them"). (TradesViz has had full support since 2020)
- "Latest AI" technology gets you a canned paragraph that says you perform better on certain days. (TradesViz introduced AI Q&A in 2023)
- One of these platforms *just* launched a way to view your executions/orders separately. (TradesViz introduced multi-view tables in 2020 & more in 2022)
The Options Black Hole: These tools can import your options trades. That's where the story ends. No automated Greeks generation. No spread auto-detection. No intraday options charts. No options flow data. No options payoff visualization. No options chain simulator. They log the P&L. They don't tell you what patterns/combinations of Greeks your trades had during different periods of the year and how that correlated to your profits. That distinction is the difference between a journal and an analytics engine.
Stability is not a strategy. If your tool hasn't evolved, your analysis hasn't either. You're bringing 2018's insights to 2026's markets.
How TradesViz Compares
- Continuous updates since 2020.
- Complete re-work of UI and backend systems is done periodically.
- Not just a journal - we're also improving the quality and availability of data for scanning, screening, idea generation, and more.
- All device support - Updated mobile app, constantly re-evaluating responsiveness on touch devices.
- All major feature updates are public. Check here, here, and here for examples. We even update individual blog posts.
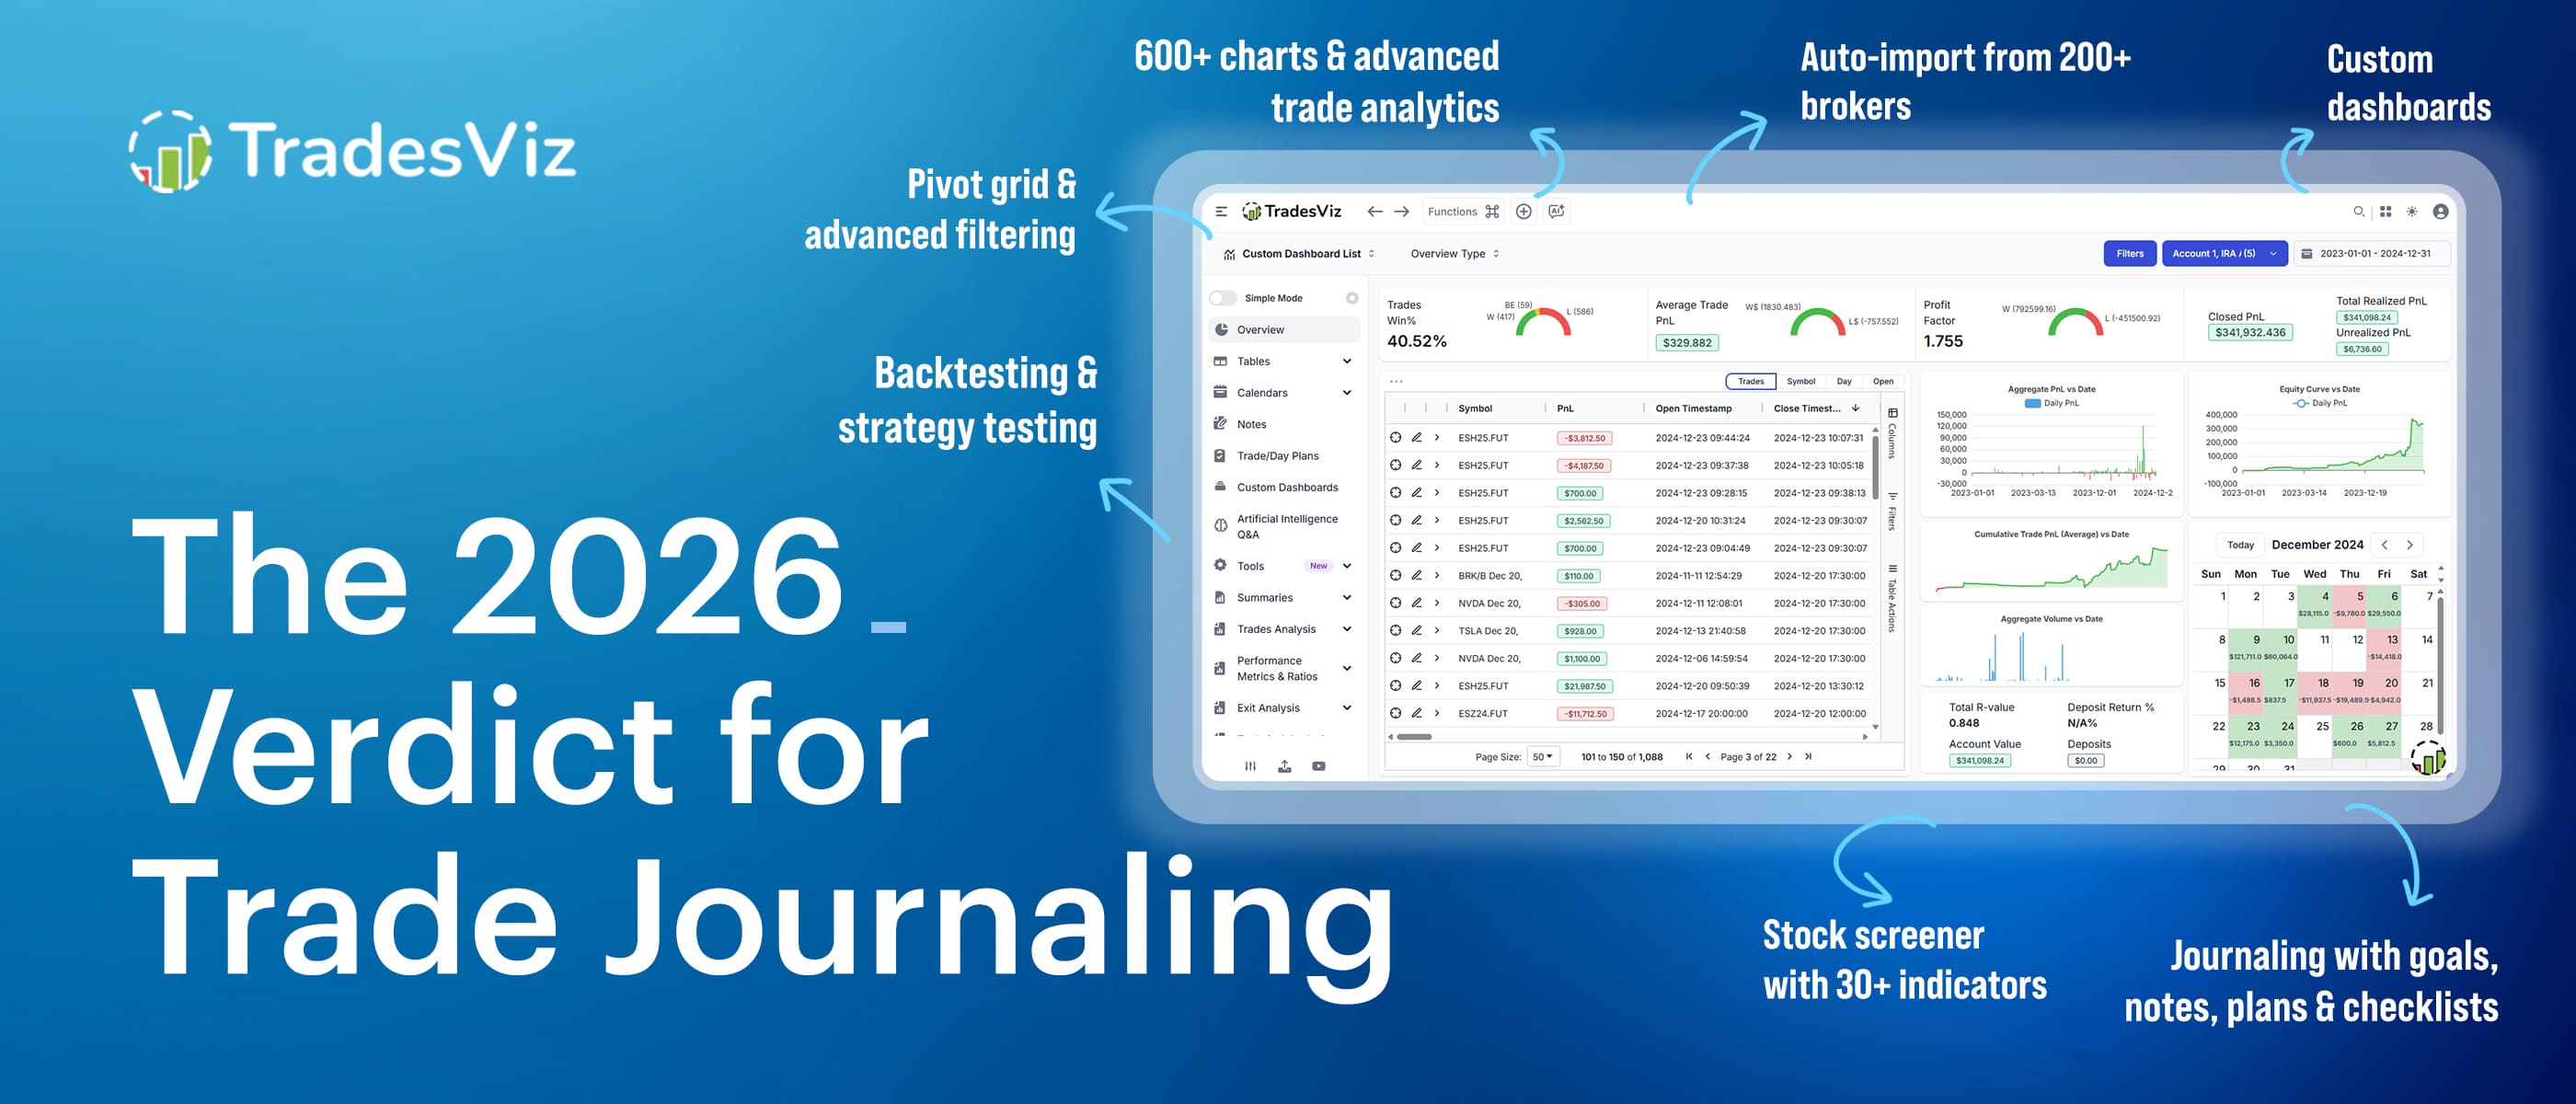
The 2026 Professional Standard - 6 "Must-Have" Criteria
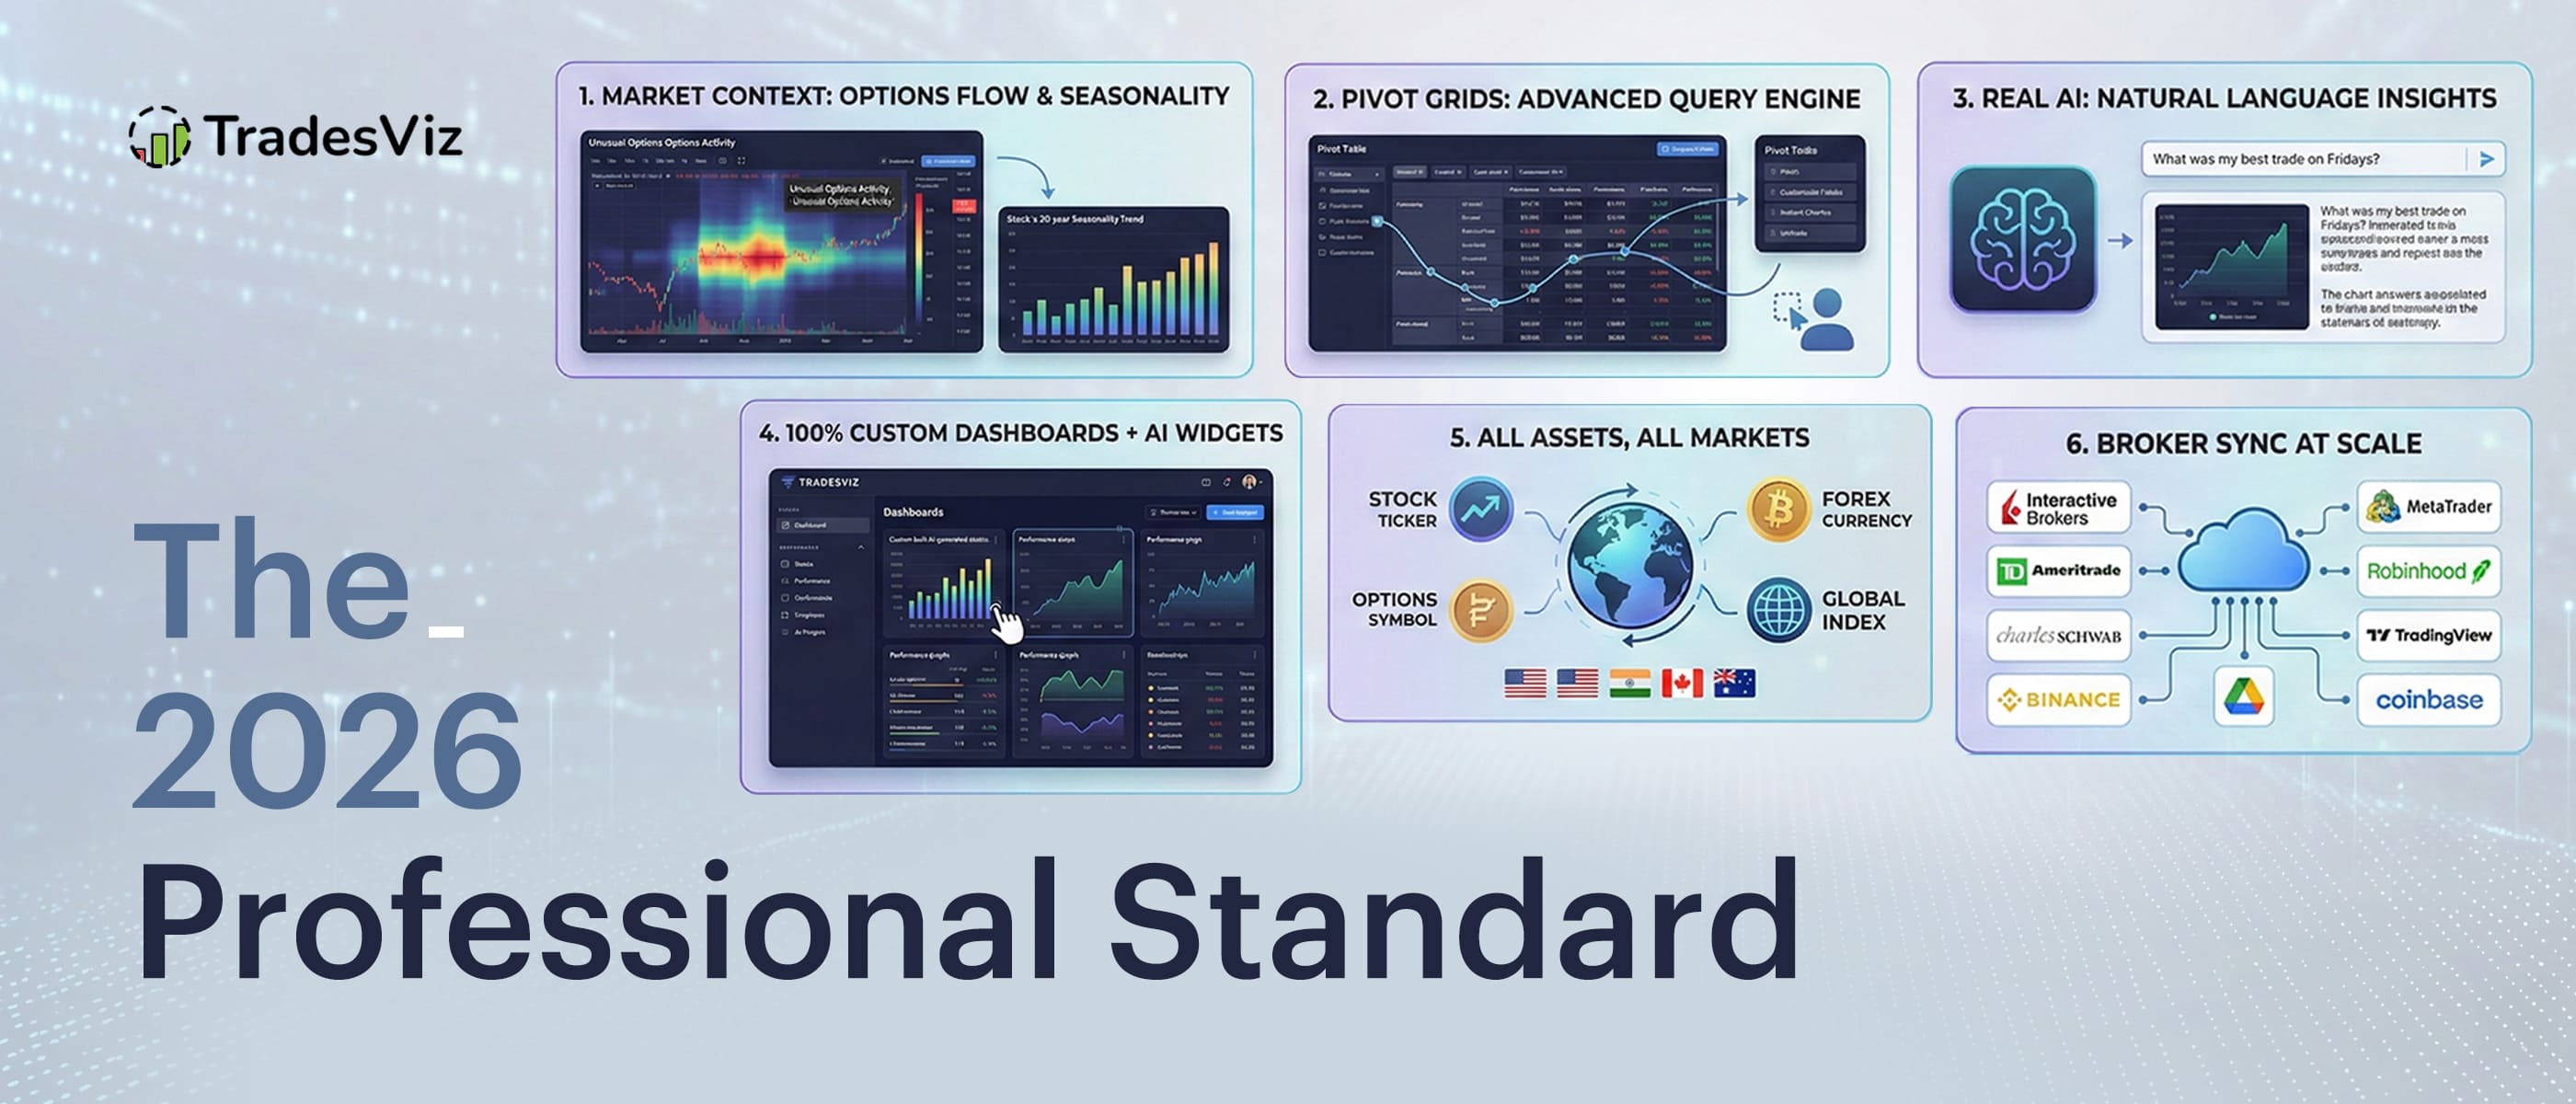
If the Vibe Apps, Spreadsheets, and Legacy Tools are structurally flawed, what defines a professional-grade tool in 2026? The answer: Data Density, Contextual Integration, Global Reach, and Automation. A professional journal must do more than record. It must reveal. Here are the six criteria that disqualify every other journaling platform.
1. Market Context: Screener + Options Flow + Seasonality
 |
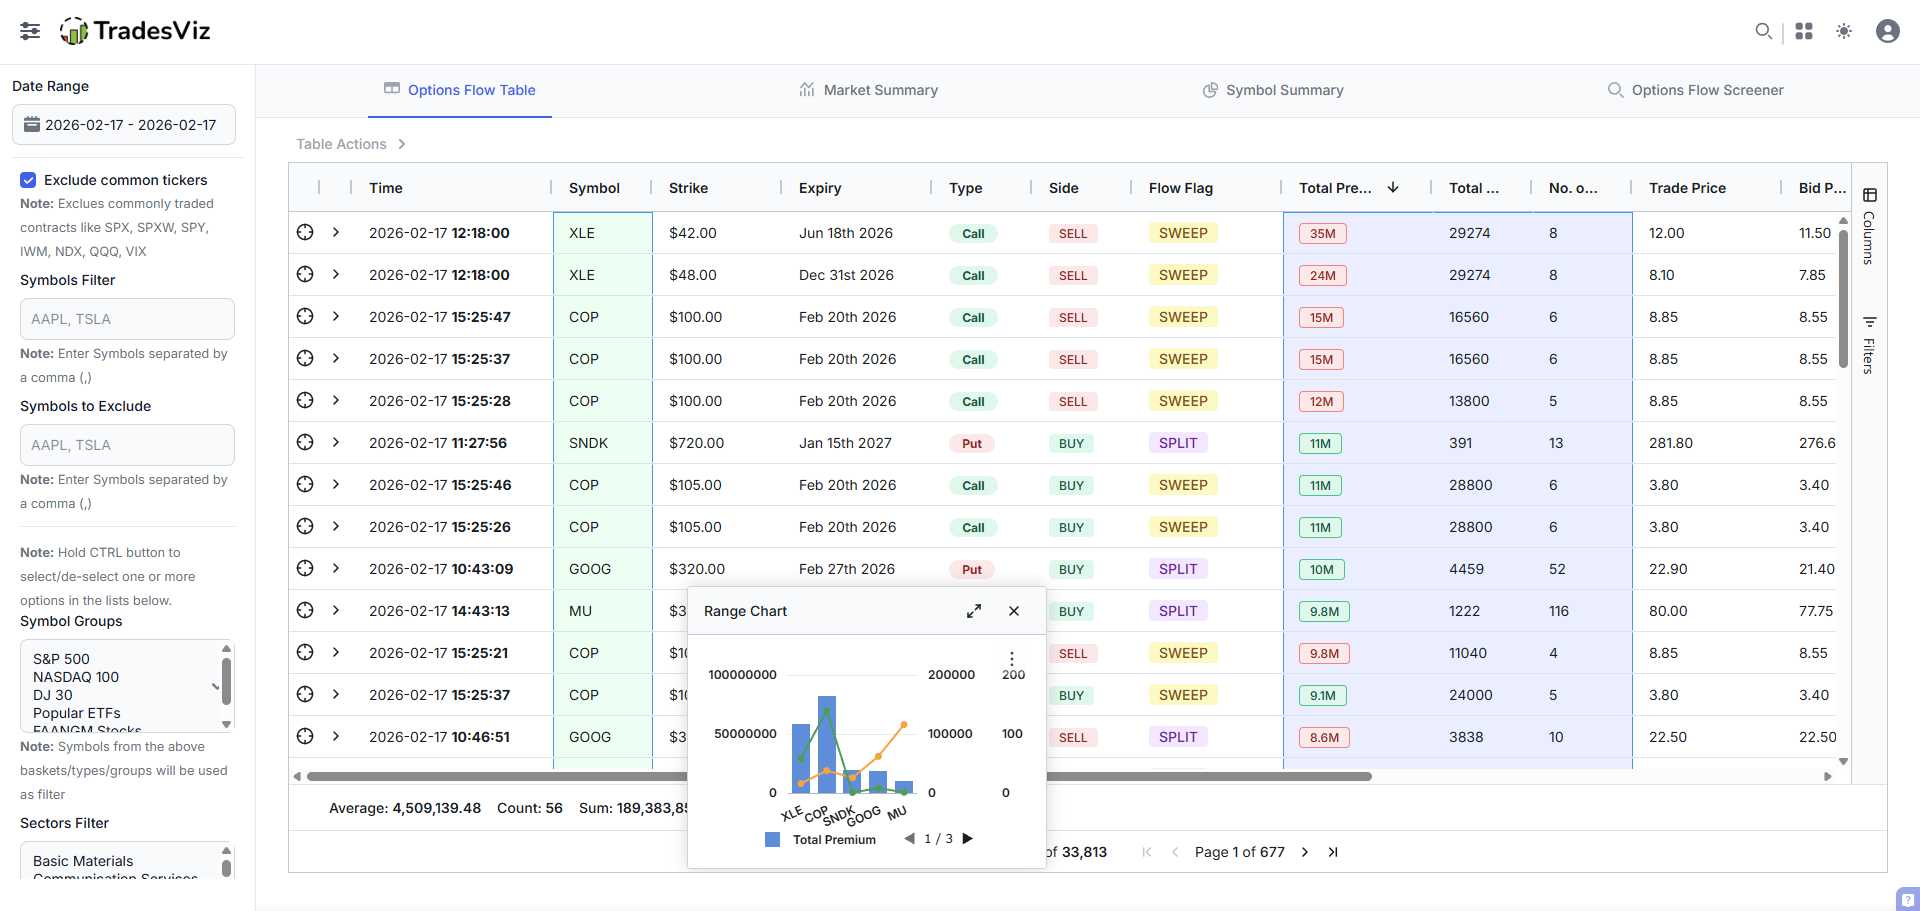 |
Your trade log says "Long AAPL, Loss." It doesn't say "Institutional flow was aggressively bearish" or "AAPL has underperformed this week for 15 of the last 20 years." Without context, your data is noise.
Every other journal expects you to buy a separate flow tool ($100/month) and a separate seasonality site. Cross-reference manually. Lose the thread.
Options Flow in TradesViz: TradesViz doesn't rely on a third-party vendor. It parses every single option trade from OPRA using proprietary algorithms to determine unusual options flow from tens of millions of data points daily.
Heatmaps show which strikes and expiries have been accumulating activity over time.
20+ unique filters, historical data since 2021, 30+ charts and tables per symbol, and the world's first integrated options flow trend screener.
You don't need a separate subscription. It's inside your journal.
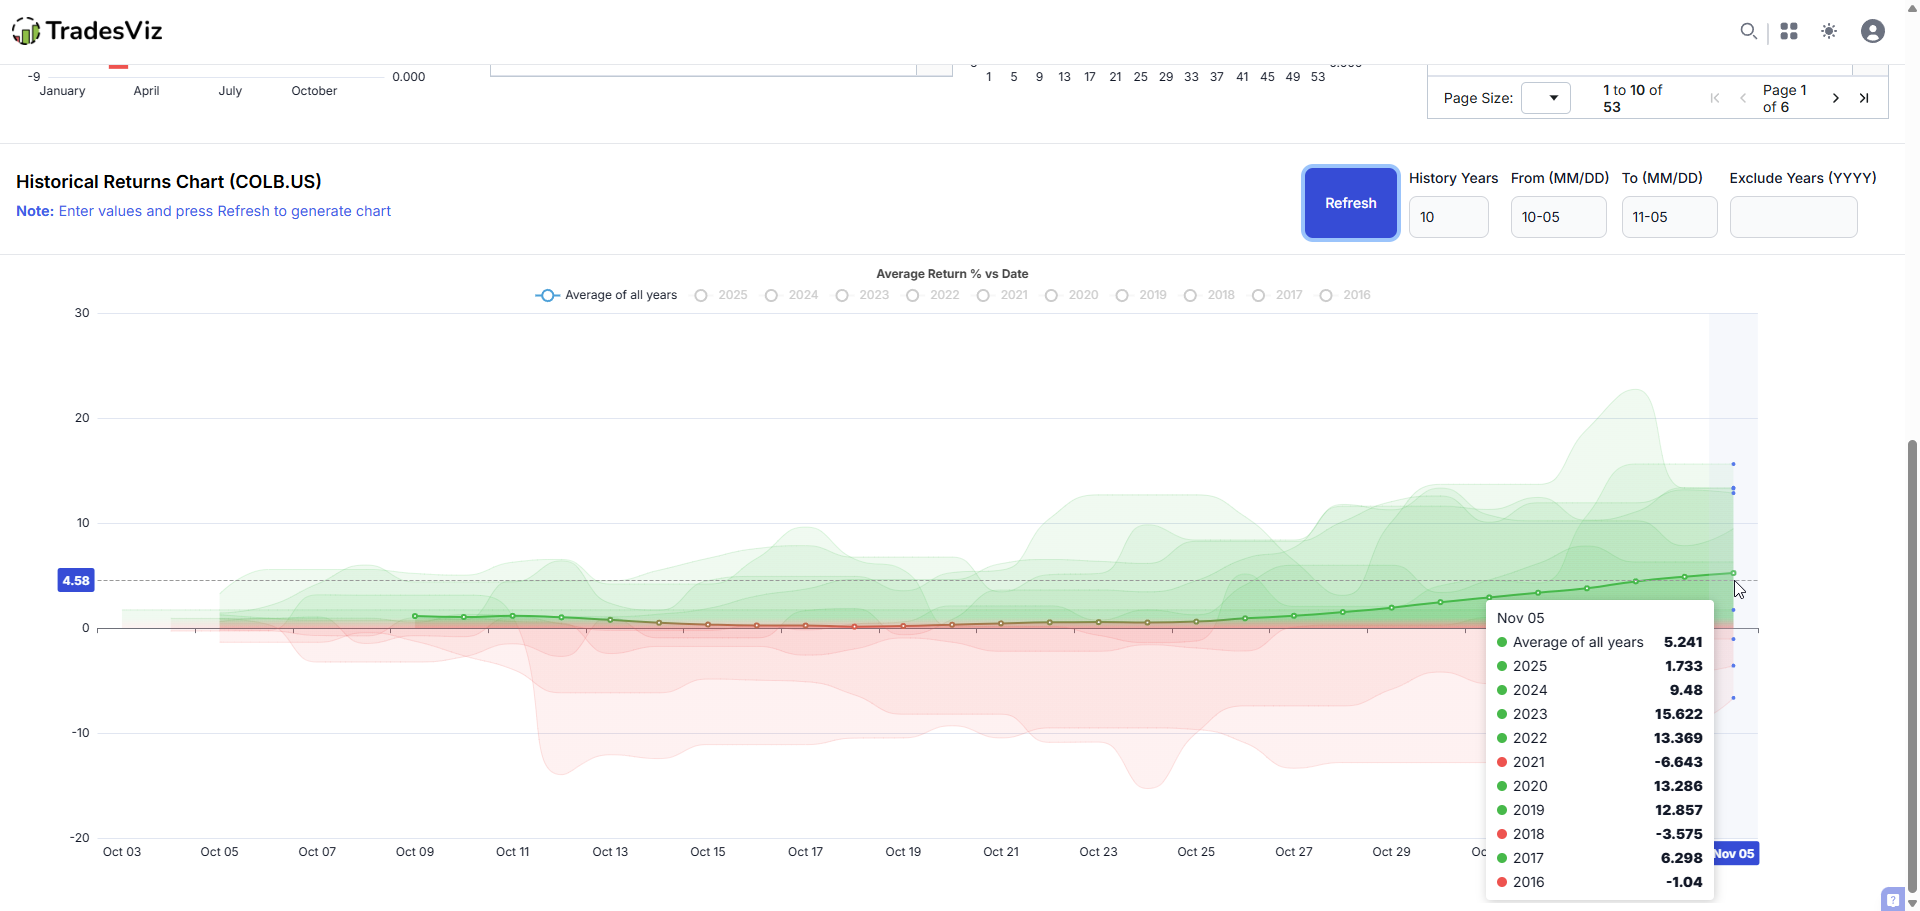
Seasonality in TradesViz: TradesViz is the first trading journal to have seasonality for over 20,000 symbols - introduced in Q1 2022.
Five types of seasonality charts: yearly returns, quarterly returns, monthly returns, week-of-year returns, and historical trends for any custom calendar period.
Seasonality Portfolios let you build a list of tickers where each ticker can be designated a long or short position, and visualize the seasonality of the entire portfolio.
Daily stock screener gives you clear results on what you need to add to your watchlist - every.single.day. Choose from 20+ unique screeners.
Competitor status: Zero options flow. Zero seasonality. Zero assistive tools.
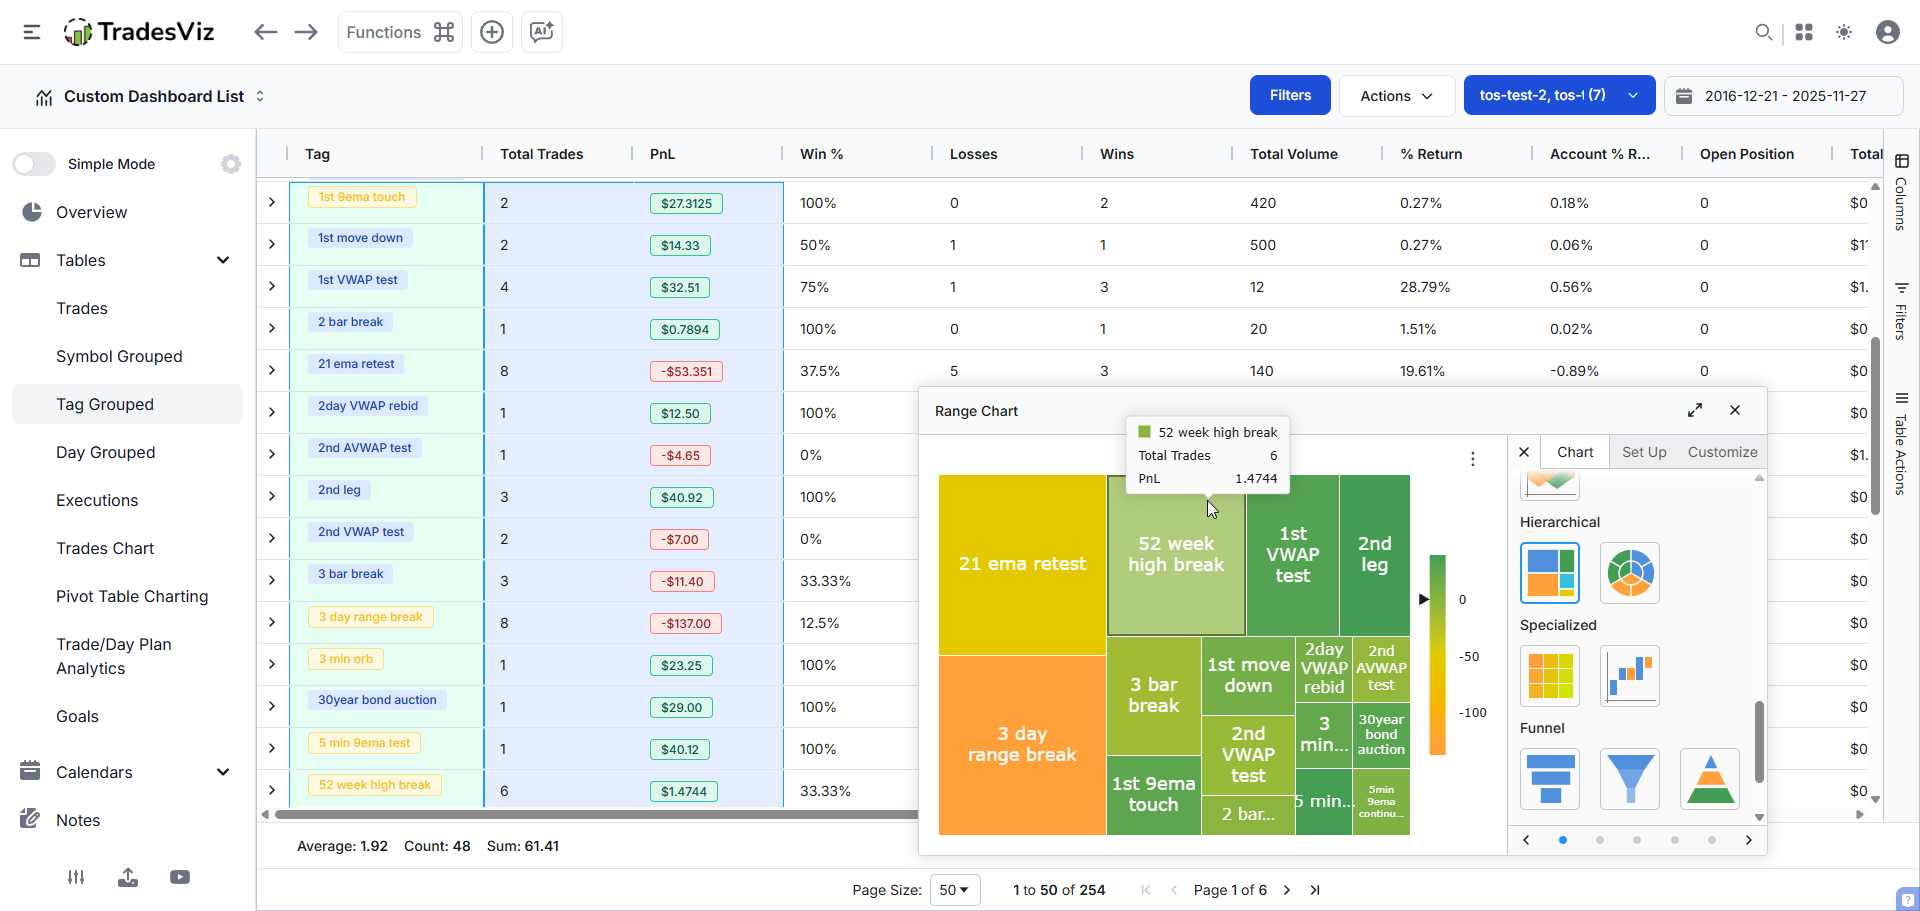
2. Pivot Grids: The Query Engine That Replaces Excel
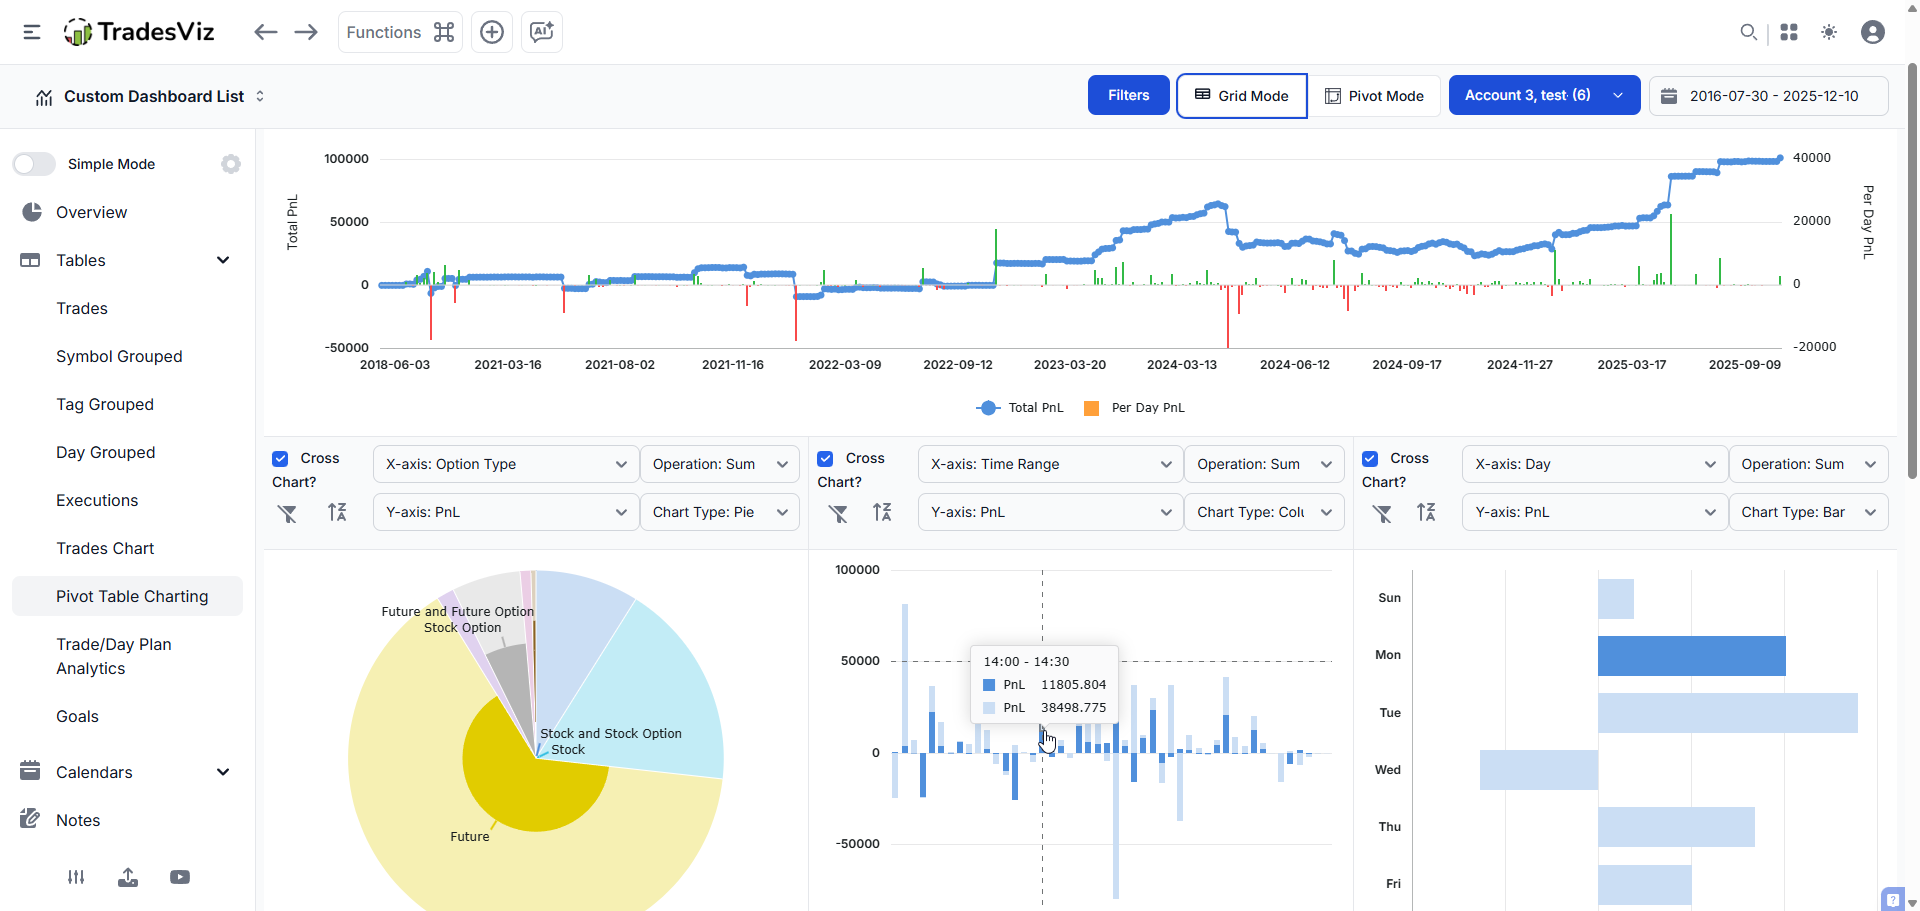
"Win Rate by Day" is surface-level. Professionals ask: "Win Rate on Longs, when VIX > 20, Duration < 5 mins, Sector is Tech?" No fixed chart answers that.
TradesViz built an all-in-one pivot grid where any column or data can be visualized and explored intuitively. Potential combinations of metrics: 600+.
You have 90 columns in this grid. You can group, chart, and visualize every aspect of your trading.
What makes it different from a basic table:
- Instant charting from any cell selection. Click and drag to select any cells, right click, chart range, and choose any chart type you want.
Waterfall, heatmap, funnel, radial, treemap - all from your pivot data.
- Custom calculated columns. It is now possible to utilize all of your numeric inputs as a formula or expression to derive/calculate 100% custom metrics.
Build your own R-value, custom risk ratios, anything.
- Zero-lag at scale. No lag when you turn pages. 100 rows or 1,000,000 rows? No problem.
- State persistence. Every filter, column order, sort, and chart saves to your profile. Open TradesViz on any device, see your exact setup.
This tab in itself is a complete analytics powerhouse. This tab and its features ALONE have more features, visualizations, and analysis capability than ENTIRE competing journaling products available online.
Competitor status: No other trading journal has pivot functionality. They give you 5-10 fixed charts.
3. Real AI: Four Systems, Not a Chatbot Skin
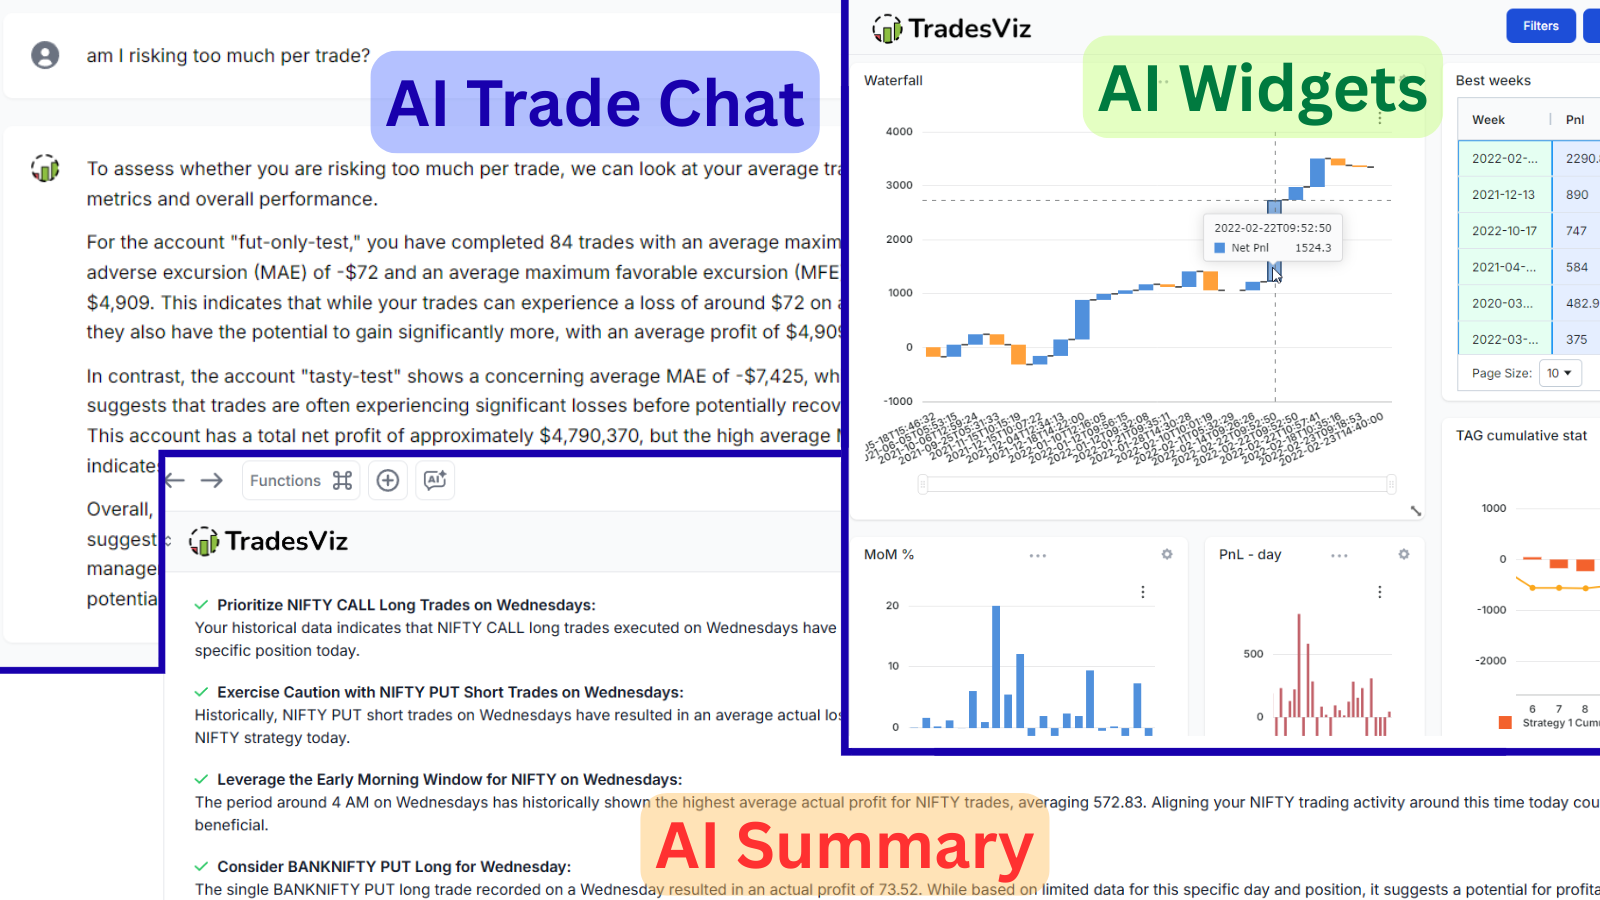
Every journal stamps "AI-powered" on their marketing. Most are lying. Here's what real AI looks like:
AI Q&A: Uses the state-of-the-art AI models to convert your natural language questions into database queries. You type 'What was my best trade on Fridays?' and the system automatically generates charts and tables with the answer.
Your data remains completely secure. The journal only uses AI to translate your query - no actual trading data is ever shared outside TradesViz.
AI Notes: Uses a combination of your trading data, market context data, and technical analysis data to generate notes that summarize your trade's performance, including comments on relevant technical analysis - ALL automatically.
AI Chat: An unstructured, conversational interface for open-ended discussions about your trades. Unlike AI Q&A, which handles structured queries, AI Chat can answer subjective questions and maintain conversation context.
Two specialized agents: the Trade Agent (optimized for your trading data) and the Support Agent (platform knowledge).
AI Fundamentals Q&A: Query company fundamentals using natural language and receive visual results - quickly analyze EBITDA, net earnings, research expenses, and float for any symbol.
Every AI Q&A result can be pinned as a permanent widget on your custom dashboard.
Competitor "AI": 5 messages/day or a canned paragraph. No real database querying.
4. 100% Custom Dashboards + AI Widgets
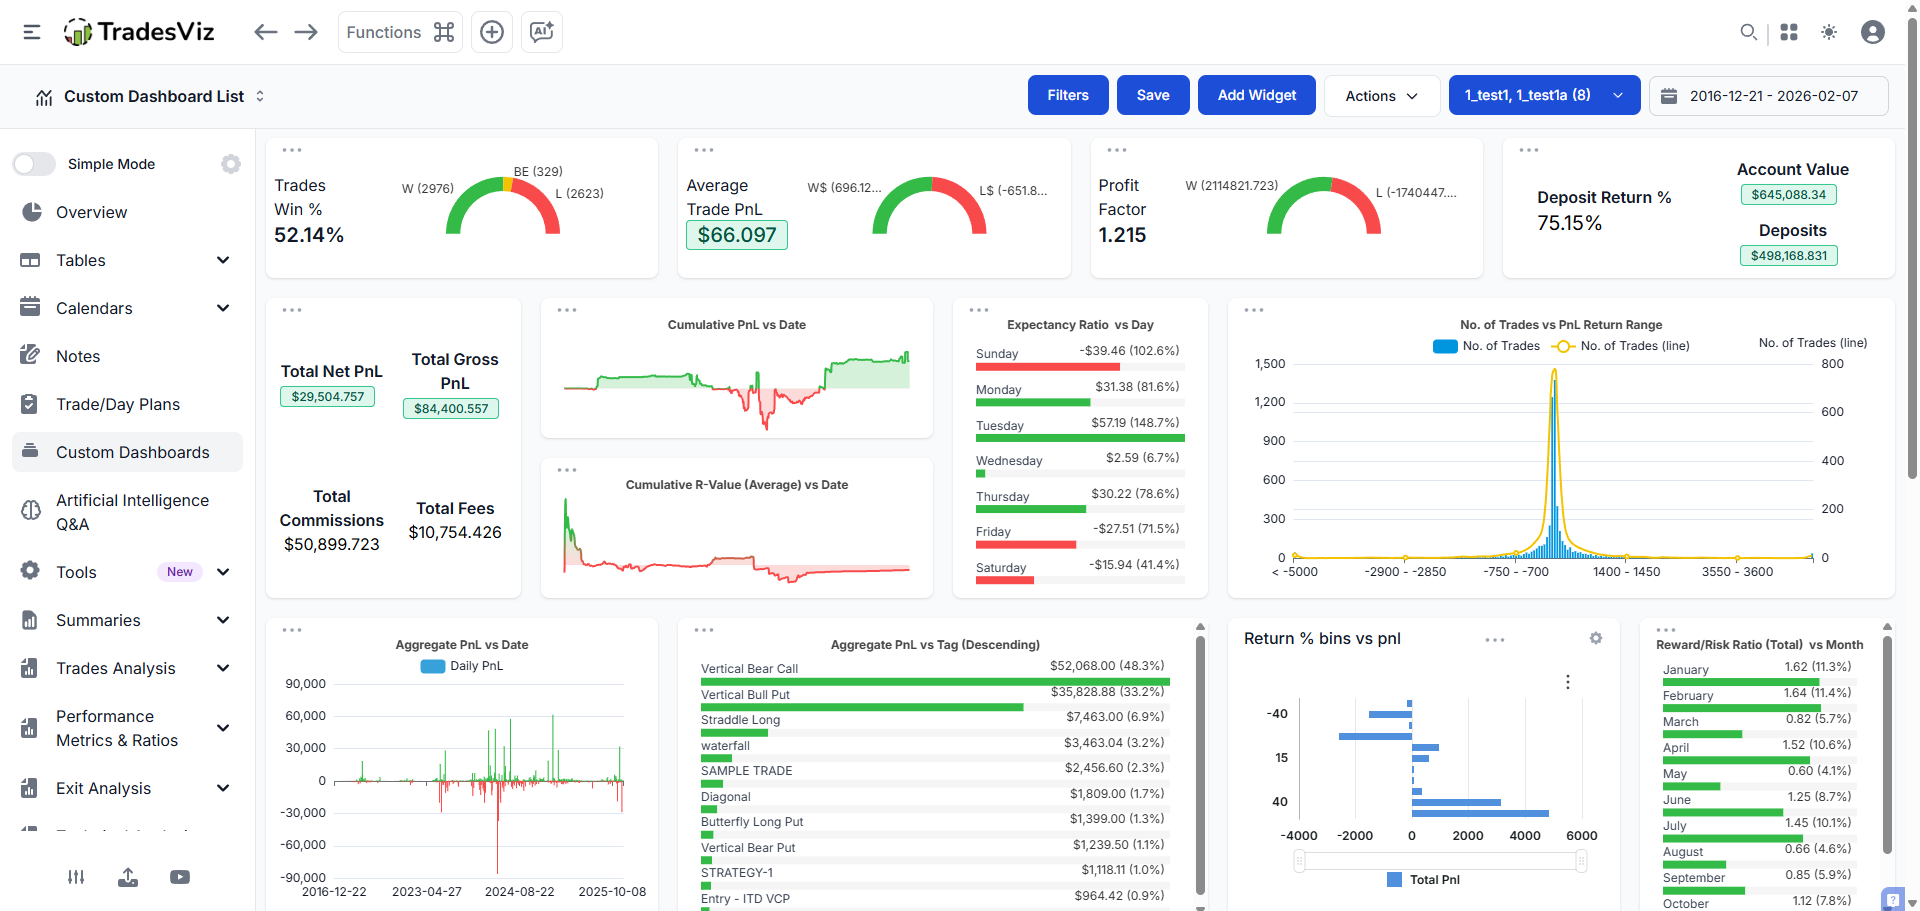 |
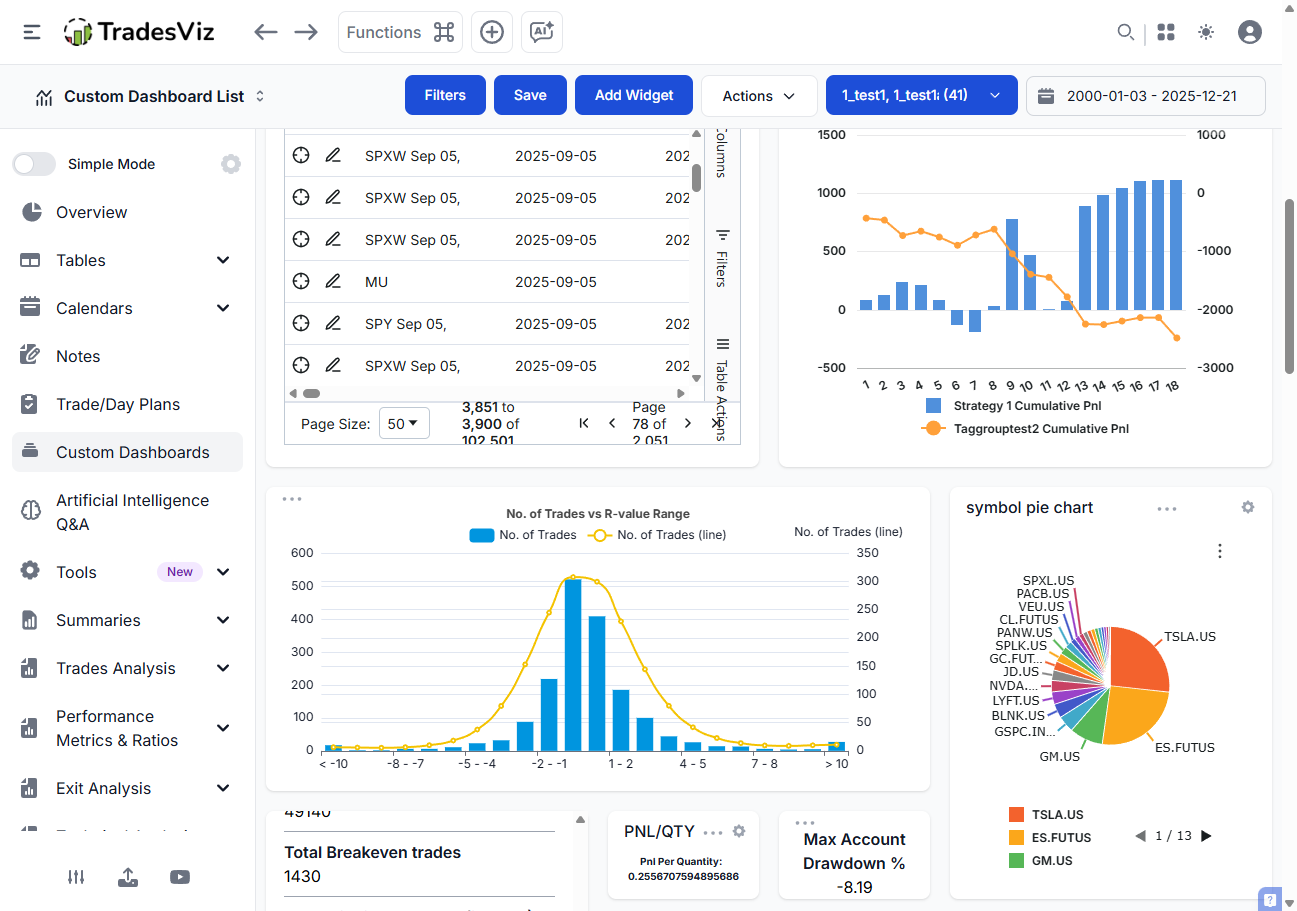 |
"Choose from 3 templates" is not customization.
TradesViz was the first trading journal to offer 100% customizable dashboards with over 600 widgets.
Select from hundreds of widgets, including charts, statistics, and tables. Each widget can be resized, moved, and configured individually. Dashboards support drag-and-drop construction. Multiple dashboards can be created for different analysis purposes. Users can clone existing dashboards to create variations quickly.
Any custom dashboard can be set as the homepage for immediate access upon login.
The real differentiator - AI Widgets:
With the introduction of AI Q&A, users requested custom statistics generated by AI to be added as widgets, and TradesViz introduced AI widgets and charts, unlocking a new level of customization. This means users can create 100% custom, personalized statistics (ones that do not exist at all as a chart on TradesViz) using AI and add that to the custom dashboard.
The formula: 600 pre-built widgets + infinite AI-generated widgets = a dashboard uniquely yours.
Competitor status: Most don't have a custom dashboard, let alone AI widgets.
5. All Assets, All Markets - First-Class Citizens
Most journals were built for US equities. Options were bolted on. Futures are barely supported. Non-US traders are invisible.
Multi-Asset: TradesViz is the only trading journal in the world to have dedicated features for options traders - including options simulation, greeks analysis, intraday options charts - most of which are NOT available anywhere else.
The first and only trading journal to provide automated greeks generation for each option leg (delta, theta, rho, vega, gamma and DTE, IV).
Spreads are auto-tagged - analyze performance by strategy type, including iron condors, verticals, straddles, and more.
The world's first and only online options chain simulator.
The trading simulator covers 15,000+ tickers across six asset classes - stocks from four countries, 50+ futures contracts, all US stock options, 80+ forex pairs, 2,000+ cryptocurrencies, and 100+ global indices.
Multi-Country: TradesViz officially supports US, India, Canada, and Australian exchanges with OHLC data. You can import trades from any exchange in any supported format.
Earnings data for the United States, India, Canada, and Australia, filterable by country code.
MOST features you see on TradesViz are asset-type agonistic - meaning, they work equally well for all asset classes.
All major currencies and timezones supported, with automatic currency conversion.
Competitor status: One Vibe App charges $288+ with no free trial before you can even test if their options import works. One legacy tool has been working on "options integration" since 2023 and still hasn't shipped. TradesViz shipped full options analytics in 2020.
6. Broker Sync That Actually Works - At Scale
Most journals have "some" sync. The real questions: How many brokers? How many sync methods? How customizable is the import pipeline?
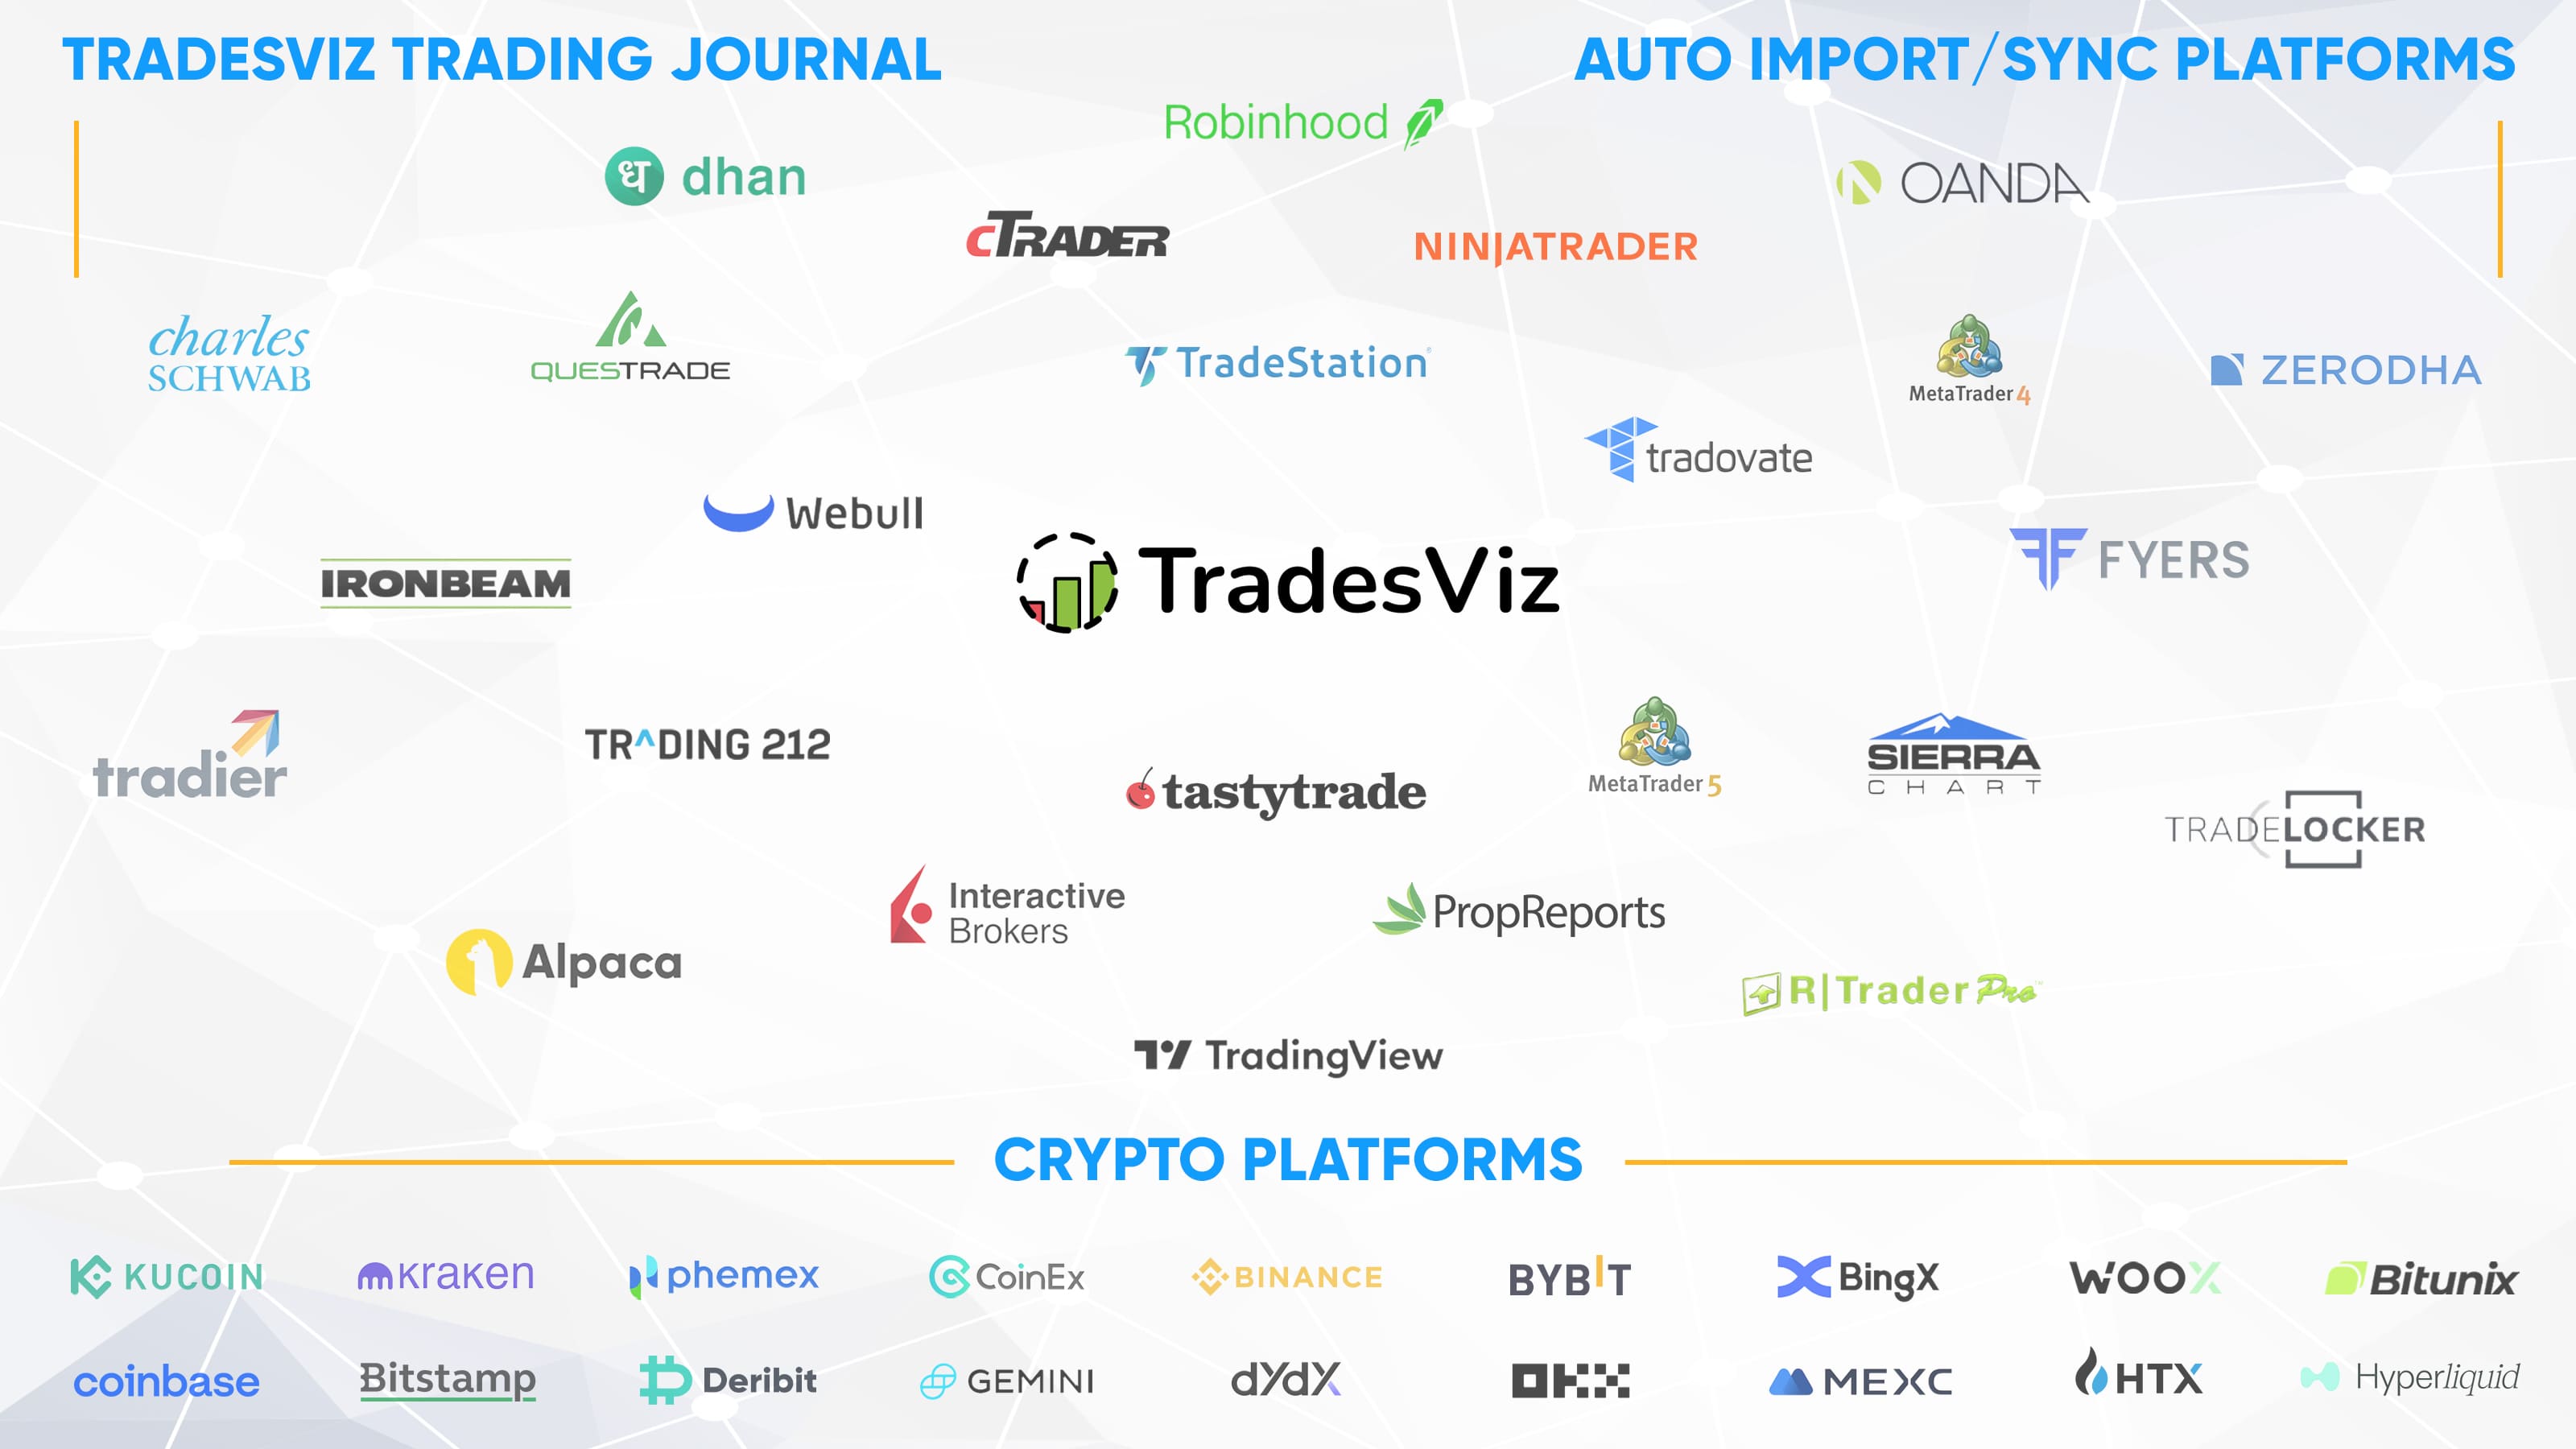
TradesViz supports auto-sync and manual import from 200+ brokers and platforms.
Auto-import from over 40 platforms, including Interactive Brokers, Tradestation, Robinhood, MetaTrader, TradingView, Charles Schwab, Binance, and Coinbase.
The depth underneath the numbers:
- FTP sync, real-time sync, and broker-based connection sync: the only platform in the world to offer all three unique kinds of sync for MT5 users.
- Real-time sync sends trades to TradesViz as and when you make an execution - available for NinjaTrader, MetaTrader 5, and SierraChart.
- A Google Drive integration that works with any broker or platform: A universal solution that enables auto-sync even from brokers not directly supported.
- Due to high demand and despite TradingView not having an API, TradesViz built a browser extension to sync your TradingView trades.
- Auto-detects 30+ options strategies, including spreads, iron condors, and butterflies - trades automatically tagged with the detected strategy.
- Advanced target profiles solve the problem of missing stop loss and profit target data - set granular per-symbol-level profiles and apply immediately to all trades without re-importing.
Recent additions include HTX, Trading212, Bitunix, Woox, and Hyperliquid, along with improved integrations for Webull, IBKR, MT5, Tastyworks, Schwab, and many others.
Competitor status: One Vibe App has recurring Reddit complaints about trades not appearing after sync. Another legacy tool only added MT4/MT5 sync in January 2024. No other journal has Google Drive universal sync, TradingView browser extension, or auto-detection of 30+ options strategies on import.
The "Data Density" Comparison
| Feature | "Vibe" App | Spreadsheet | Legacy Tool | TradesViz |
|---|---|---|---|---|
| Options Flow | ❌ | ❌ | ❌ | ✅ OPRA, 20+ filters, screener |
| Seasonality | ❌ | ❌ | ❌ | ✅ 20+ yrs, 20K+ symbols, ports |
| Pivot Grids | ❌ | DIY | ❌ | ✅ 90+ data points, 600+ combos |
| AI Q&A (NL→Data) | 5 msgs/day | ❌ | Canned paragraph | ✅ Real queries, 20-30/day |
| AI Notes + Chat | ❌ | ❌ | ❌ | ✅ 4 AI systems |
| Custom Dashboard | 3 templates | DIY | ❌ | ✅ 600+ widgets + AI widgets |
| Options Greeks | ❌ | ❌ | ❌ | ✅ Δ,Θ,Γ,ρ,IV per leg |
| Spread Auto-Detect | ❌ | ❌ | ❌ | ✅ 30+ strategies |
| Options Chain Sim | ❌ | ❌ | ❌ | ✅ World's first |
| Country Support | US only | N/A | Forex/US only | ✅ US, IN, CA, AU + any currency |
| Broker Auto-Sync | Limited | ❌ | Basic | ✅ 40+ auto, 200+ manual, 3 MT5 methods |
| Import Customization | Basic | N/A | Basic | ✅ Commission profiles, advanced grouping |
| Scale | ❓ | ❌ (~500) | ✅ | ✅ 50M+ trades processed |
| Data Export | ❌ (lock-in) | ✅ | Partial | ✅ Full, always |
| Price | $29-49/mo (no trial) | Free | ~$14/mo | Free → $15 → $22 |
TradesViz offers the most feature-rich free tier in the trading journal space. With 3,000 trade executions per month at no cost, it handles more volume than most retail traders need. The platform has processed over 50 million trades for 150,000+ active users. Recognized internationally by the Benzinga FinTech Awards as a finalist in both Best Data Analysis Tool and Best Portfolio Tracker categories.
Who Should Use What: Honest Guidance

Trade < 10 times a month?
A spreadsheet is genuinely fine. You're in learning mode. Save your money.
Trade 50+ times/mo (Single Asset)?
Your broker's metrics are probably fine. Need specific guidance? Get TradesViz Pro. (New user? Use code: TVIZNEWUSER to save).
Trade options, manage multiple accounts, or run 500+ trades/yr?
You need professional infrastructure. Spreadsheets will fail you. Vibe apps will bore you. Legacy tools will stagnate under you. You need TradesViz.
Trade outside the US?
TradesViz supports USA, India, Canada, and Australian exchanges with full market data, earnings calendars, and broker integrations for each.
Institutional or prop?
This isn't even a question. The only question is why you haven't already migrated to TradesViz...
The 2026 Verdict for Trade Journaling
The search results for "best trading journal 2026" are noise. Affiliate plays. Tools built for content, not improvement.
The criteria are clear: real professionals need institutional context, temporal analysis, genuine AI, first-class multi-asset support, global market coverage, and robust automation. Most tools fail at least four of those.
TradesViz was built by engineers who trade, not influencers who (try to) (vibe) code (or just outsource..).
TradesViz is a tool - an engine built for the 1% of traders who treat this as a business. We built the engine because the toys weren't working.
-
We parse tens of millions of OPRA data points daily — so you see what the institutions are doing.
-
We created AI features that encourages to ask questions and learn — so your journal can be your own personal tutor powered by the best AI agents.
-
We were the first journal to offer seasonality for over 20K symbols — so you never trade in a temporal vacuum.
-
We built Pivot Grids with 600+ metric combinations — so you can ask your data questions no other journal can answer.
-
We built the world's first online options chain simulator — so you can practice without risking capital.
-
We implemented real AI-powered natural language querying — not fortune cookies, not canned summaries, but a real query engine.
Our pricing is the lowest in the market for the feature set provided. We don't have fancy animations or UI. We have a professional dashboard that helps you turn your trading from a hobby to a career.
Start with the Free Tier.
Import your last 90 days. In 10 minutes, you'll see more about your trading than your current journal showed you in 10 months.
Start Free on TradesViz →