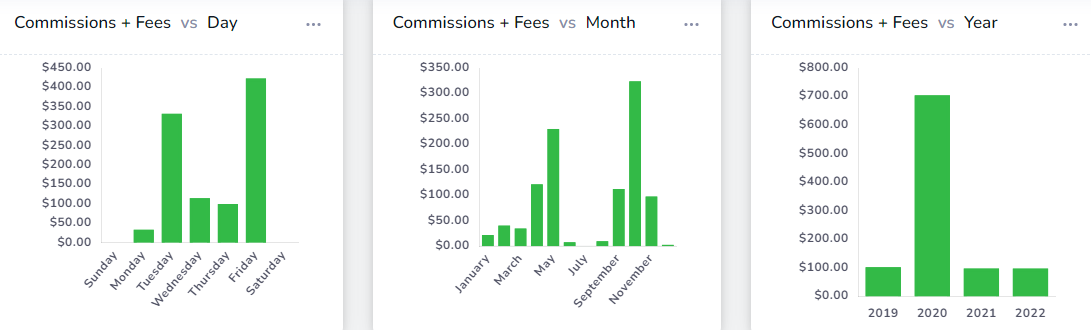
New charts: Commission and fees statistics
Commissions are the new/small account killers. With these charts, you can exactly know where you are spending most of your account's value in commissions and fees and try to reduce it!
Guides, changelogs, deep dives and everything trade journaling.
Commissions are the new/small account killers. With these charts, you can exactly know where you are spending most of your account's value in commissions and fees and try to reduce it!

The popular charts view tab gets an upgrade: you can now switch between the static/image charts & TradingView charts!
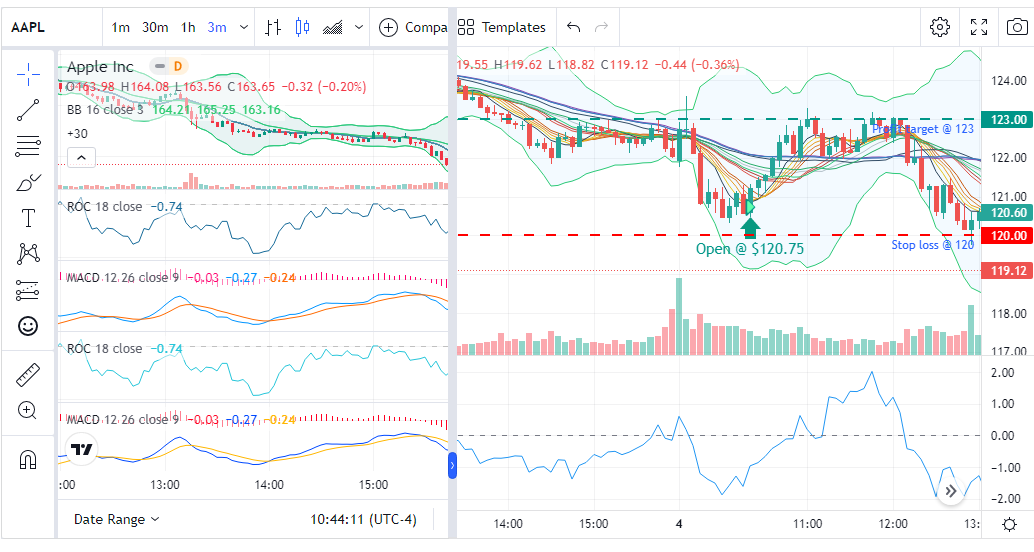
Create a TradingView setup that will be auto-imported/applied to your technical analysis charts whenever you explore any trade.
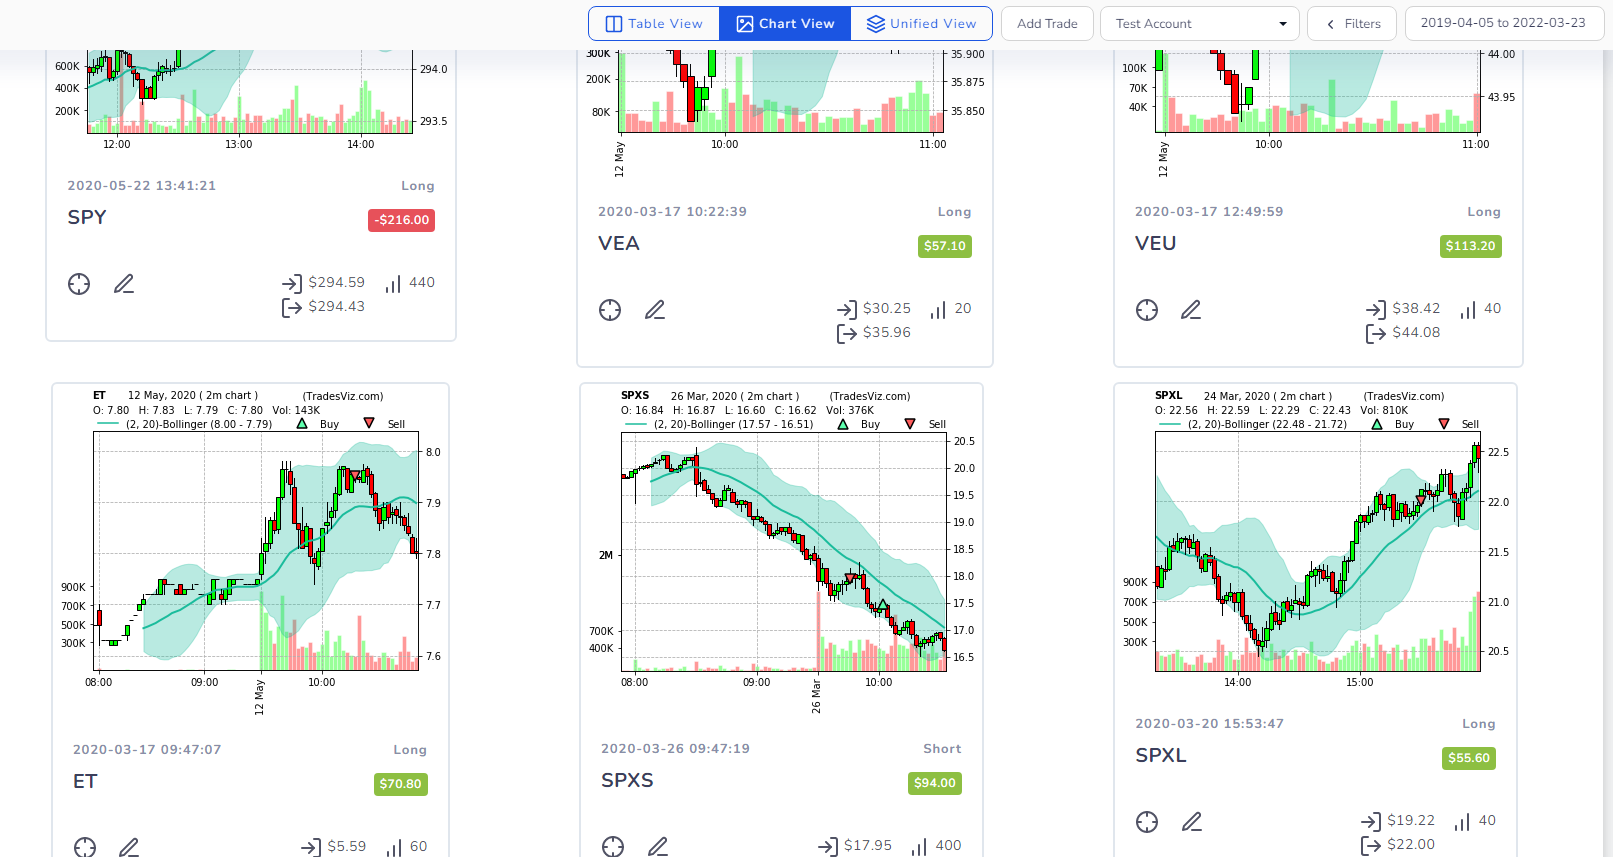
A way to view charts of all your trades in a single page!
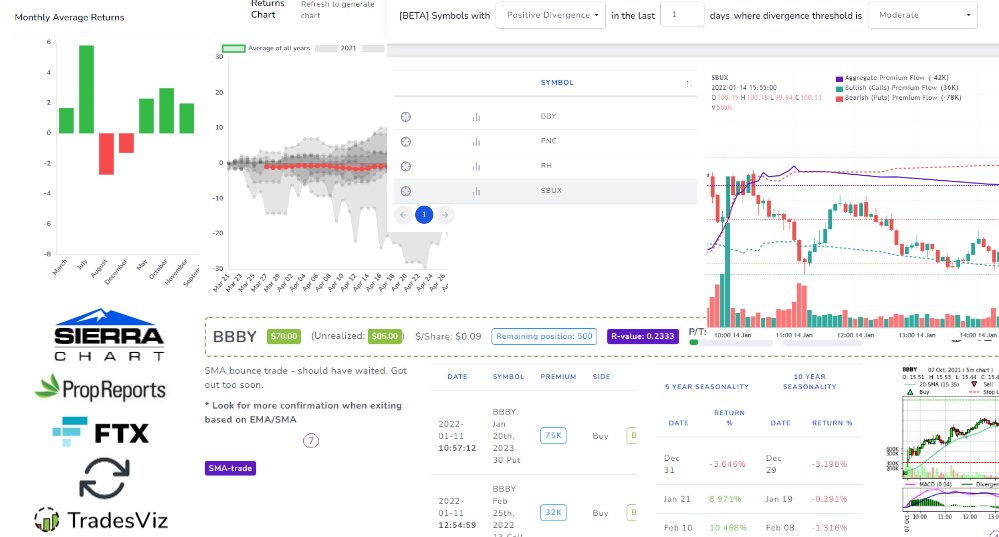
More analysis-based updates to TradesViz. Seasonality analysis, unified view, options scanner, new auto-import platform, and more!
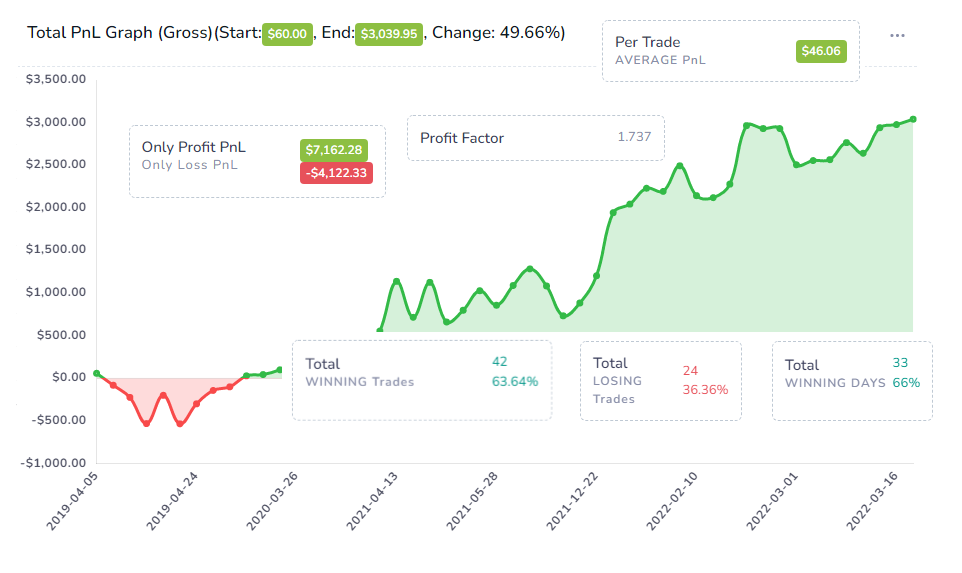
You can now share the entire trading performance of your trading account(s) via a simple public dashboard - choose exactly what data you want to share. It's your data - you have complete control over what you want to share with your fellow traders!
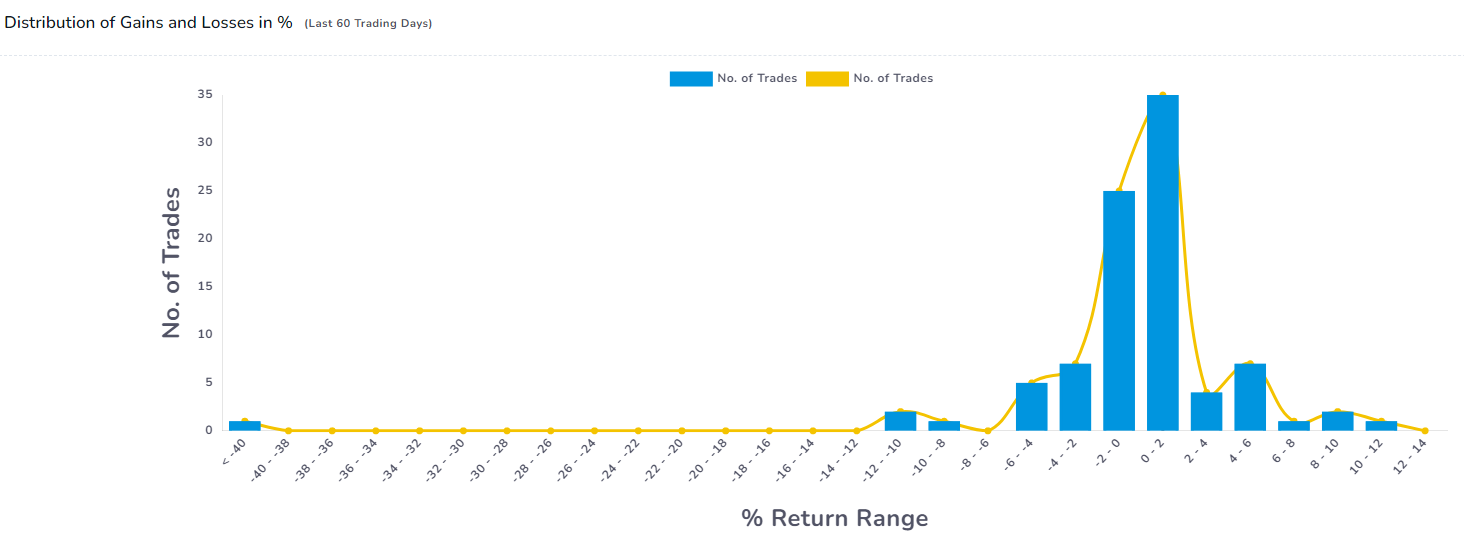
We have a few sets of charts that can help provide more value to your analysis and pinpoint the set of trades that you need to improve - Distribution curves and also DRMA curve.
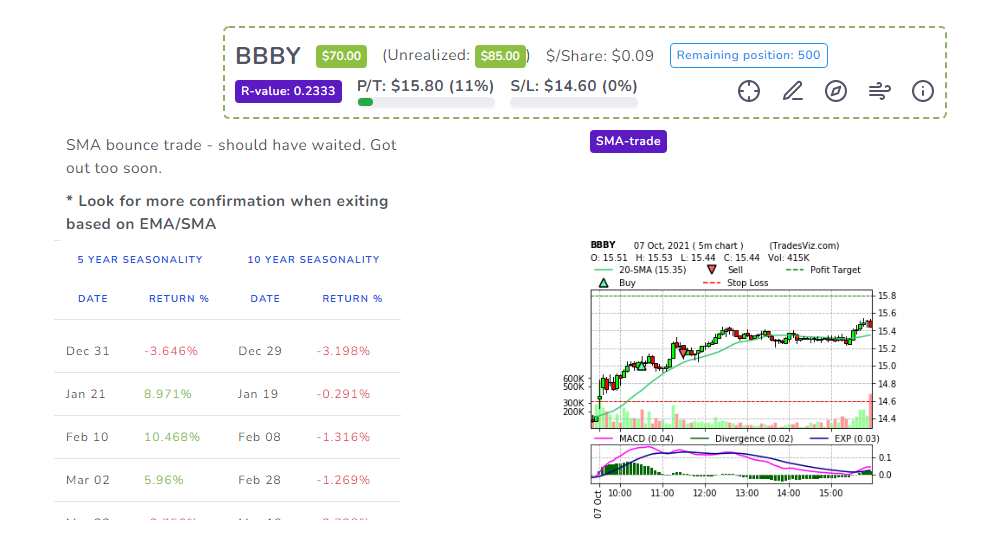
PnL, Unrealized PnL, Risk info, Comments/Tags, Recent options flow, Upcoming seasonality prediction, and more... View all of this in a single tab for all your trades. Use every piece of market info to hone your trading edge and make trading simpler.
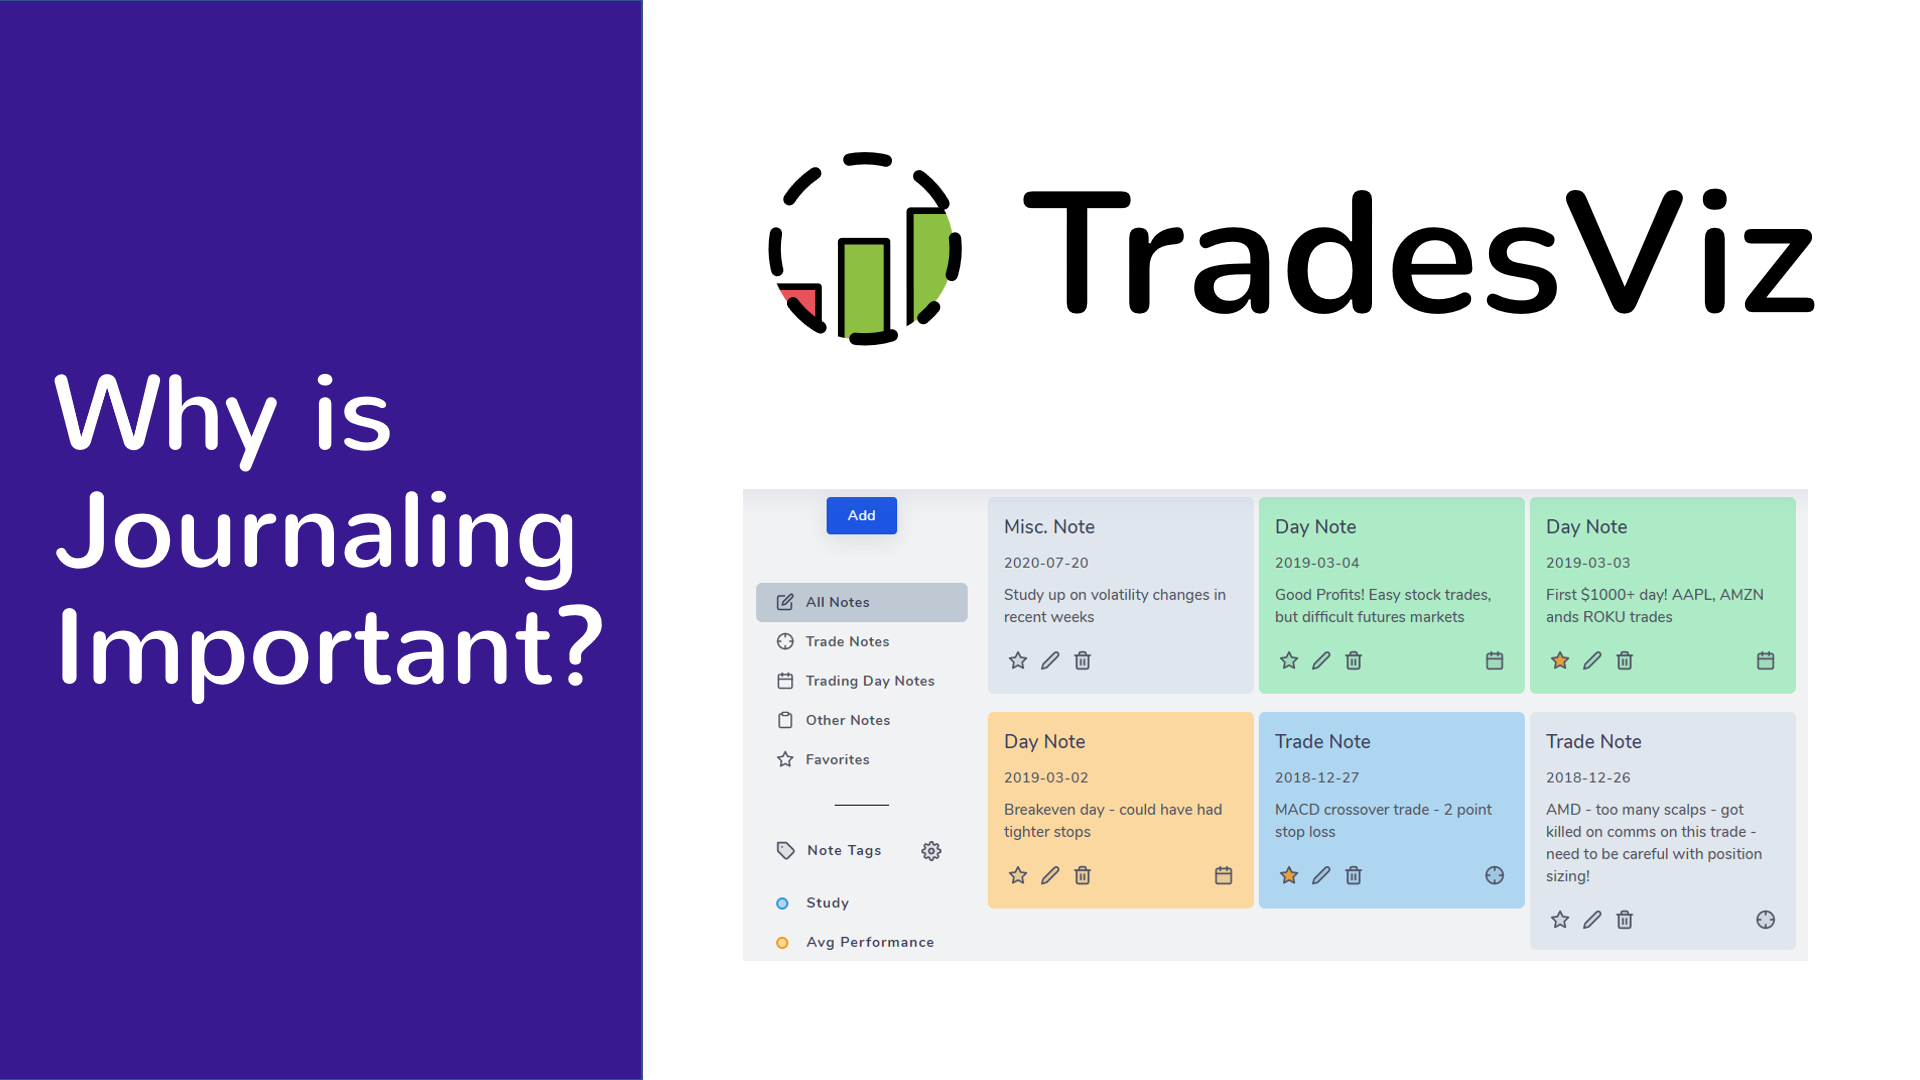
Why even journal your trades? Why should you analyze your trades? How does it help you? All your journaling questions are answered here!
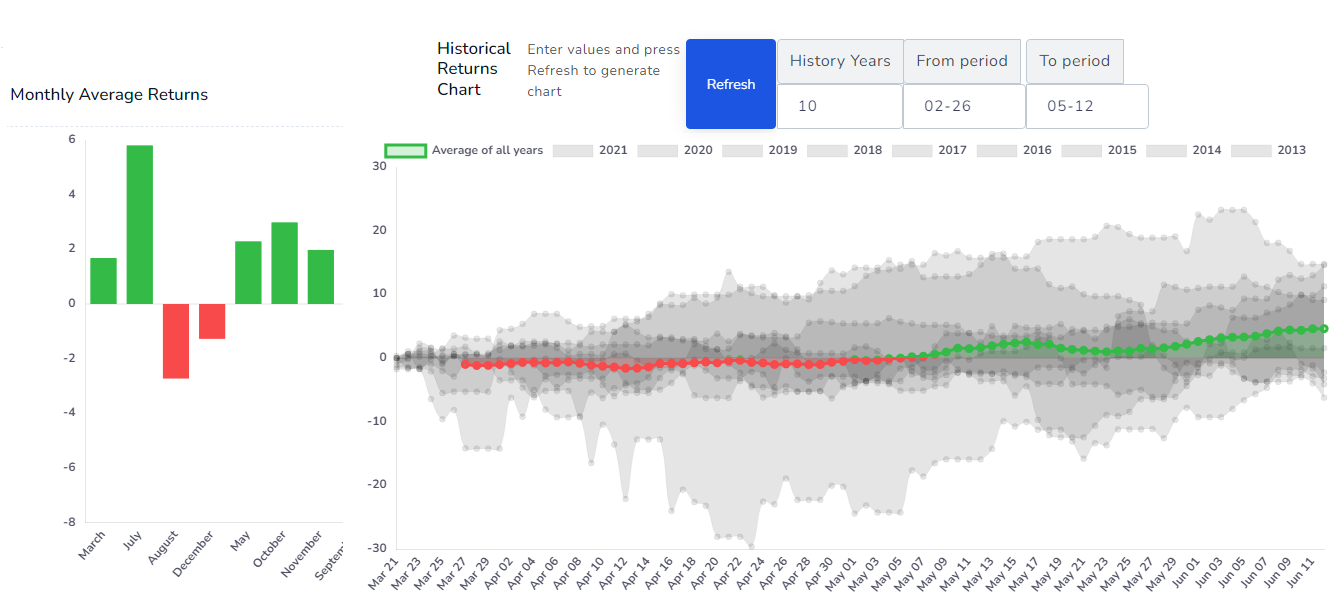
In trading, it is said that history always repeats itself... So, why not use it to our advantage? You can now view seasonality charts for ANY symbol from US, Canada & Indian exchanges on TradesViz to see how the ticker's performance changed historically for any given period.
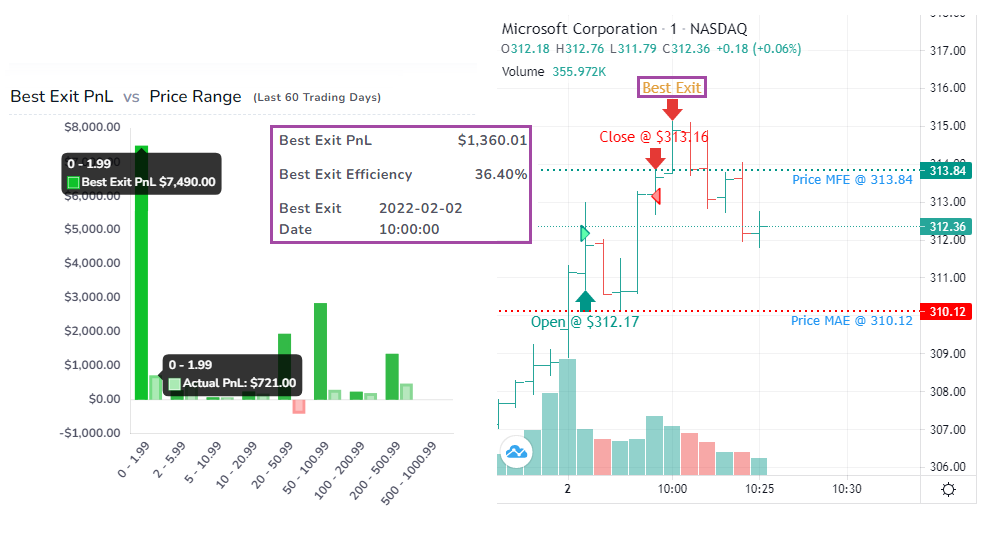
Ever wonder how much money you could have made if you held on to that trade for just a little longer? No need to daydream about it anymore. You can visualize and analyze every single trade's exit efficiency and best exit time to tweak your strategy to maximize your profits.
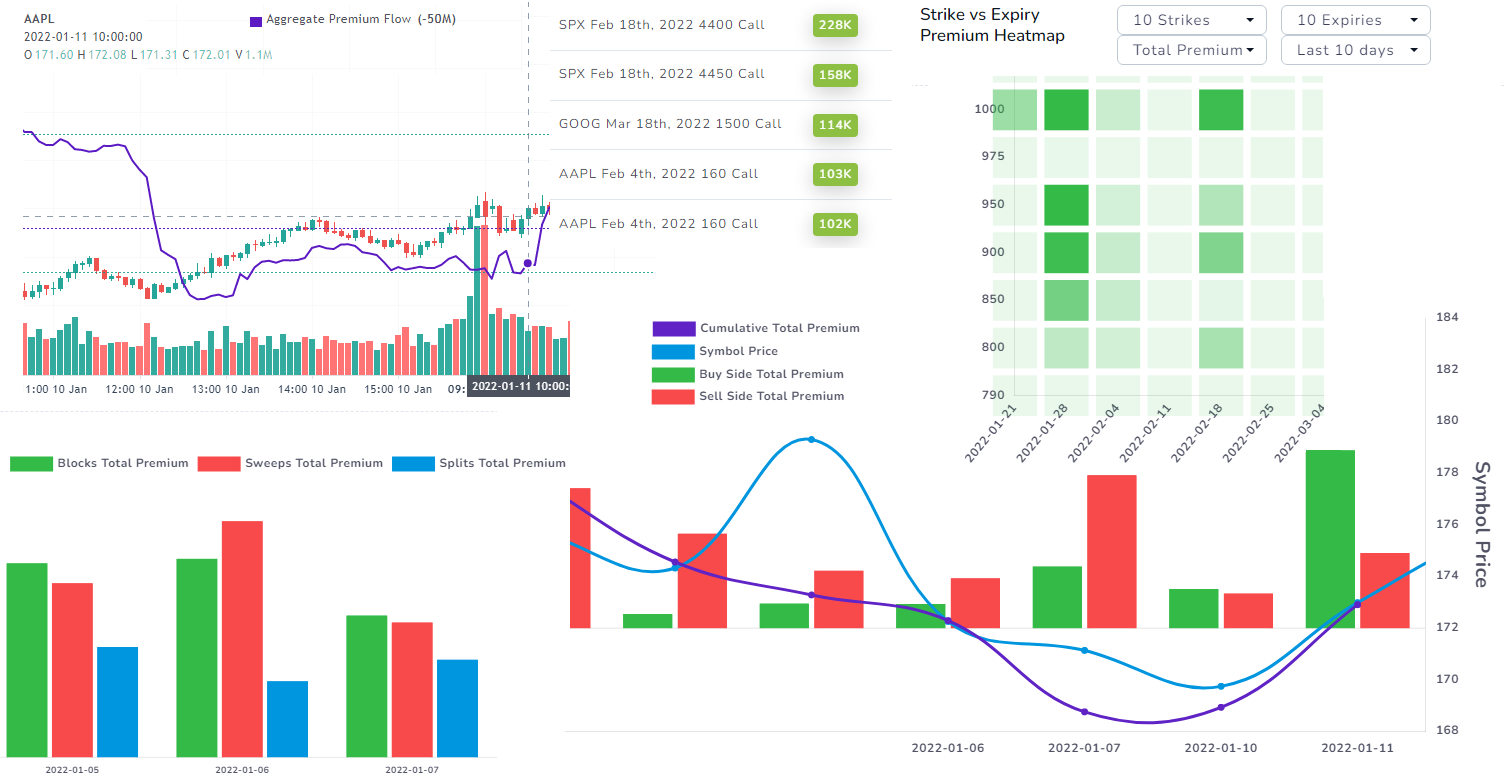
It's finally here: The best options flow dashboard with TRUE market data and all the right visualizations to help you plan your trades and learn more about the market conditions! Use flow analysis in combination with your journaling to get a COMPLETE picture of the market and how you performed.