TradingView has been immensely popular among traders due to its excellent charting platform and the ability to integrate it into multiple tools.
We already have TradingView charts that automatically plot your stops, executions, best exit, etc., A long-standing request of many users have been that they wanted their TradingView charts to be auto-populated with indicators and specific timeframes selected whenever you explore a chart.
On top of the chart already being detailed, with this feature we are going to explore, you are saving time and you have full customizability on how your charts should look.
At the moment, we have a limited no. of frequently used indicators. However, we can add any of the default TradingView indicators based on your request (contact us at [email protected] with your request).
These settings will also apply the "Current" chart that you see in the trade explore view.
In short, this is exactly the "chart profiles" that we have had for our static/image charts, but applied to the TradingView charts!
Let's see how to set this up.
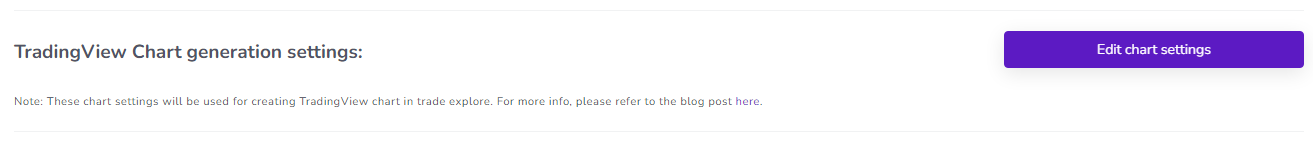
You will find a new button named "Edit chart settings" in the TradingView chart generation settings section on your account settings page:
Once clicked, you will see a popup like this:
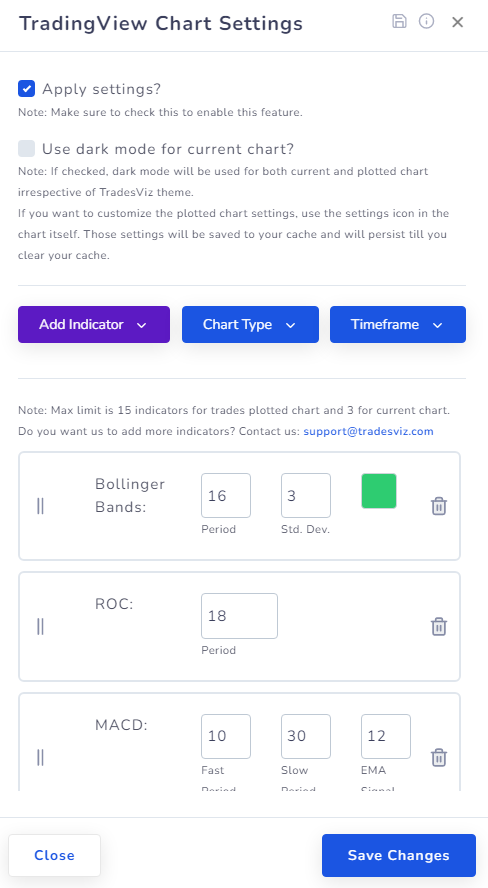
If you have used the custom chart settings, you would be very familiar with these settings - in fact, they are exactly the same!
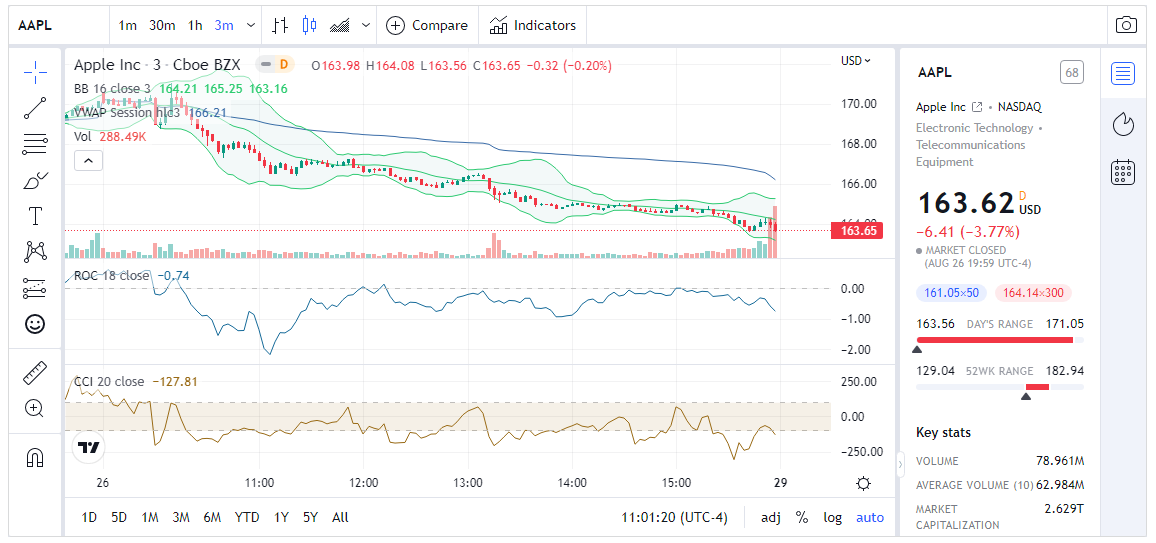
You can choose the type of chart - OHLC, HiLo, Line, etc., timeframe - from1 minute all the way to 1month+ and also the indicators you want to add to the chart. The currently available indicators are the same as the ones for the static chart but remember that we are readily accepting requests to add any indicator you see on the TradingView chart! So the current list would be:
- SMA
- EMA
- Bollinger Bands
- VWAP
- RSI
- ROC
- CCI
- MACD
TradingView has nearly 80+ indicators. We have only selected the most used ones for our initial launch and will be adding more based on feature requests!
Make sure "Apply settings" is checked if you want to use this feature! Otherwise, you will only see a plain chart with an auto-detected timeframe based on the duration of the trade.
Once you have selected your indicators (15 maximum) and other settings, click on "Save changes" and try exploring a trade. You should automatically see the settings applied to both the TradingView charts in the trade explore view.
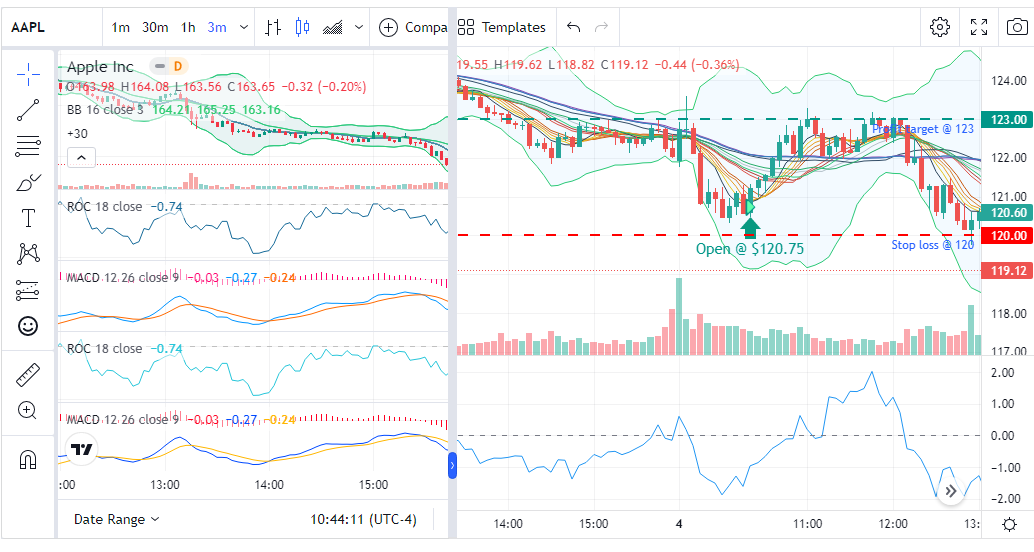
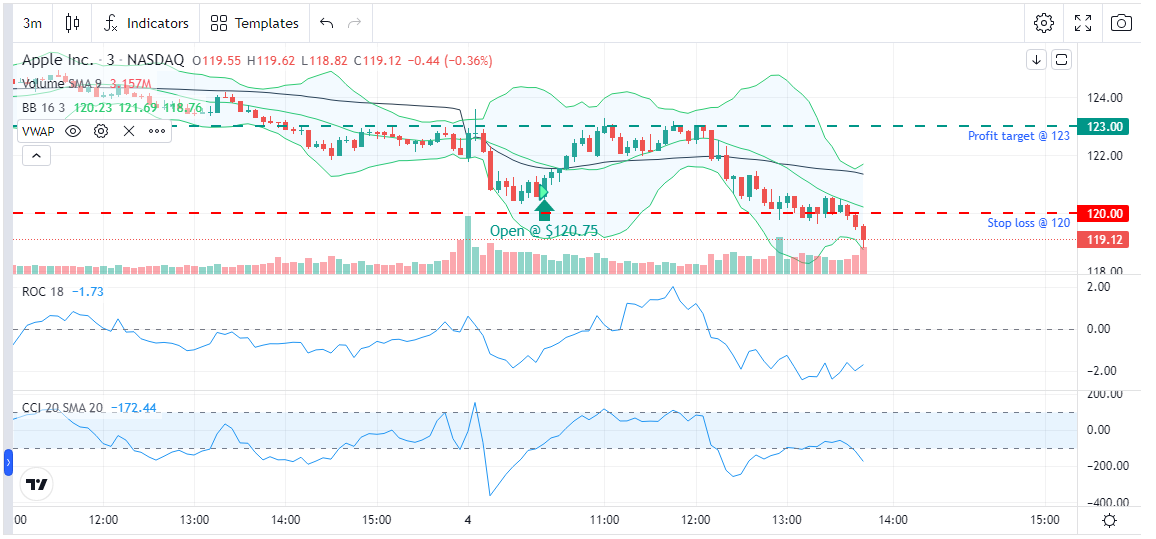
Trades Plotted chart:
Current data chart:
You can also force dark mode on both charts (irrespective of the TradesViz theme). Note that you can still use the pre-defined/saved templates in the trades plotted TradingView chart.
With this, we hope to make the journaling/chart viewing experience much simpler and more efficient than ever.
We will try to add more features to this and hopefully down the line, we will be able to have custom indicators in there as well ;)
As always, please let us know your feedback, and feature requests at [email protected] - we are waiting to hear from you!