The February 19 options flow screener showed strong sweep‑side buying across large‑cap tech and cyclical sectors, reflecting renewed institutional accumulation over the past two sessions.
$AMZN led total volume with a 17 percent increase, trading around 3.7K sweeps as buying accelerated through mid‑day. $PLTR followed with a 71 percent jump and 3.4K total trades, continuing the steady momentum seen in most AI‑linked names. $MU gained 27 percent, while $META rose 42 percent and $MSFT added 8.5 percent, showing consistent, broad tech participation.
Chip‑related activity remained firm with $SMH and $TSM both showing positive growth at 4.3 and 7.9 percent respectively, confirming sector‑wide demand. $ORCL saw a notable 65 percent spike, signaling accumulation in enterprise software, while $WMT and $XLE led the cyclical side with surges of 270 and 305 percent, indicating defensive rotation and renewed energy exposure.
The chart for $AMZN displayed short‑term volatility before a sharp rebound, matching the uptick in sweep buying. Overall, the data pointed to stable institutional engagement with buyers stepping back into tech and energy, suggesting controlled optimism heading into late‑February trading.
The February 19 options flow showed active institutional participation concentrated in gold, semiconductors, and high‑beta tech, with heavy sweeps signaling directional conviction across multiple expirations.
$GLD dominated with large two‑way sweeps on the $475 call expiring March 6 2026 — a $74 million buy followed by a $27 million sell — totaling over 220,000 contracts traded and confirming substantial positioning in precious metals exposure.
$TSLA saw repeated split activity at the $190 and $450 call strikes across both 2027 and 2028 expirations, with multiple trades between $17 million and $34 million, reflecting active repositioning and volatility management in high‑growth tech.
$TSM printed a $26 million buy sweep at the $310 strike and a smaller $10 million sell at the $360 strike, balancing long and short exposure ahead of next‑quarter projections.
$STX and $AMAT showed mid‑range flows between $11 million and $15 million per trade. $STX call sweeps at $250 and $420 imply steady accumulation in storage, while $AMAT featured back‑to‑back buy and sell sweeps across $270 to $280 strikes, signaling neutral premium rotation near expirations.
The February 19 earnings lineup features key reports from retail, energy, and infrastructure leaders, anchored by heavyweight names across multiple sectors.
$WMT leads pre‑market with a $1.03 trillion market cap and a $0.73 EPS estimate, setting the tone for retail and consumer spending sentiment. $DE follows at $162 billion and $1.92 EPS, offering a critical view on agricultural equipment and industrial demand. $SO joins the morning list with a $101 billion cap and $0.56 EPS, while $PWR prints $2.77 EPS on $78 billion, underscoring strength in utility and infrastructure services. $CVE adds energy exposure at $38 billion and $0.28 EPS.
After hours, $NEM reports with a $133 billion market cap and $2.03 EPS, giving a fresh look at metals and mining. $FIX ($47 billion, $6.77 EPS) and $ED ($41 billion, $0.84 EPS) continue utility and industrial themes, while $TRGP ($48 billion, $2.37 EPS) and $LYV ($36 billion, –$1.02 EPS) represent energy logistics and live entertainment.
Key economic events on the same day include Unemployment Claims at 07:30, the Philly Fed Manufacturing Index at 07:30, and Pending Home Sales m/m at 09:00, adding important macro context to an earnings‑heavy session.
Check the option flow dashboard 🌊 every day on TradesViz before you trade.
It takes ~3-5 minutes to explore the overall flow, market outliers, and specific info for symbols of your interest.
This alone gives you many trade ideas and can also act as a confirmation of your existing ideas.
Need something even better? Adjust filters on the left side to find *precise* trade ideas that are purely data-driven. 📊
All of this is already part of your TradesViz trading journal :)
A winning trade isn't always a good trade.
Your PnL statement only shows the finish line. It doesn't show the race.
The Drawdown Charts View exposes the messy reality of your execution.
Look at the BLNK (Short) trade. It ended green with +$320.00, but look at the massive red valley at the start.
You were underwater for nearly half the trade.
That isn't alpha. That is "surviving a bad entry."
Stop celebrating "lucky" wins. Fix your timing.
If you can't write it down, you can't trade it. 👀
"I trade based on feel" is code for "I gamble."
This feature forces you to convert your vague intuition into strict logic.
By defining your rules in code, you eliminate emotional bias and hindsight.
formalized your edge.
Stop trading vibes. Start trading rules.
Your morning coffee doesn't give you an edge. This does.
Most traders wake up and guess. The AI Insights engine wakes up and plans.
It scans your entire history to generate a hyper-specific playbook for today.
Look at the precision: "For ES futures on Thursdays, adopt the micro-scalp profile... set sub-5-minute profit/stop rules".
It isn't giving you generic advice like "be careful." It is telling you exactly how to trade ES versus GC based on your historical behavior on Thursdays.
Stop improvising. Follow the script that pays.
The February 18 options flow screener highlighted a sharp three‑day rise in the put‑to‑call ratio across multiple large‑cap and sector‑specific names, signaling increased portfolio protection and tactical hedging ahead of upcoming catalysts.
$EXPE and $RSP led the list with 3,485 and 3,881 percent increases respectively, confirming accelerated defensive activity in both travel and broad‑market ETFs. $DLTR posted the largest overall gain at 6,725 percent with a 6.5 ratio value, reflecting outsized short‑term protection in retail. $NKE also saw a 2,384 percent jump to a 2.3 ratio, indicating substantial risk adjustment within consumer discretionary.
$TXN and $SOXL rose 420 and 120 percent, suggesting semiconductor‑linked hedging, while $WULF and $CVNA both posted smaller but steady increases under 150 percent, aligning with rotational positioning in EV and clean‑energy sectors. $UGL closed the group with a 567 percent gain and a last value of 2, showing protection shifting modestly toward metals.
The chart for $RSP displayed a persistent rise in the put‑call ratio as price held relatively stable, confirming strategic hedging rather than panic selling. Overall, the flow pointed to disciplined institutional risk management as volatility expectations increased during the mid‑February session.
The February 18 options flow showed concentrated institutional activity in energy, technology, and communication names, with a mix of premium selling and disciplined call accumulation across multiple expirations.
$XLE opened the session with two large sell sweeps at the $42 and $48 call strikes expiring June and December 2026, valued at $35 million and $24 million, indicating systematic premium harvesting in the energy sector. $COP followed with multiple February 2026 call transactions between the $85 and $105 strikes, alternating between buy and sell sweeps of $7 to $15 million each, a sign of structured positioning rather than one‑sided trading.
Tech flow was led by $GOOG, which posted split activity on both sides of the $320 line for February 2026, combining call and put trades between $8 and $10 million in premium, showing controlled exposure adjustments. $SNDK and $NVDA each printed smaller but meaningful sweeps of roughly $7 to $11 million, with $NVDA’s $180 put sweep suggesting minor downside hedging ahead of upcoming catalysts.
Additional prints appeared in $MPC and $CVNA, both near the $8 million range, round‑tripping between buy and sell flows across expirations through 2026.
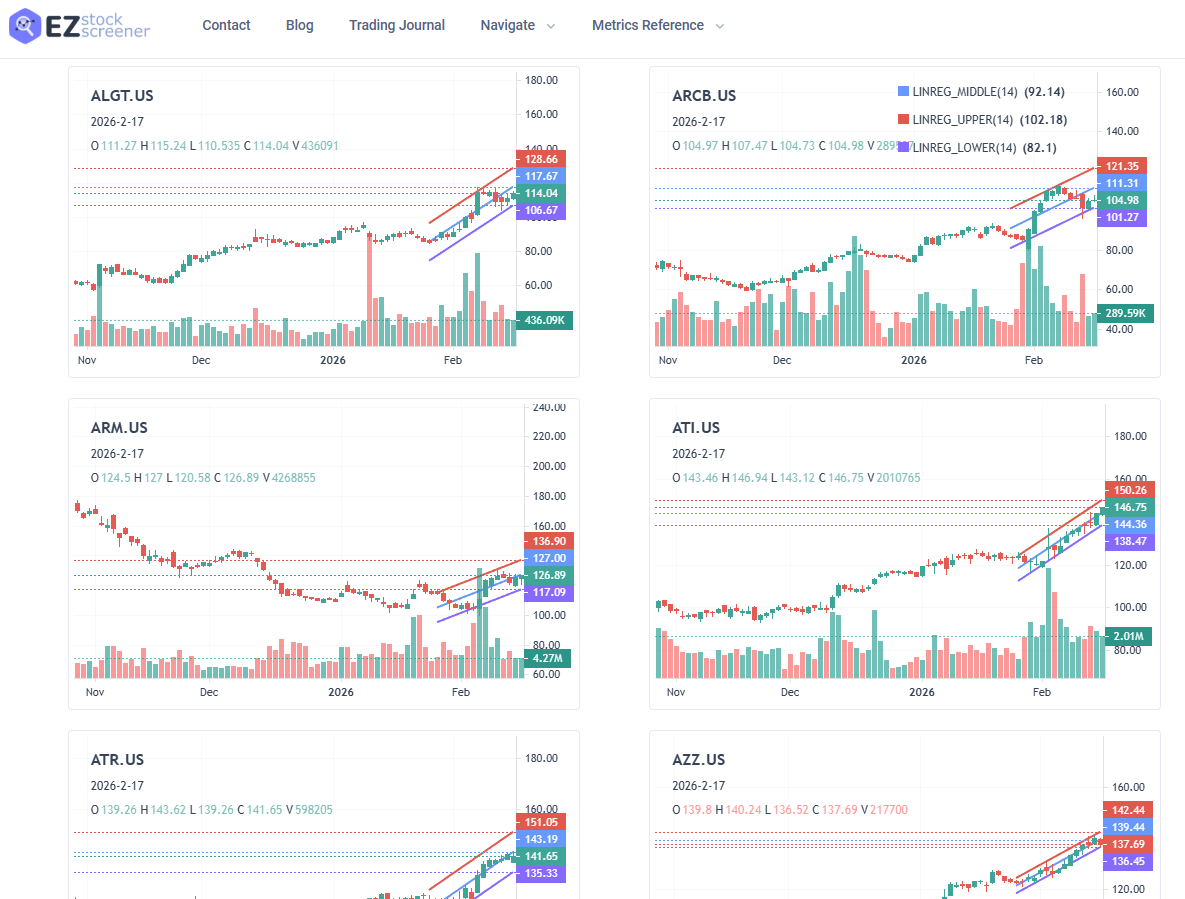
1: Simple uptrend (CCI+Linreg)
2: SMA strength - Breaking down or at support for a reversal?
Keep your trading watchlist simple and your anlaysis comprehensive.
EZstockscreener +