TradesViz
1: Golden cross ✨

TradesViz
1: Golden cross ✨
TradesViz
The February 20 technical screener showed a surge in momentum across small‑ and mid‑cap names, with sharp one‑day breakouts and steady five‑day uptrends defining early‑week trading strength. In the more than 30 percent daily gain group, $RXT led with a 227 percent jump on massive 532 million share volume, up 4,718 percent from its average, marking one of the strongest single‑day reversals in February. $SNSE followed with a 187.5 percent rise and a 129,000 percent leap in volume as biotech renewed its high‑volatility streak. $CDIO and $MLEC gained 79 and 49.9 percent respectively on sharp volume spikes, confirming broad speculative accumulation. $MHUAF, $IBRX, and $NCI each posted 38–42 percent moves supported by healthy liquidity inflows, while $AUUD and $AGIC rose in the mid‑30 percent range to round out the list. In the stocks trending upward for five days group, $FSLY remained the standout with a 107 percent five‑day gain and a 358 percent jump in volume, extending its multi‑session breakout. $BUUU advanced 74.8 percent with consistent turnover, and $SIF added 68.7 percent as industrial momentum persisted. $WOLF and $MANE both held in the 20–25 percent range, signaling orderly continuation. $HNGE and $NMRA showed smaller, still‑constructive advances backed by measured volume activity.

TradesViz
The February 20 earnings lineup highlights key releases across materials, utilities, advertising, and communication, coinciding with several major macroeconomic announcements. $AU opens pre‑market with a $54 billion market cap and a $1.90 EPS estimate, leading the mining sector focus. $PPL follows with a $27 billion valuation and a $0.41 EPS consensus, providing insight into utility performance. $LAMR posts $2.12 EPS on $13 billion, giving a read on advertising and commercial real estate demand, while $HBM reports $0.40 EPS at a $9 billion market cap, extending exposure to base metals. $BCPC ($5 billion, $1.28 EPS) and $TDS ($5 billion, $0.09 EPS) provide updates from the specialty chemicals and telecom segments. $AD ($4 billion, $0.32 EPS) and $WU ($3 billion, $0.43 EPS) add digital infrastructure and financial services perspectives. Finally, $DNOW ($1 billion, $0.12 EPS) and $CCOI ($1 billion, –$1.09 EPS) round out the pre‑market reports, offering views into energy logistics and communications infrastructure. Traders will also watch for critical data at 07:30 — Advance GDP q/q, Core PCE Price Index m/m, and Advance GDP Price Index a/q — followed by Flash PMI readings at 08:45 and New Home Sales at 09:00, setting the macro tone alongside the day’s corporate results.

TradesViz
🎉 New auto-sync! Upstox Indian broker can now be synced with TradesViz! We're adding a lot more brokers to the auto-sync list! What are we missing? Let us know! 👇 TradesViz is the *only* trading journal w/ FULL support for advanced NSE/BSE asset analytics (including options and simulation)

TradesViz
🍫Hershey Co - $HSY - Our seasonality of the day! Up ~23% this year so far 👀 Is this on your watchlist?... We found this using the TradesViz seasonality practice mode 👇

TradesViz
"History Repeats Itself." Are you paying attention? 📅 You are staring at a 1-minute chart trying to find an edge, completely ignoring the macro context. "Does the company actually make money? What did this exact stock do during this exact same week for the last 5 years?" Trading in a vacuum is financial suicide. Understand the asset before you buy the ticker.

TradesViz
Stop blaming your lack of coding skills for your lack of insight. The Artificial Intelligence Q&A feature acts as your personal, on-demand data scientist. Type your question in plain English, exactly how you think it. In this example: "list down net premium flow across top traded stocks over the past quarter year". Instantly, the engine builds a custom data table and plots a corresponding bar chart. No spreadsheets. No formulas. If you still aren't finding your edge, it's because you aren't asking the right questions.

TradesViz
Did your system fail, or did you ignore the macro? Trading in a vacuum is financial suicide. Our Month View doesn't just show your PnL; it overlays the market's schedule directly onto your performance. Use the top toggles to instantly populate your calendar with Economic Events, Earnings, IPOs, and Stock Splits. Did that massive red day happen because your technical setup was flawed, or because you were holding size through an unannounced fundamental catalyst?. Stop guessing why you lost. Add the context.

TradesViz
Which account is the anchor, and which is the sail? ⚓ If you are running multiple accounts or strategies, blending their PnL together is a great way to hide your failures. The Accounts Statistics dashboard pits your portfolios against each other in a ruthless side-by-side audit. If you only looked at your overall net worth, you wouldn't realize that one specific account is bleeding you dry. Isolate the data. Cut the dead weight.

TradesViz
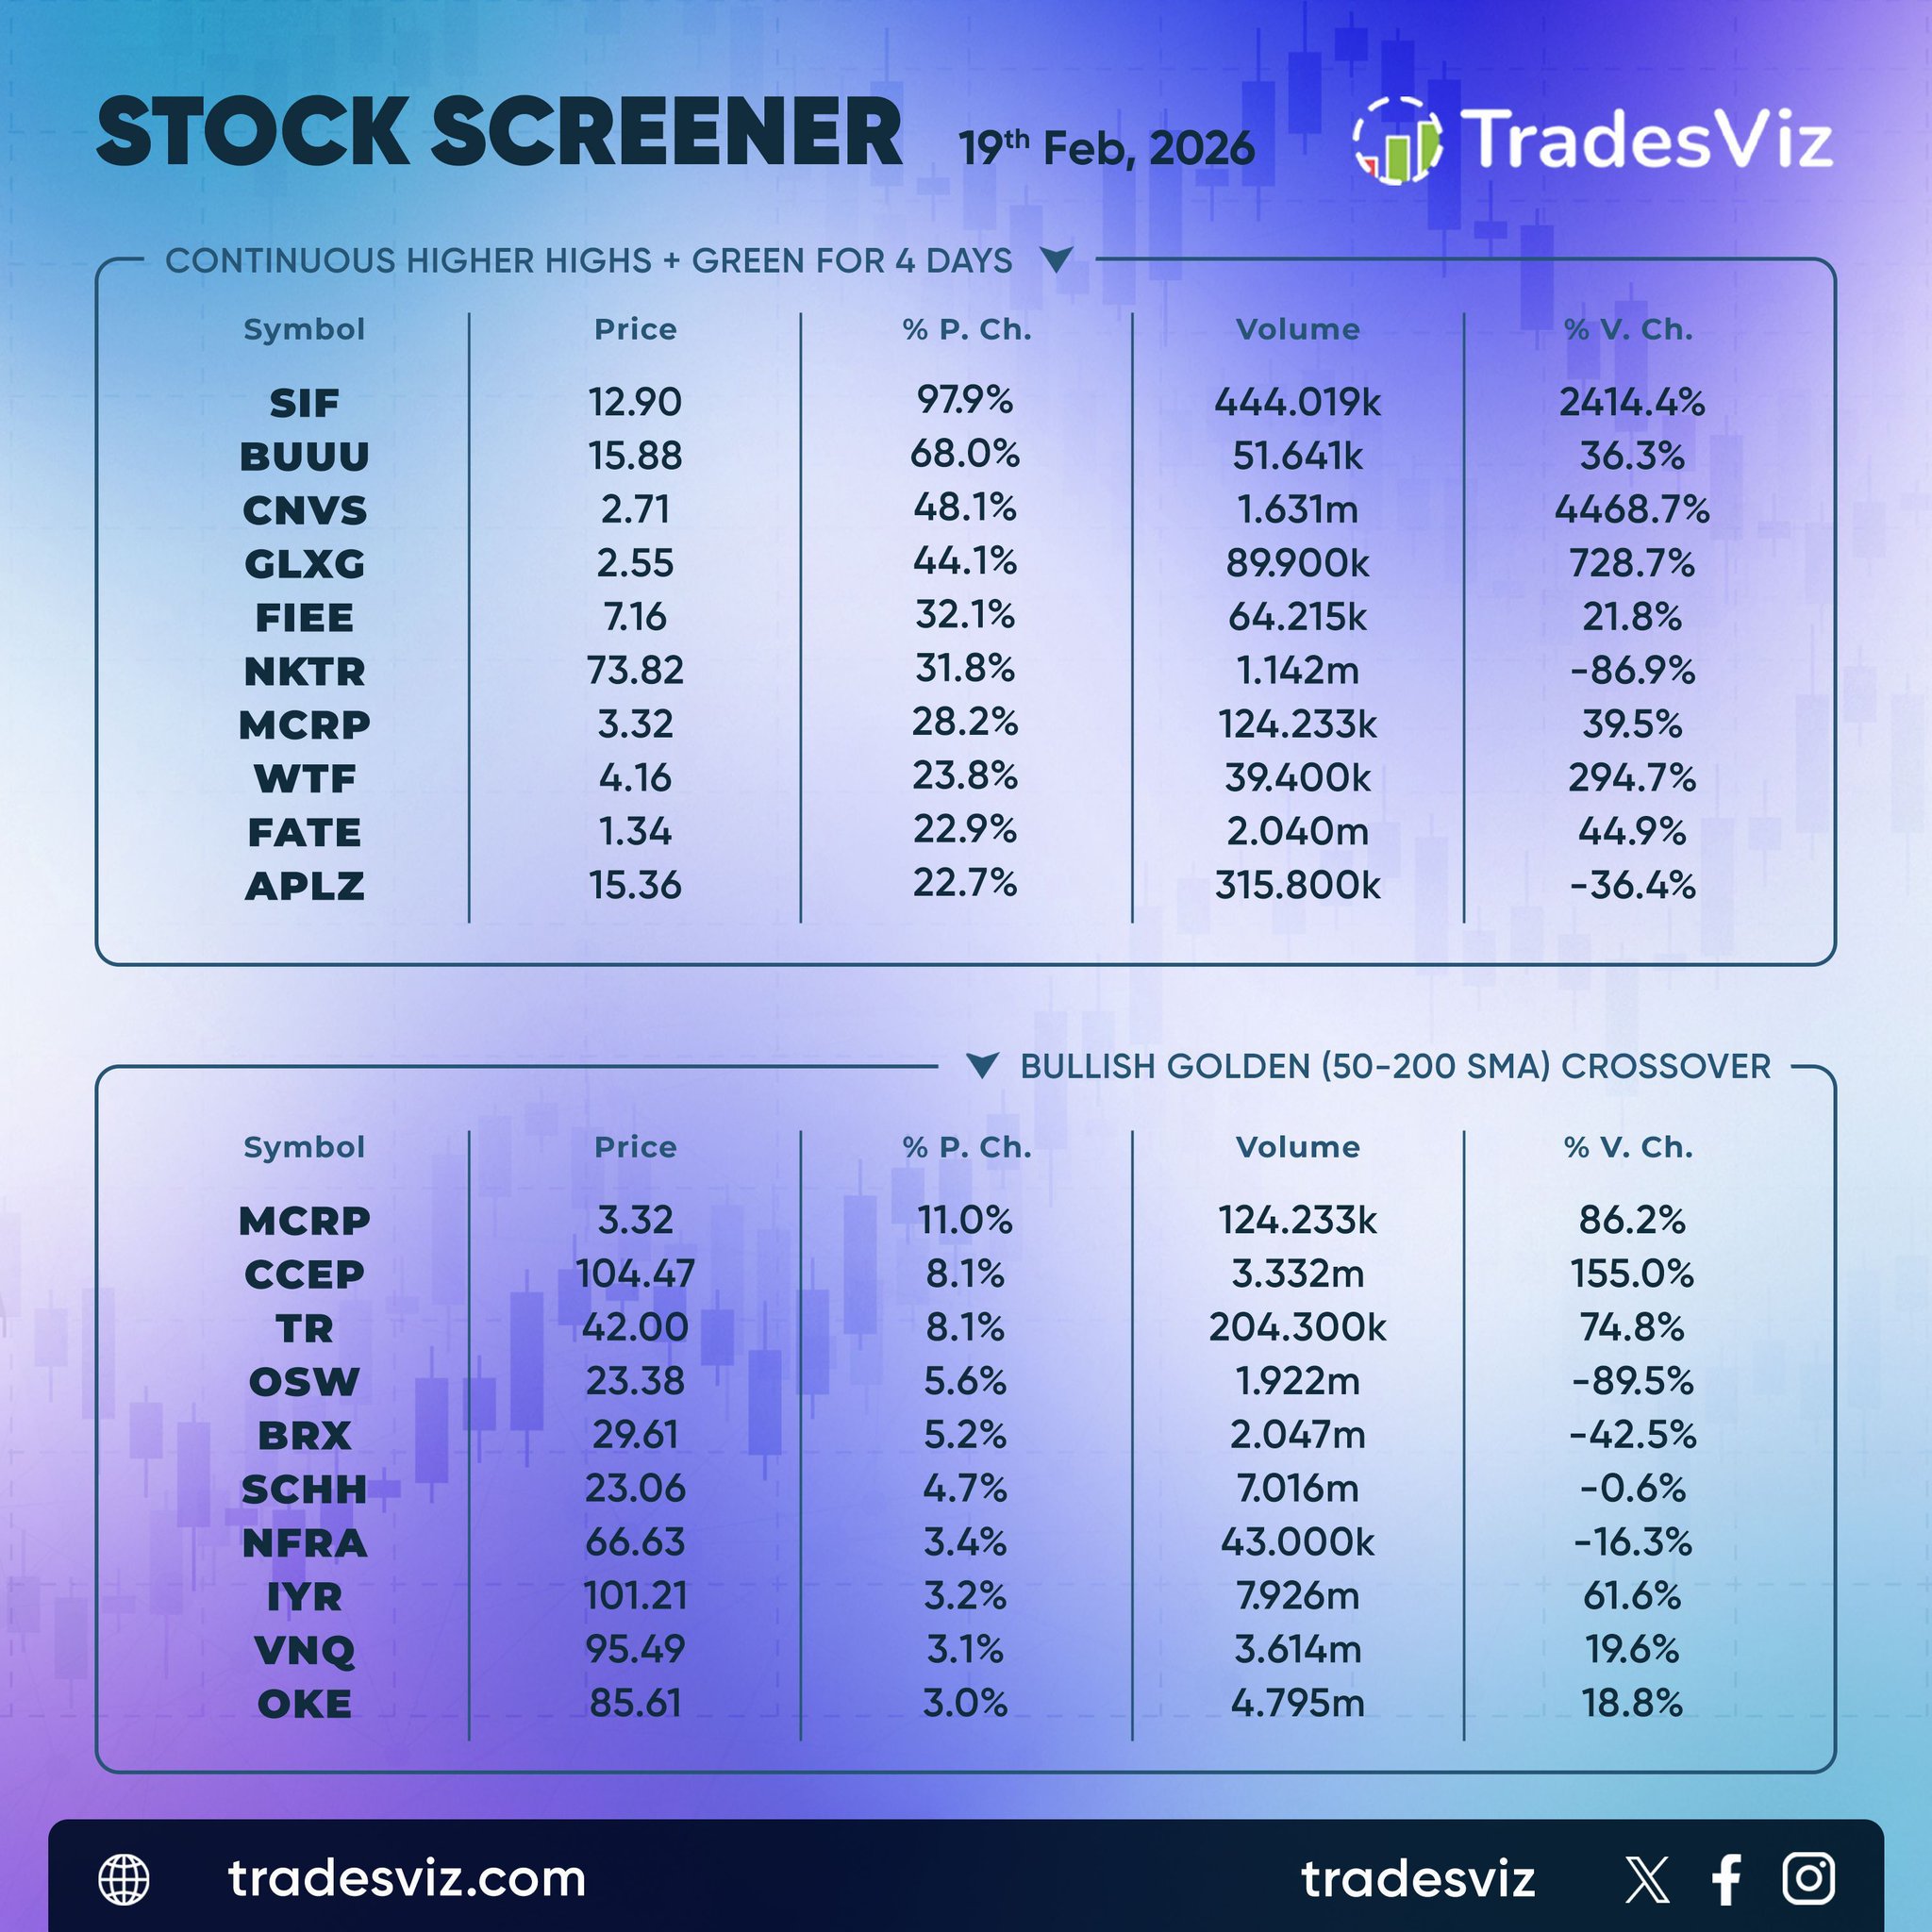
The February 19 technical screener reflected broad momentum continuation across mid‑cap and trend‑based names, with strong performers extending multi‑day rallies and multiple fresh bullish crossovers appearing in infrastructure, real estate, and communication sectors. In the continuous higher highs and green for four days category, $SIF led with a 97.9 percent jump and a steep 2,414 percent rise in volume, confirming sustained buying pressure. $BUUU followed with a 68 percent move and steady volume, while $CNVS and $GLXG advanced 48.1 and 44.1 percent alongside over 4,000 and 728 percent respective volume expansions, showing rapid short‑term accumulation in small‑cap momentum names. $NKTR and $MCRP each gained over 28 percent with solid trading activity, signaling persistent strength within biotech and renewable segments. In the bullish golden (50–200 SMA) crossover list, $MCRP reappeared with an 11 percent rise on 86 percent volume growth, showing trend confirmation. $CCEP and $TR gained 8.1 percent each, backed by strong liquidity and follow‑through volume. Lower‑beta names like $NFRA, $IYR, and $VNQ reflected quieter yet stable advancement between 3 and 3.5 percent, indicative of capital rotation into yield‑sensitive sectors. Overall, the screen highlighted expanding participation from speculative mid‑caps to defensive infrastructure plays, underscoring consistent momentum breadth through the third week of February.