The April 9 screener highlighted strong continuation signals across both momentum and technical setups, with several names extending double‑digit uptrends and others pressing into upper‑band resistance.
Long‑trend leaders $OSCX (+309%) and $OKLS (+267%) continued their multi‑week climb, joined by $QBTZ (+252%) and $STSM (+165%) as volume held steady rather than fading — a constructive sign of controlled accumulation. $CAR and $APLS added 155% and 136% respectively, with $SLNO standing out on a 1,000% volume spike, confirming broad momentum depth into mid‑April.
In the upper‑Bollinger band group, $CAR and $ORKA reappeared as the strongest signals, while $SMZ, $PNRG, and $MEDP joined with rising volume to mark fresh overbought extensions. The presence of $MPWR and $MUSA added institutional quality to the list, suggesting rotation toward high‑liquidity growth names.
Overall, the April 9 tape underscored firm risk appetite — momentum names continued to trend orderly while upper‑band signals confirmed that buyers remain engaged and willing to press gains into strength.
The April 9 options flow screener highlighted a surge in sweep‑buying across large‑cap tech and semiconductors, signaling renewed conviction at the start of Q2.
$META dominated the session with a 521 percent increase in sweep trades over the past two days, supported by firm price action between $580 and $620. $TSLA (+33 percent) and $NVDA (+81 percent) followed as buyers re‑engaged in long‑dated contracts, showing clear follow‑through in growth leaders.
Chip names $MU (+89 percent) and $INTC (+210 percent) exhibited strong accumulation patterns, while $GOOGL, $AMZN, and $PLTR registered triple‑digit rises in sweep volume, indicating broad participation across AI and cloud themes. $MSFT (+2 percent) and $AAPL (+33 percent) acted as steady anchors within the mega‑cap space.
Overall, the April 9 flow confirmed coordinated institutional buying across tech and semis, with META’s breakout highlighting the sector’s renewed leadership momentum.
The April 9 tape showed sustained institutional activity across high‑liquidity tech and semiconductor names, reflecting controlled positioning rather than outright momentum.
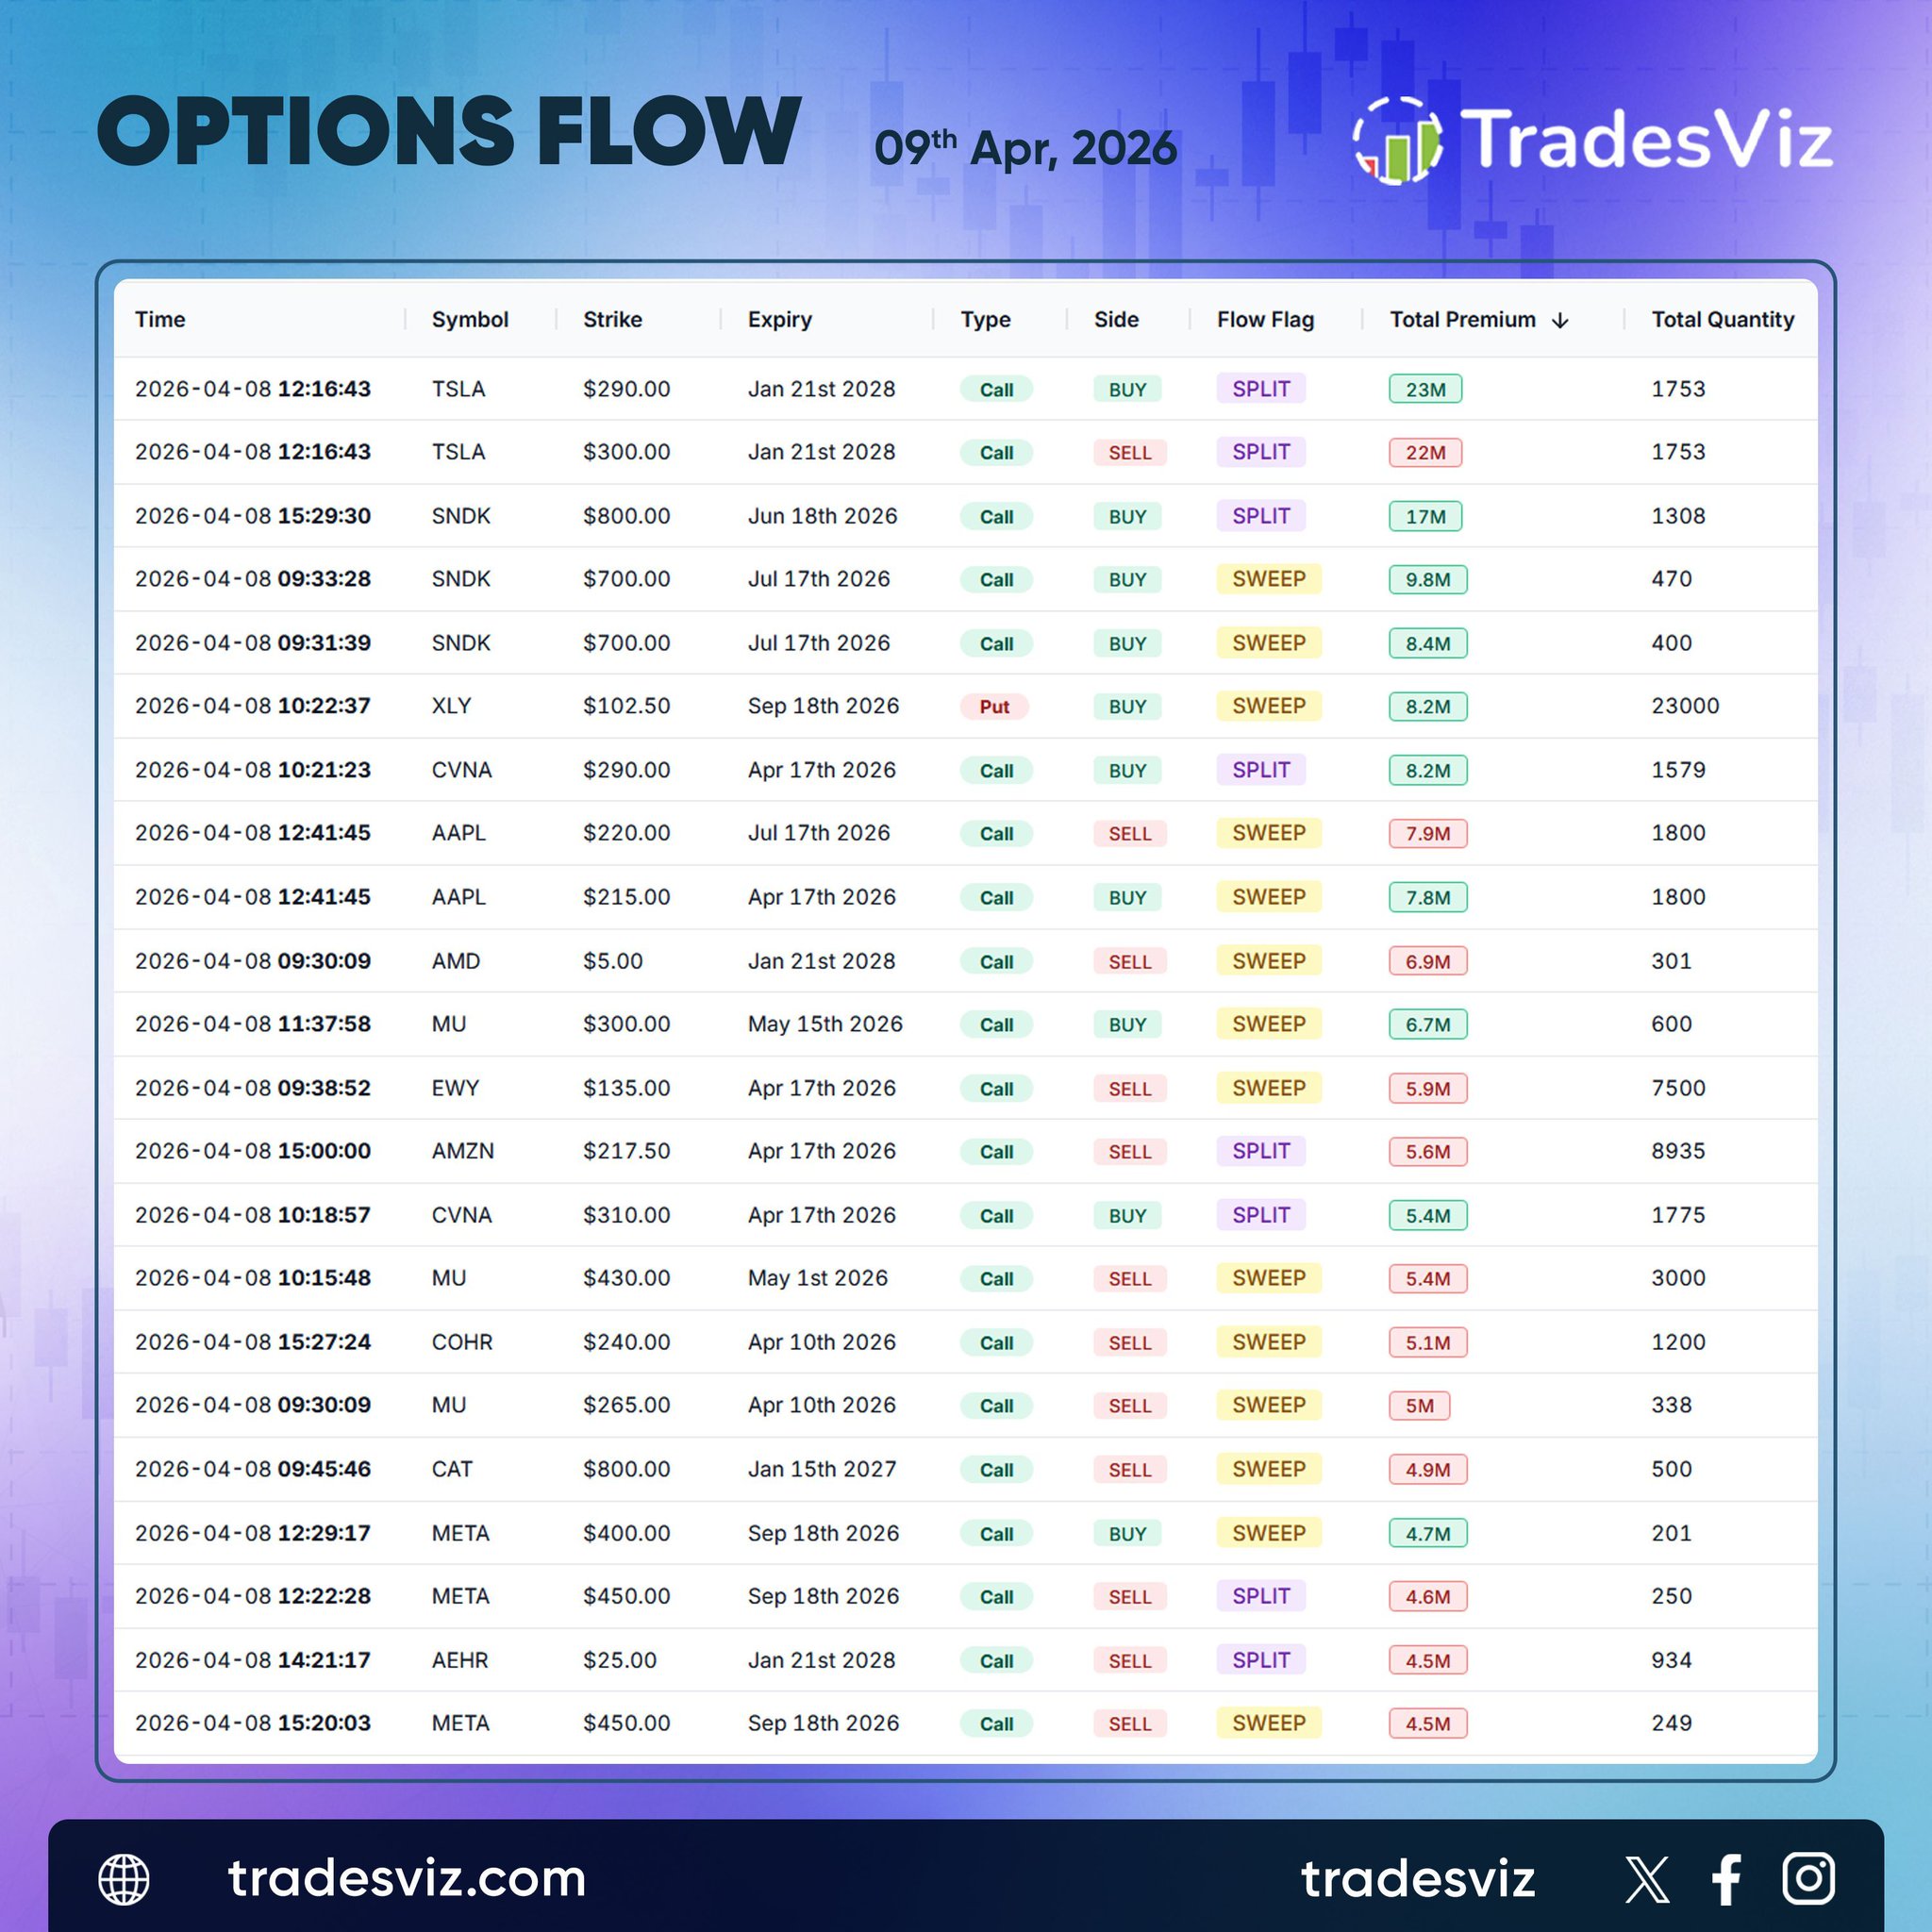
$TSLA set the early tone with offsetting call prints — a $23M split buy at $290 against a $22M split sell at $300 for Jan 2028 — classic hedge adjustment within a defined range. $SNDK and $MU added to semiconductor flow, posting $9.8M and $6.7M call sweeps as participants continued to reinforce core chip exposure through mid‑2026 maturities.
Rotation appeared in $AAPL and $META, each showing simultaneous buy‑and‑sell activity near $215 and $450 strikes, a structure consistent with volatility management into summer earnings. $AMZN and $CVNA extended their presence with $5–8M in split call prints, keeping consumer discretionary represented on the board.
Overall, April 9 flow signaled disciplined portfolio tuning across large‑cap tech and semis. Institutions are maintaining directional balance while strategically building long‑dated exposure into the second quarter.
Earnings for April 9 bring a cross‑sector mix of consumer, biotech, and industrial names alongside key macro releases focused on inflation and growth.
After hours, $WDFC ($2B market cap, $1.38 EPS estimate) and $SLP ($254M, $0.27 EPS) headline the session, providing key reads on discretionary spending and life‑science analytics. Pre‑market activity centers on $BB ($2B, $0.04 EPS) and $SMPL ($1B, $0.36 EPS), backed by smaller contributors $NEOG ($2B, $0.02 EPS), $BYRN ($211M, $0.05 EPS), $NTIC ($76M, $0.02 EPS), and $ZBAI ($64M, consensus not issued).
At 07:30, market attention turns to the Core PCE Price Index m/m, Final GDP q/q, and Final GDP Price Index q/q prints accompanied by weekly Unemployment Claims — a high‑impact data cluster likely to influence both rate expectations and early futures tone.
Together, the April 9 lineup provides a tight read on consumer resilience, industrial input integrity, and macro inflation trends as quarter two earnings acceleration begins.
Stop paying for a separate scanner just to watch the tape. ⚡
The first-in-market Real-Time Live Screener brings the hunt directly into your journal.
Build custom, real-time scans for massive volume spikes, sudden price changes, or consecutive green bars, and pull up the live chart instantly on the exact same screen.
Stop chasing alerts across three different apps. 🛑
Let the setups come to you. 🎯
Your win rate doesn't exist in a vacuum. 📉
A 60% overall win rate sounds great until you realize you win 80% of your trades on Tuesdays but only 30% on Fridays.
The Win-Rate Charts dashboard slices your edge into highly specific, actionable timeframes.
Stop looking at aggregate numbers. Instantly visualize your exact ratio of Wins to Losses broken down by Time of Day, Day of the Week, and Month. Overlay volume and PnL curves directly onto the bar charts to see if your high win-rate days are actually driving your profitability or just padding your stats with tiny scalps.
Stop trading your weakest setups. 🛑
Find your highest probability zones. 🎯
Apparently some platforms tell their customers we don't have 🤡
❌ Trade replay
❌ Backtesting
❌ Prop firm support
Meanwhile, on TradesViz today 😎
✅ Second-by-second trade replay
✅ 70+ indicator backtester across 30,000+ symbols
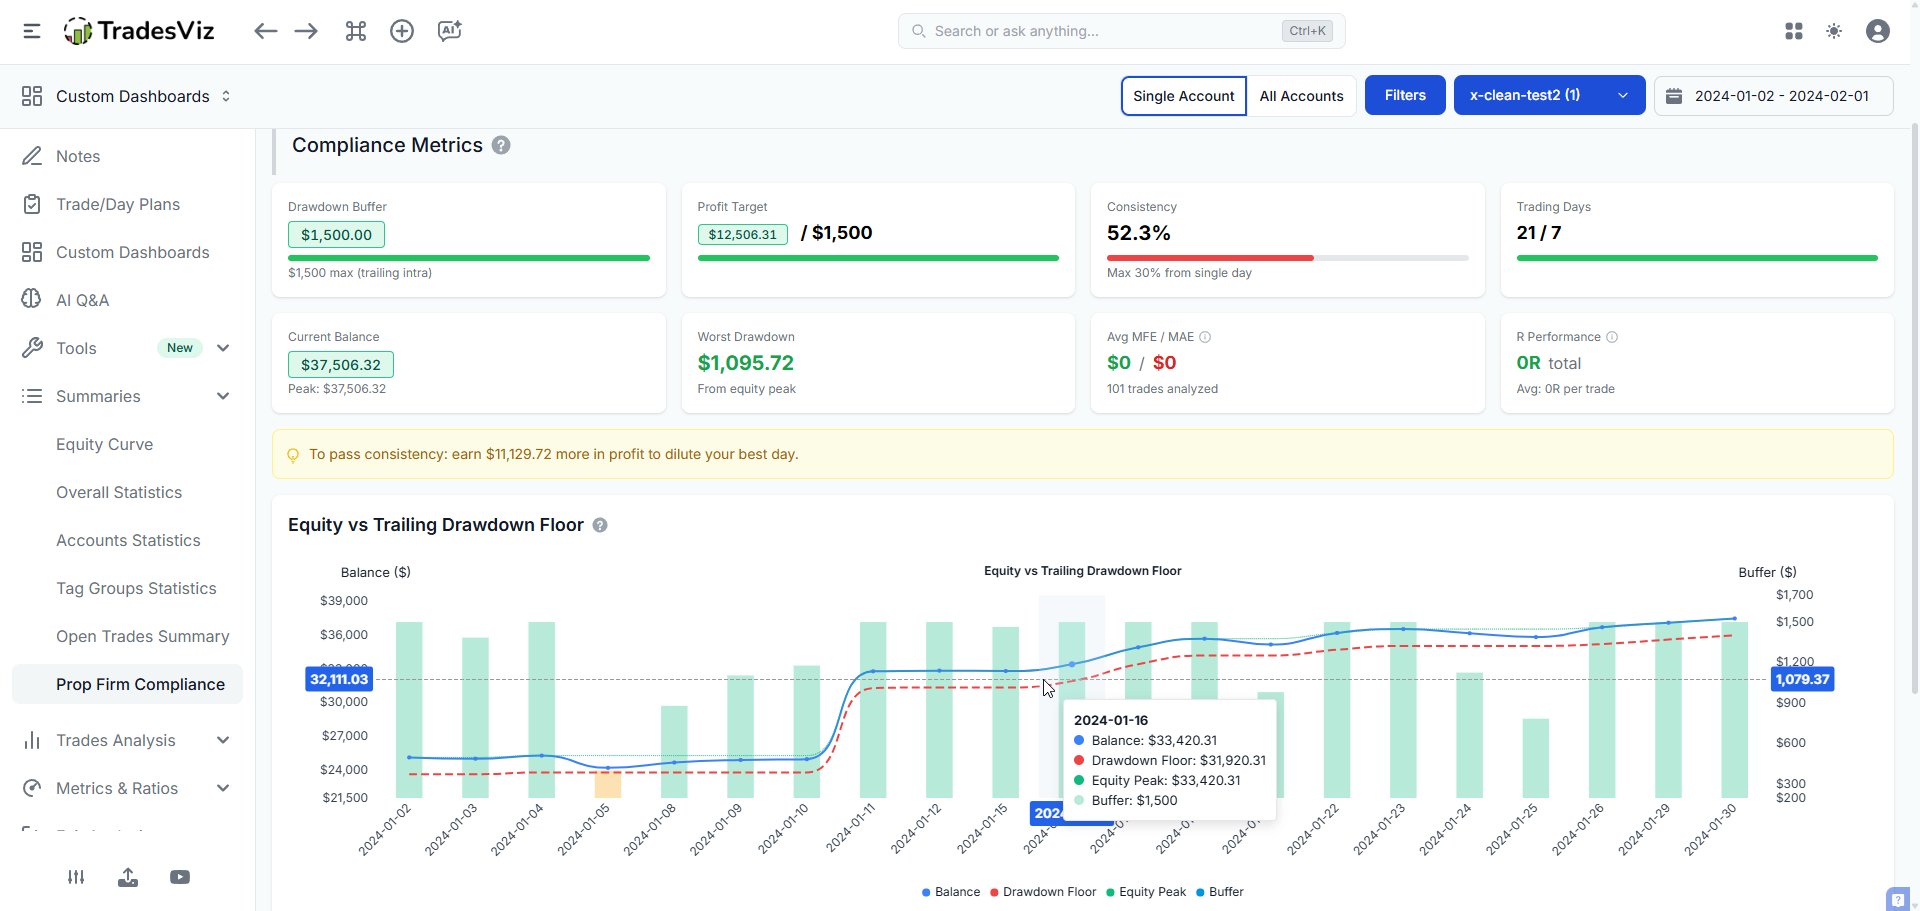
✅ Prop firm compliance with drawdown + daily loss tracking
Don't take anyone's word for it. Try it yourself.
A winning trade doesn't mean it was a comfortable ride. 🎢
Seeing a green PnL on a closed trade is great, but it hides the emotional and financial pain you might have endured to get there.
The Trades Drawdown View exposes exactly how much heat your positions take while open.
By mapping your minute-by-minute running PnL against your entry point, you can instantly see if a trade spent 80% of its duration deep in the red before finally crawling back to break-even.
Stop calling lucky escapes "good trades." 🛑
Track your actual pain threshold. 📉
🎉 NEW Options flow feature: AI summary for unusual flow and market overview!
Whatever filters you apply -> Get the relevant data + AI insights in a single click!
We've been focusing on making trading prep easier and this should help a lot of traders! 😁
Never fly blind into a complex options spread. 🦇
If you can't visualize your exact max loss and breakeven points before execution, you are just gambling on Greeks.
The Options Payoff Chart instantly maps your theoretical risk profile.
Build complex multi-leg strategies-from Iron Condors to Strangles-and dynamically visualize how changes in underlying price, implied volatility, and time decay will impact your final PnL at expiration.
Stop guessing your exposure. 🛑
Map the math. 📈