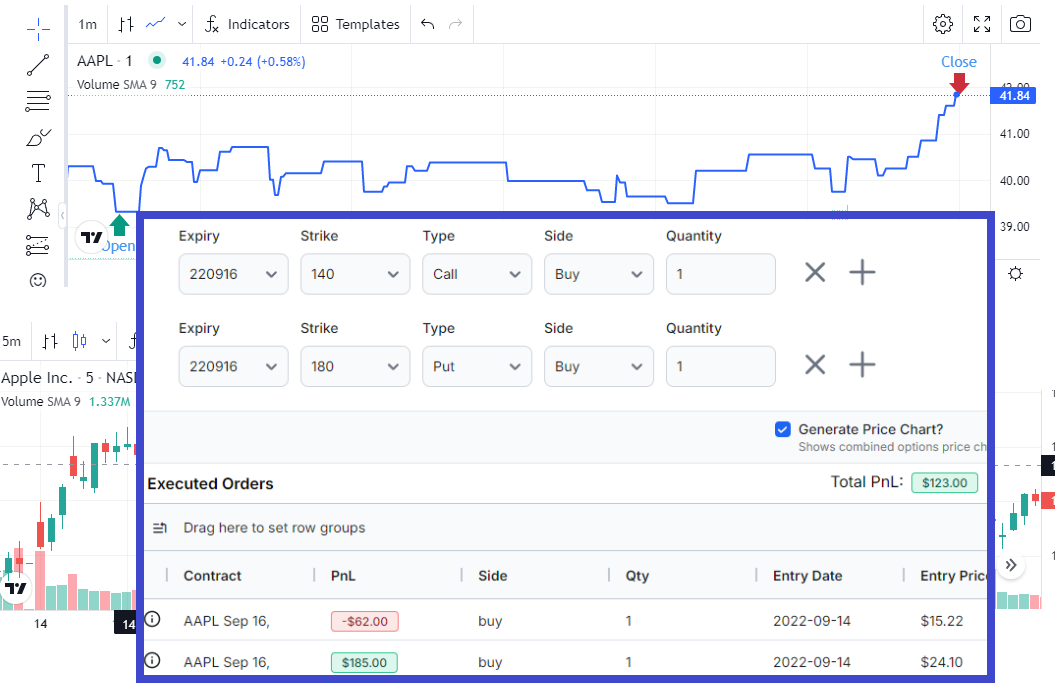
Updated Aug 2026: The Option Execution Simulator has been redesigned around a clearer question: what actually happened to this position, minute by minute? It now includes strategy templates, relative strike and expiry rules, trading-cost modeling, path metrics, an exit-time sweep, and leg-level mark-quality analysis. Jump to the Aug 2026 walkthrough.
First, we wish everyone a very Happy New Year!
At TradesViz, there's always some brewing and to start this year off, we're launching a massive new feature that is going to help ALL stock and options traders - both to see how their trades would have performed using data that is not accessible anywhere + help traders to learn correlations between options contract(s)/spreads pricing vs underlying.
All of this is available from Tools > Option Execution Simulator in your TradesViz dashboard.
The original launch layout had four sections. The screenshots in this first walkthrough preserve that version of the product; the Aug 2026 update below explains the redesigned workflow.
- Symbol/date selection area
- Option strategy legs creation and PnL summary area
- Underlying chart for the selected date and symbol
- Combined options price chart for all the legs created as part of the simulation
Choose a symbol and one historical entry/exit window. In the current interface, click Load Contracts to load the real expiries and strikes for that window, then build a position with up to eight option legs. Older screenshots below show the previous "Get Data" workflow.
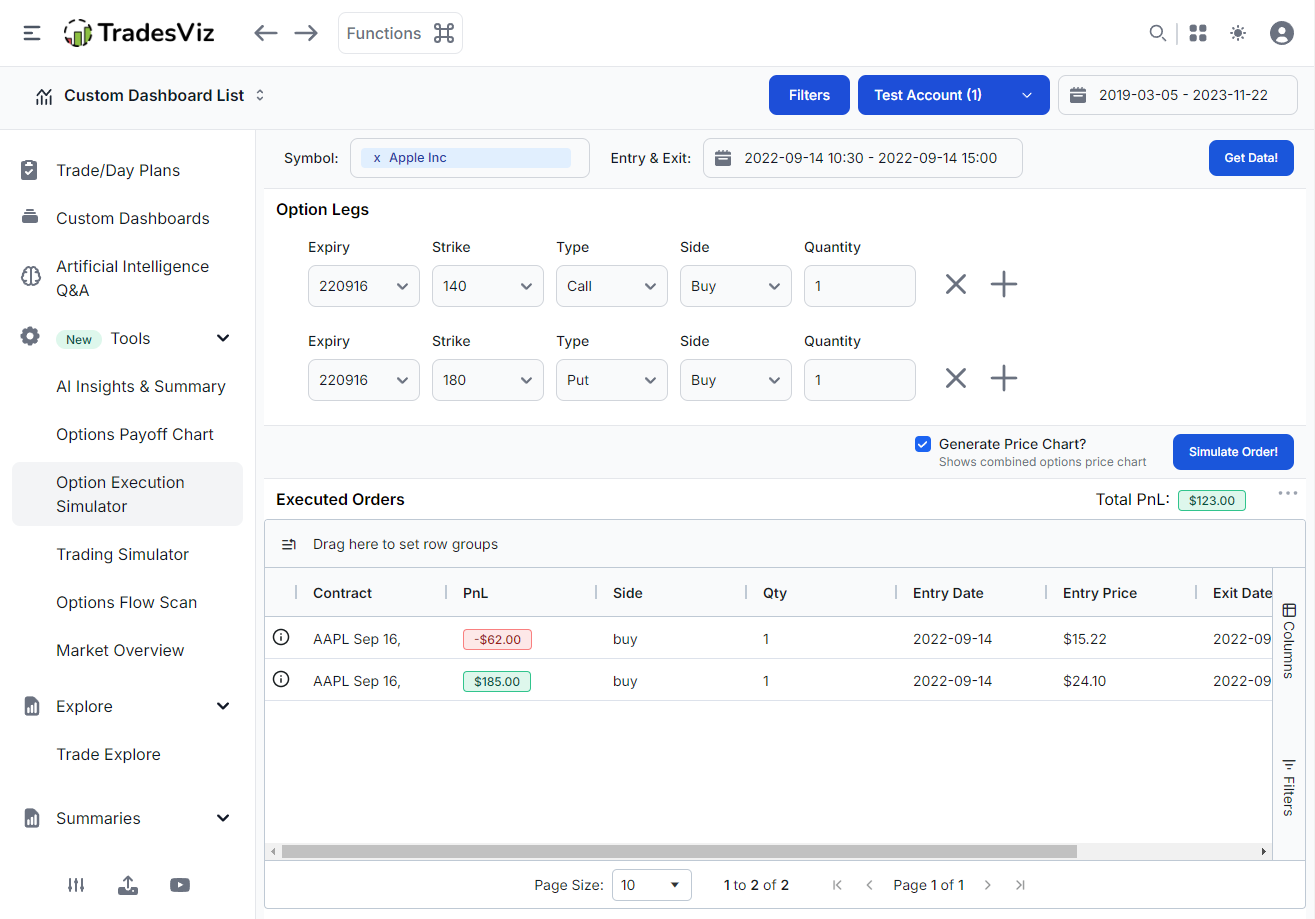
Once the position is ready, click Analyze Position (called "Simulate Order" in older versions). This can take some time depending on the number of legs because TradesViz is loading historical options data. The leg results show the entry mark, exit mark and PnL for each contract.
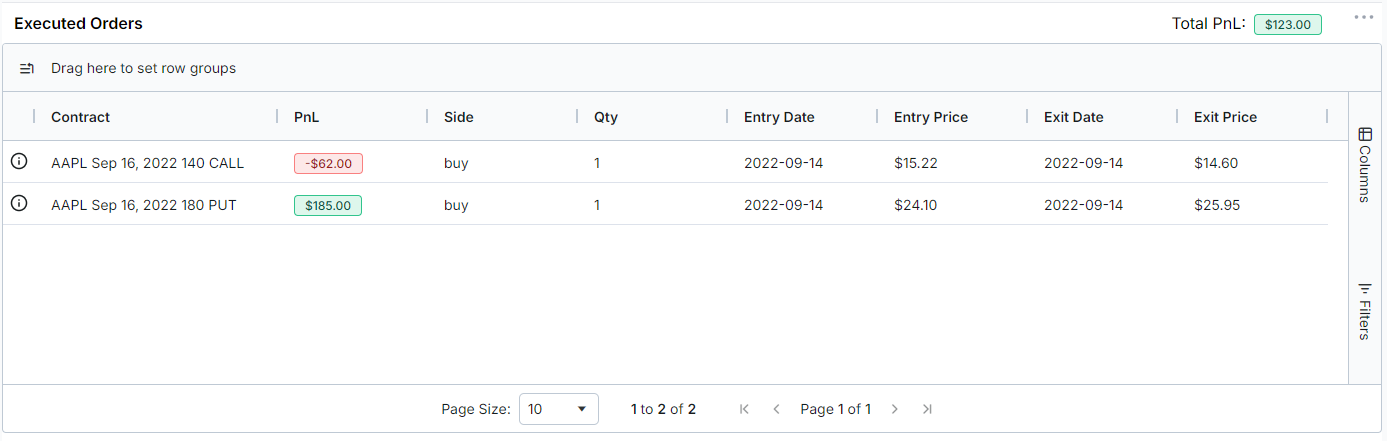
The entry mark, exit mark, PnL per contract and total PnL are calculated for the selected option legs. These are historical last-traded marks, not guaranteed executable bid/ask quotes. When a contract does not trade on a bar, its previous mark is carried forward.
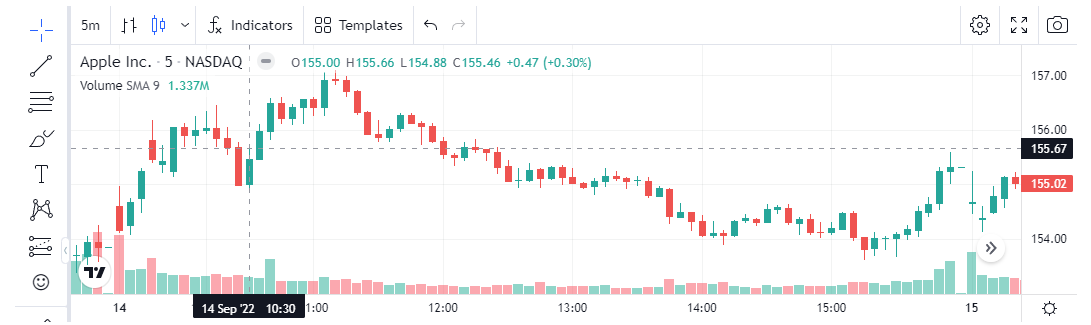
The last section shows the underlying price chart and right below is the combined options price chart.
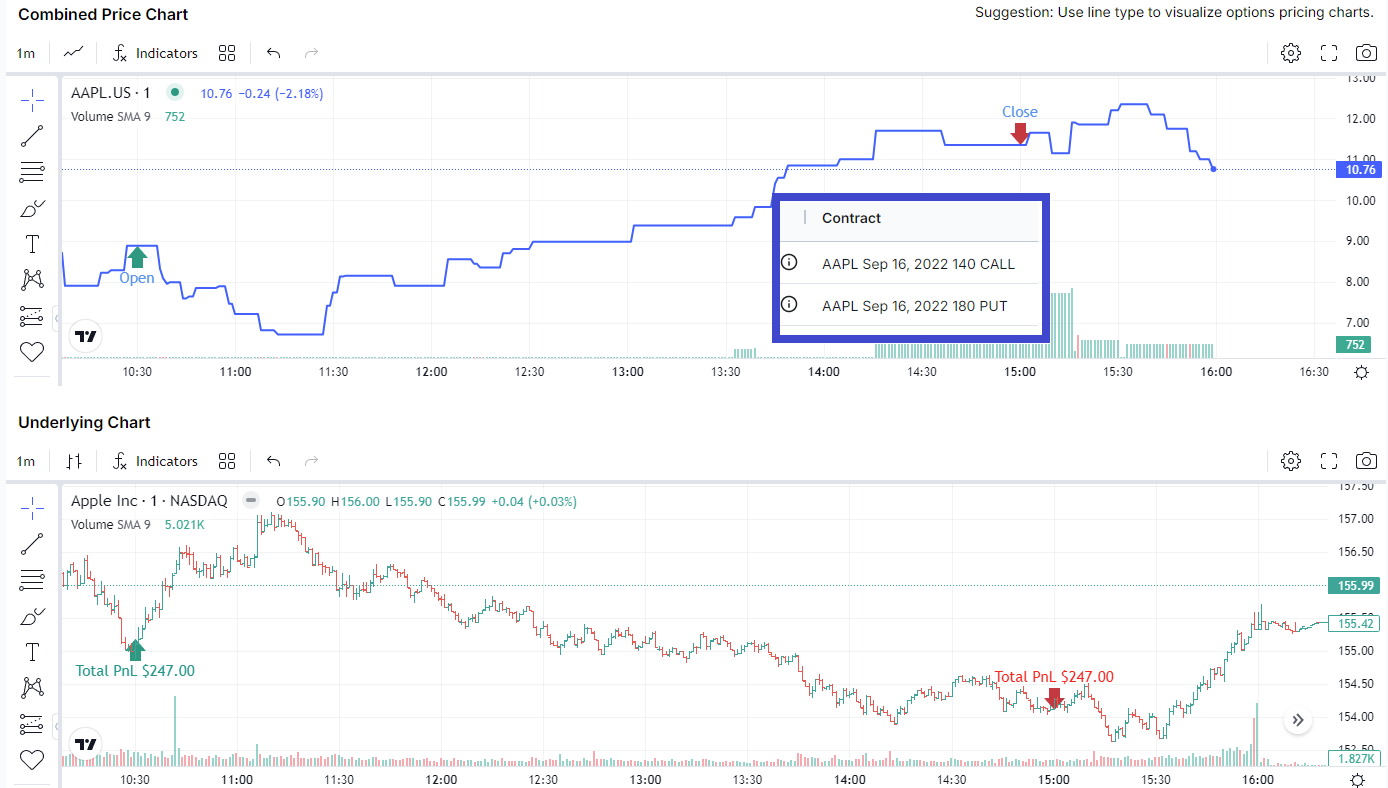
What is the combined options chart?
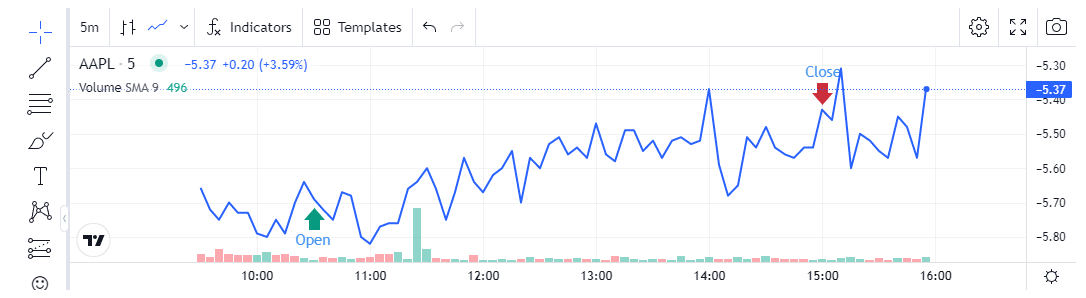
In this example, we are simulating buying a spread of AAPL Sep 16, 2022, 140 Call/180 Put on 14th Sep 2022 (this is defined in the section below). This takes the individual options contract prices for the given timeframe and sums it up based on whether the contract is bought or sold. For example, if the price of AAPL Sep 16, 2022, 140 Call at 14:45 is $1.5 and AAPL Sep 16, 2022, 180 Put is $3.0, the chart would show $4.5 if we're buying both options. If we are selling only the 140 call, then the price at 14:45 would be (-3.0)+4.5 = $1.5.
(Note: You can also view the individual contract's price by clicking on the chart on the leftmost side of each row/contract in the PnL section)
The second chart plots exactly this - but for the entire duration of the trade. This is very helpful and is often never shown even in the brokers you trade with. This lets you understand exactly how the price of the entire position moves with respect to the underlying of the contract - all on the same page.
Why is this important? or How can I use this?
The benefits can be divided into two parts: backtesting and understanding. You can reconstruct charts, historical marks and PnL for an optionable US equity from Jan 2022 for a custom option position, then study how that position changed over its holding window. All of this is built into your TradesViz account. You can use historical US options contract data to analyze single-leg and multi-leg positions.
The important use of this feature is to simulate option spreads and even single contracts to learn the correlations between price movements of underlying and the options contract. If you combine this with the intraday advanced options flow we have, you have the most powerful options analytics tool at your fingertips.
- How does a condor work when a stock's price is behaving in a certain way? Would another strategy be better?
- What strikes should you choose? What expires should you choose? How does DTE affect the trend of options prices?
- What if you try different hedging positions with multiple DTEs?
You can come up with countless questions like the above when you are dealing with options trading because options trading is very complex. There isn't a tool that can help you visualize options in the way TradesViz does. The focus of journaling is usually patterns understanding from your trades - but why stop there? Why not expand/extend that into simulating scenarios where you can learn even more? This is how you approach trading analysis in a holistic way in 2023 and we're trying to make it as easy as possible.
An AAPL Iron condor example
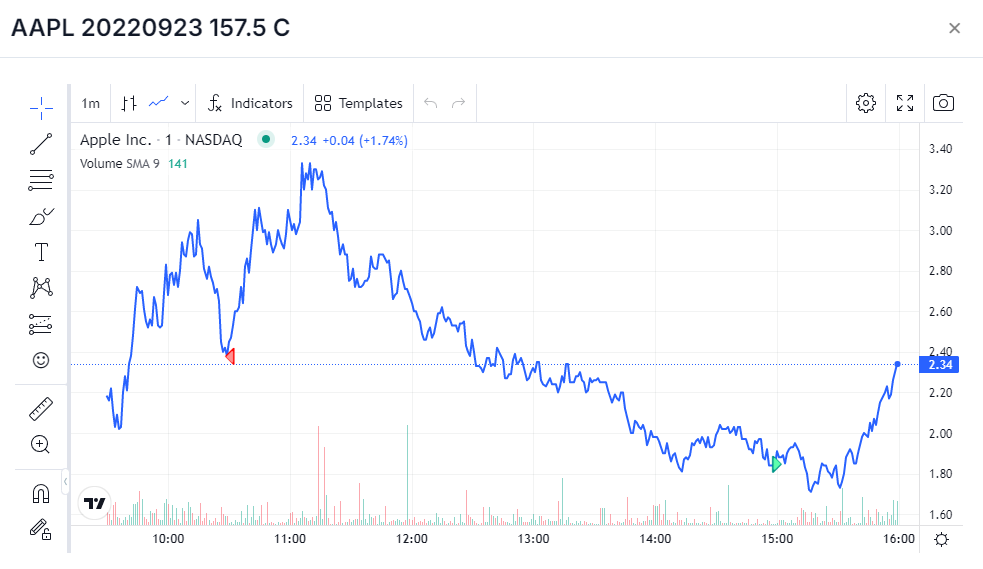
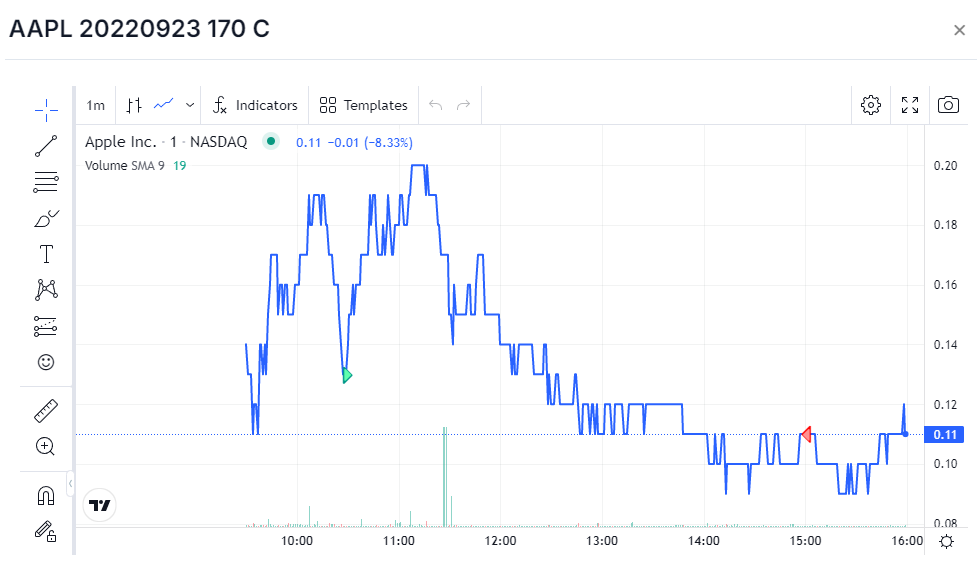
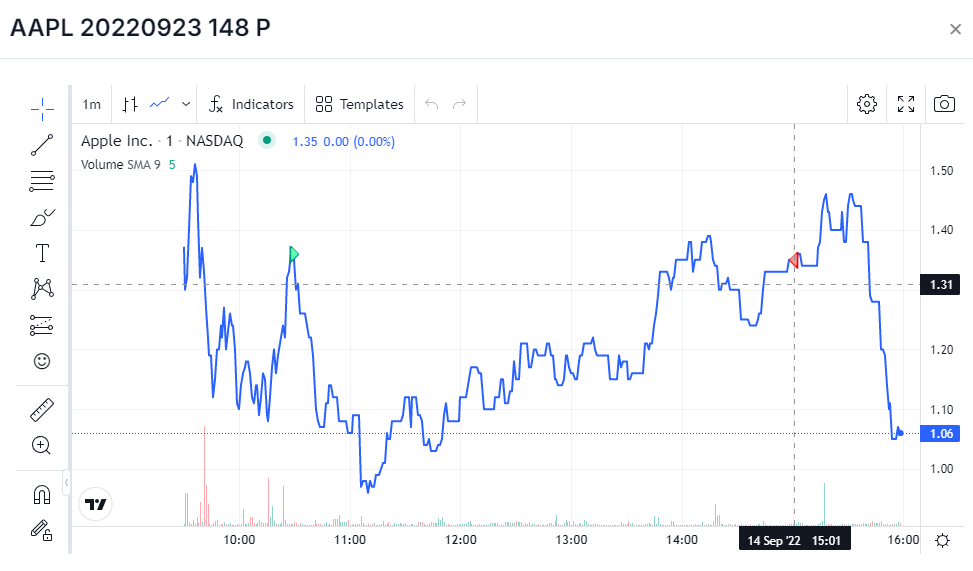
We're going to see how to use this tool to simulate an AAPL Iron condor bought on Sep 14th, 2022. Here are the options legs:
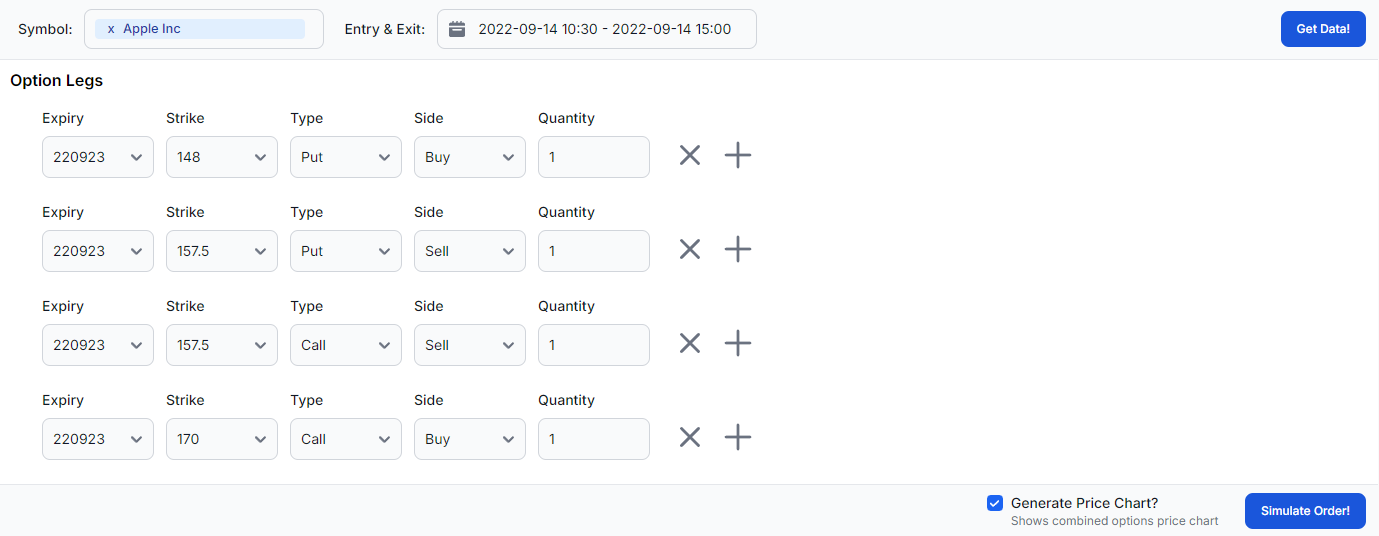
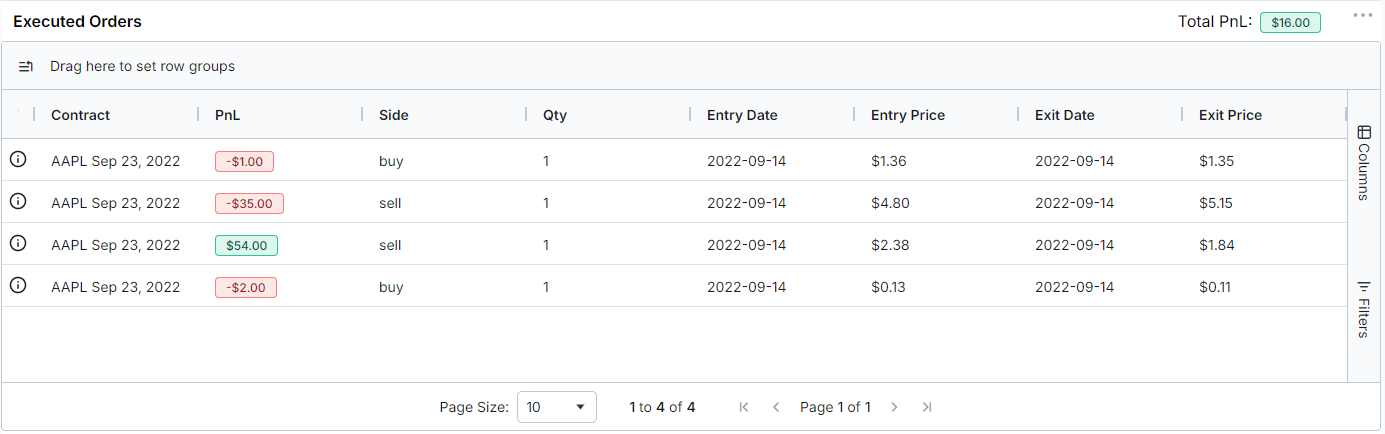
Here's the PnL result:
Here are the charts - underlying and the options contract summed charts are shown below. Have you ever seen the price chart of your options spreads? and have you compared it with the underlying? You can now do so with this feature in the TradesViz trading journal.
If you are interested in seeing the prices of each of the 4 legs:
 |
 |
 |
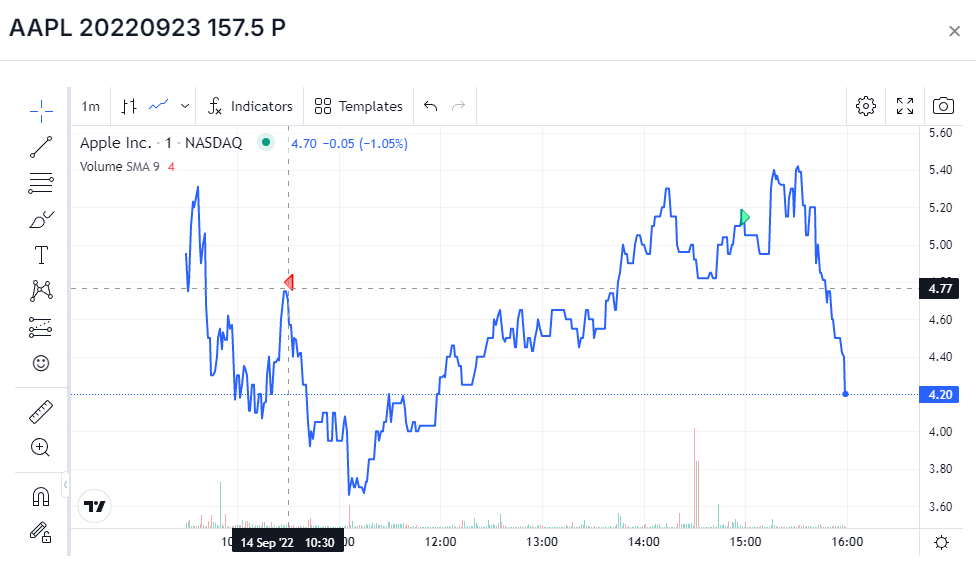 |
We highly recommend using line charts for visualizing the options prices as most contracts are very lightly traded and it's hard to make sense of OHLC bars.
Soon, there will be more extensions and unifications of options flow with this which will augment your learning. Instead of simply following tools blindly, let TradesViz teach you how to use tools like options flow better. Being able to provide solid reasoning for every execution you take will surely make you a consistently successful trader. After all, 90% of trading failure comes from not understanding the process which leads to breaking one's own rules.
The key to success in trading is knowledge.
With this new feature, we hope to provide all traders with another valuable resource to learn from and succeed. As always, if you have any questions or feature requests, please contact us at [email protected].
Update July 2024
All of these features are now available for NSE (India) future and stock options! This is the first time an online trading journal has both the most popular options trading exchanges data and that's TradesViz!
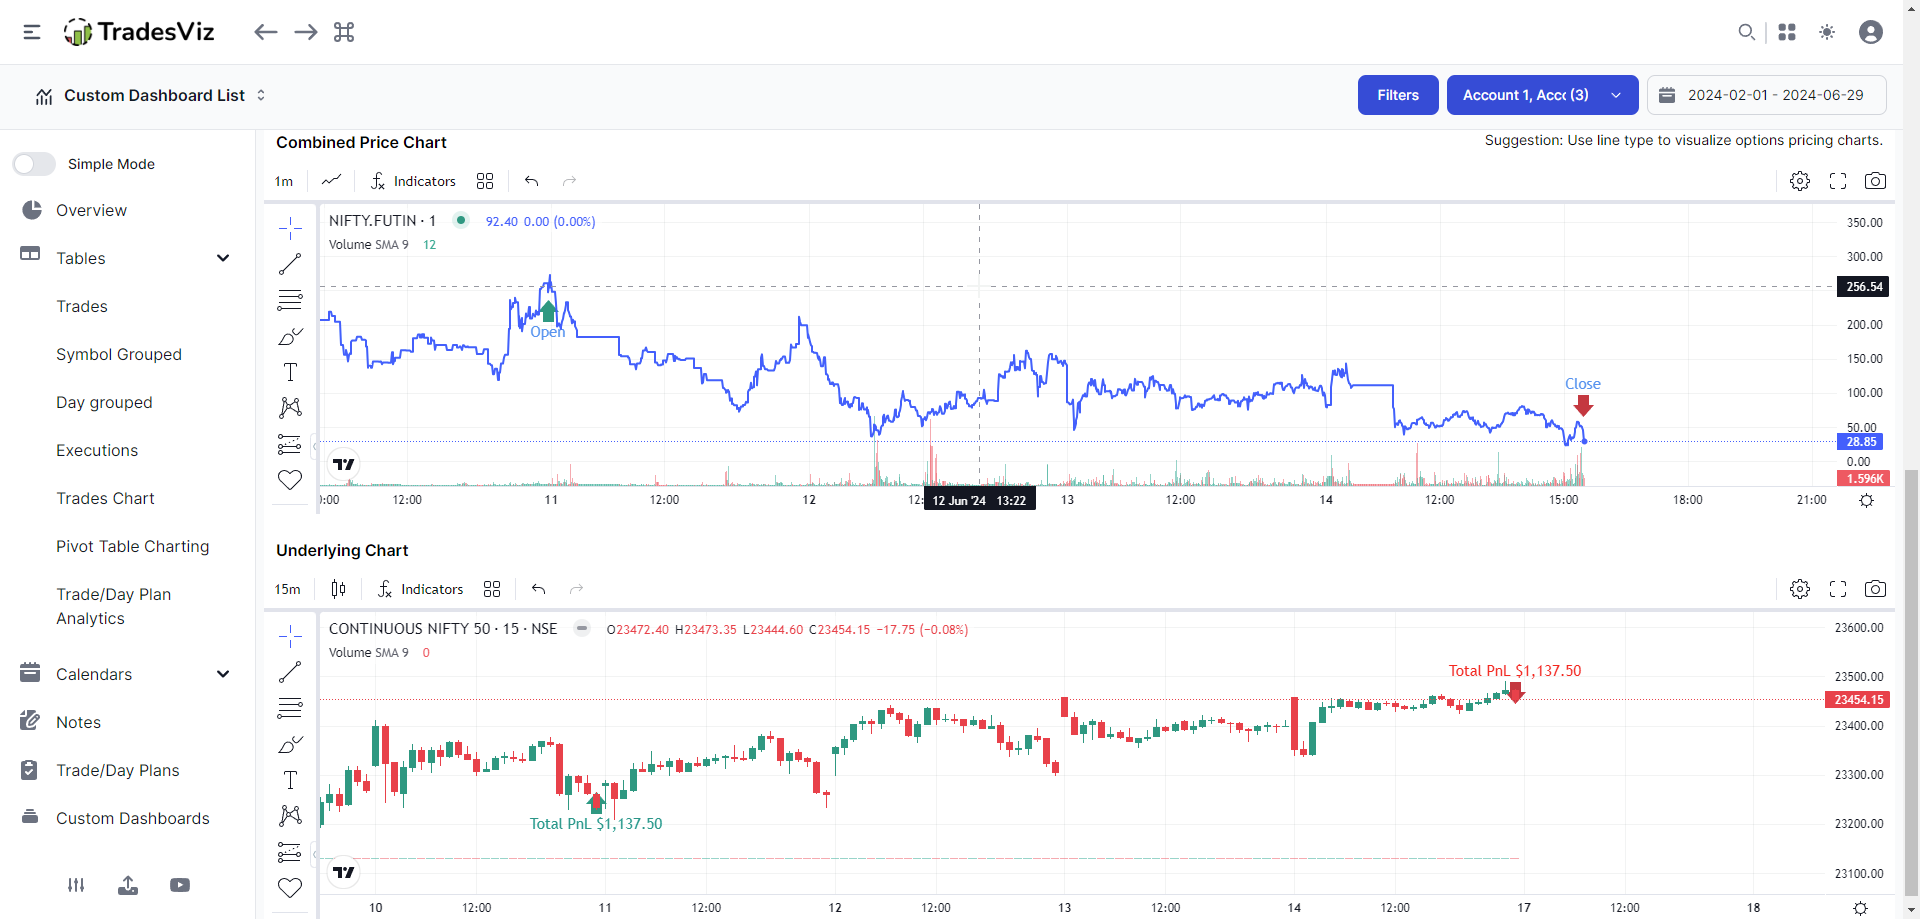
Explore more here: https://www.tradesviz.com/blog/nse-options-charts/
Update Jan 2026
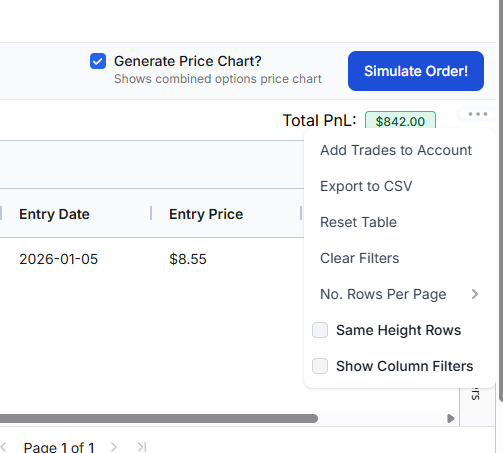
You can now directly add your trades/execution to your trading account when backtesting to write notes on them or even track a trading account of simulated trades. All you have to do after running the simulation is click on the 3 lines icon near the "Total pnl" section of the executions table and click on "Add Trades to Account". Make sure only 1 trading account is selected globally and confirm the prompt that appears.
Update May 2026
The Options Execution Simulator now includes major workflow and visualization upgrades for multi-leg strategy testing:
- Support for mixed simulations with stock + options legs in a single strategy.
- A dedicated Running PnL (Entry to Exit) chart to visualize how the full position evolved over time.
- Clearer chart layout and improved date-selection validations for a smoother backtesting flow.
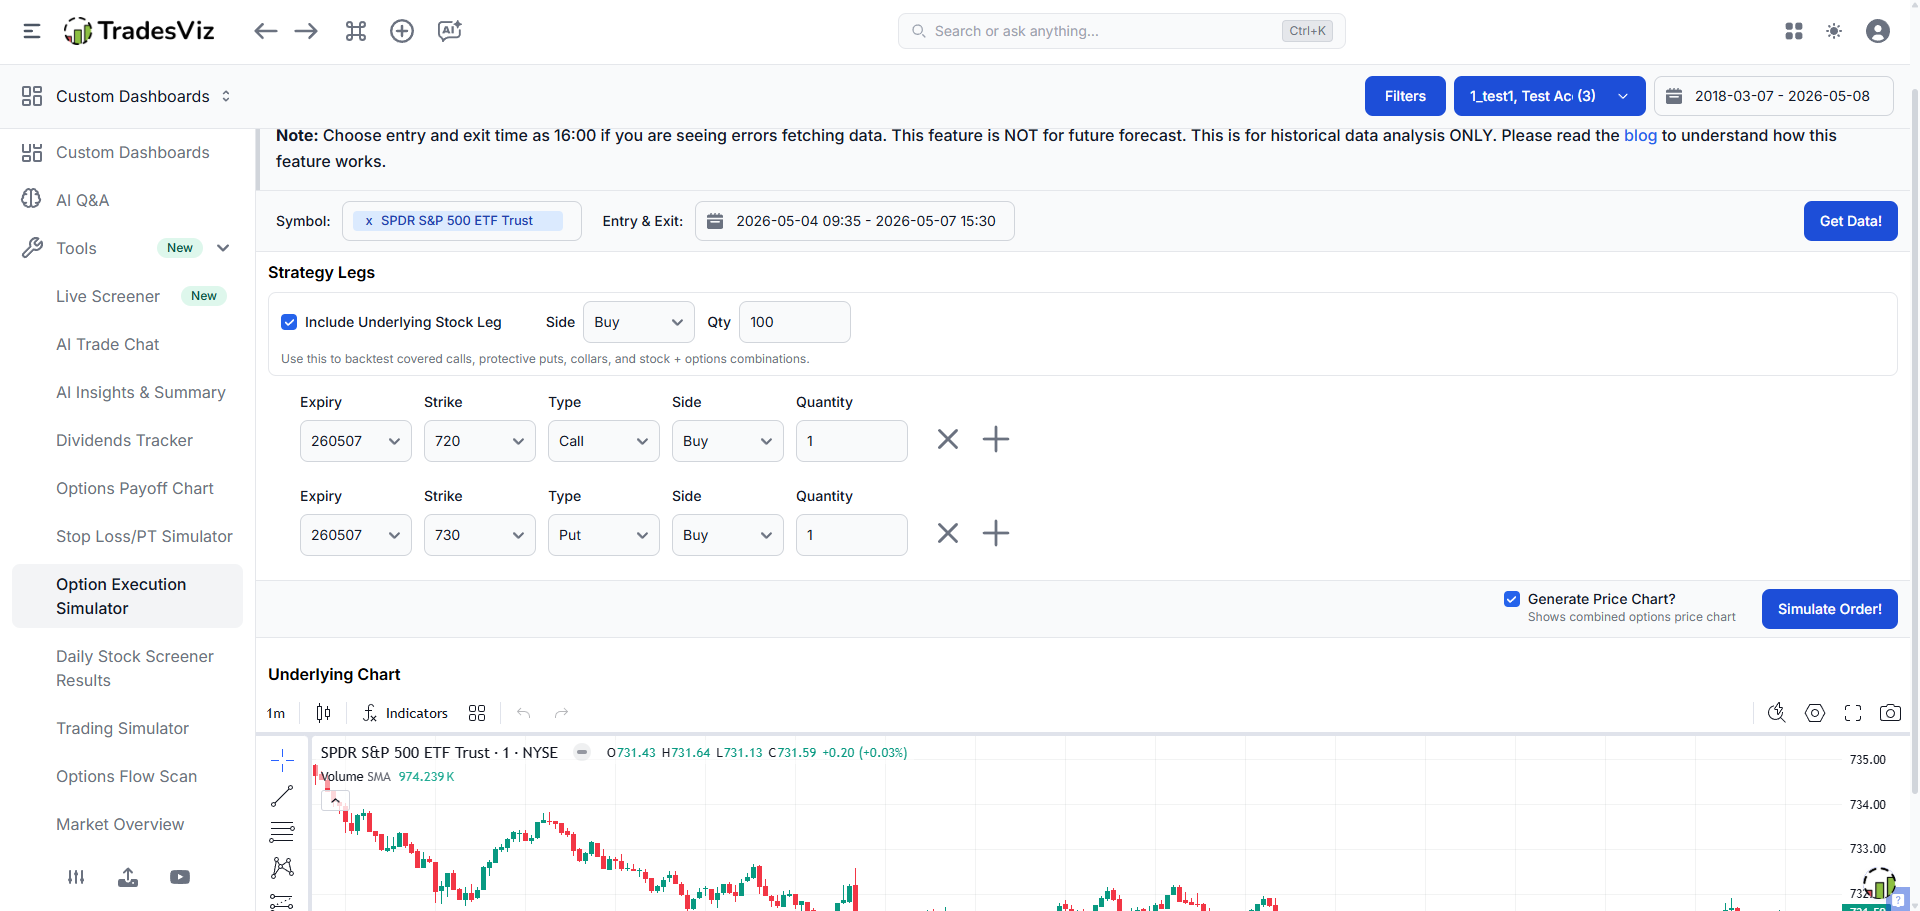
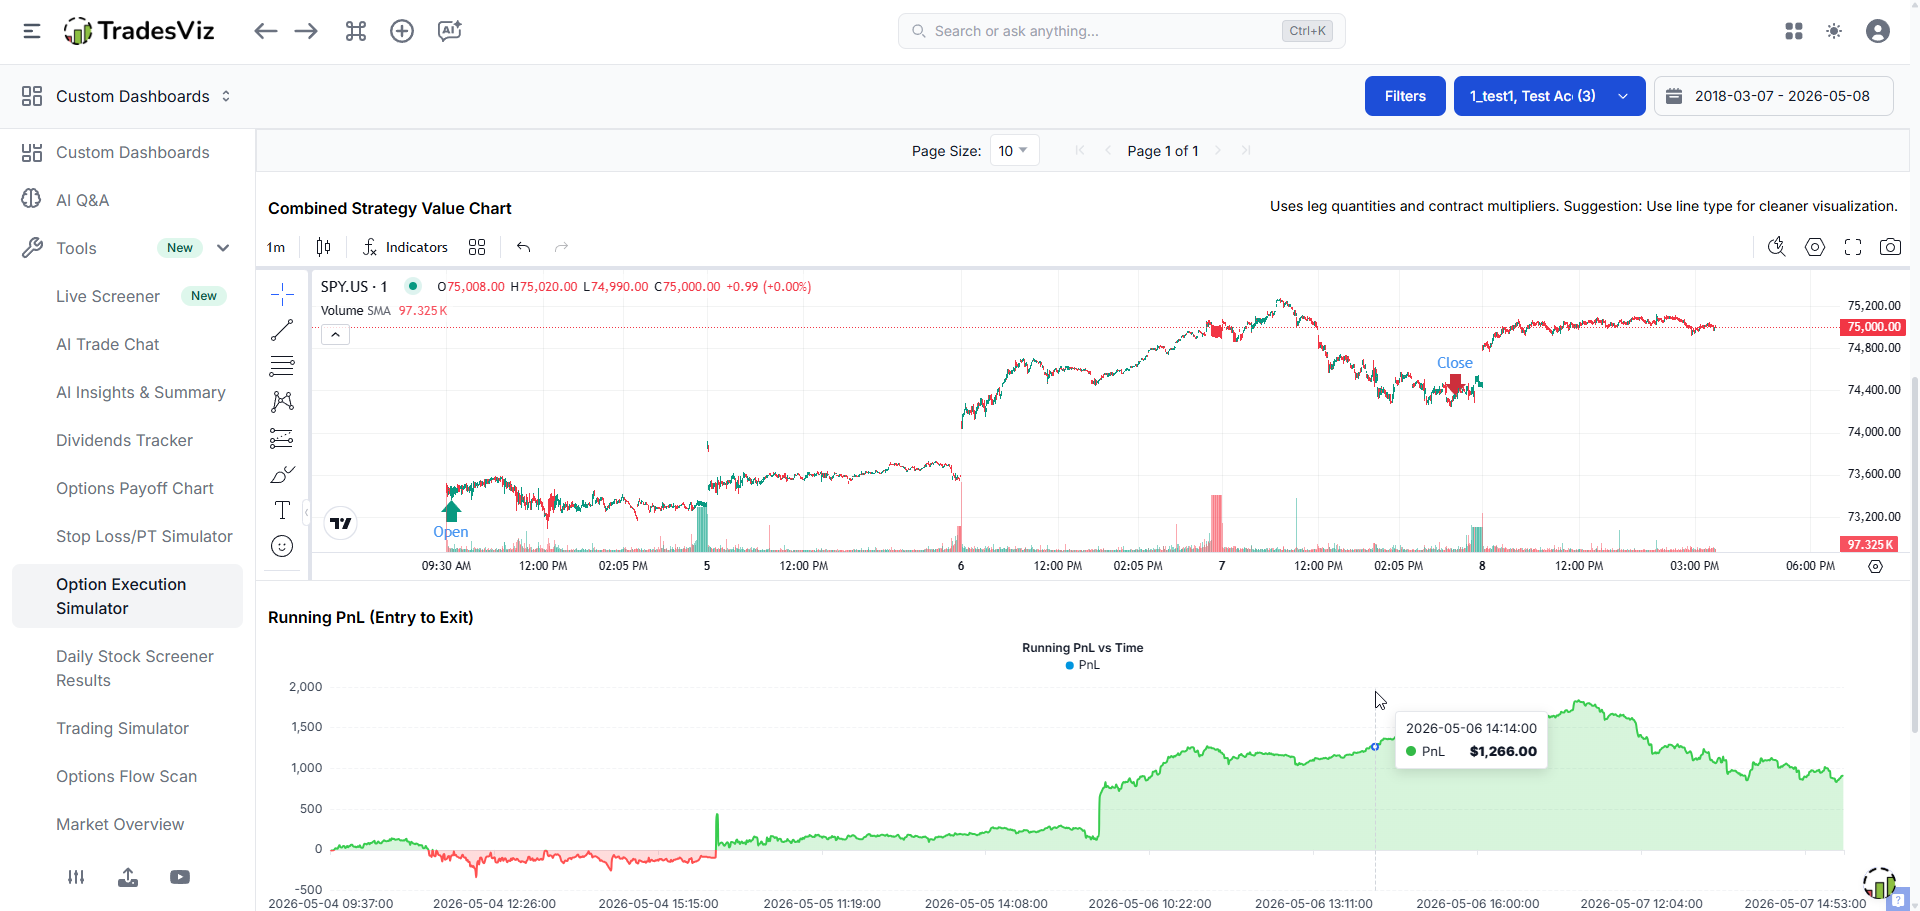
This update makes it much easier to evaluate covered calls, protective puts, hedged stock positions, and other hybrid structures from one view.
Update Aug 2026: Analyze the whole path of a position
The Option Execution Simulator has been rebuilt around the part of a backtest that an entry-to-exit total cannot explain: what happened while the position was open? You can still price a custom single-leg, multi-leg or stock-plus-options position over one historical window. The new workspace makes that position faster to build and shows its opportunity, drawdown, timing and data quality in much more detail.
Build strategies with relative contracts
Start from one of 18 strategy templates - including verticals, iron condors, butterflies, calendars, diagonals, straddles, strangles, covered calls, collars, ratio spreads and PMCCs - or continue adding legs manually. Templates only populate the builder, so every leg remains visible and editable.
- Relative strikes: choose exact, ATM, ATM plus or minus a number of strikes, a percentage or a point distance, or the contract closest to a target premium.
- Relative expiries: choose an exact expiry, 0DTE, 1DTE, the nearest weekly or monthly expiry, or a target DTE.
- Resolved-contract chips: each relative rule shows the exact strike, expiry and DTE selected from the real chain at your entry timestamp.
- Real-chain validation: templates and leg controls stay disabled until Load Contracts returns a usable chain, so an old or demo contract cannot silently enter the analysis.
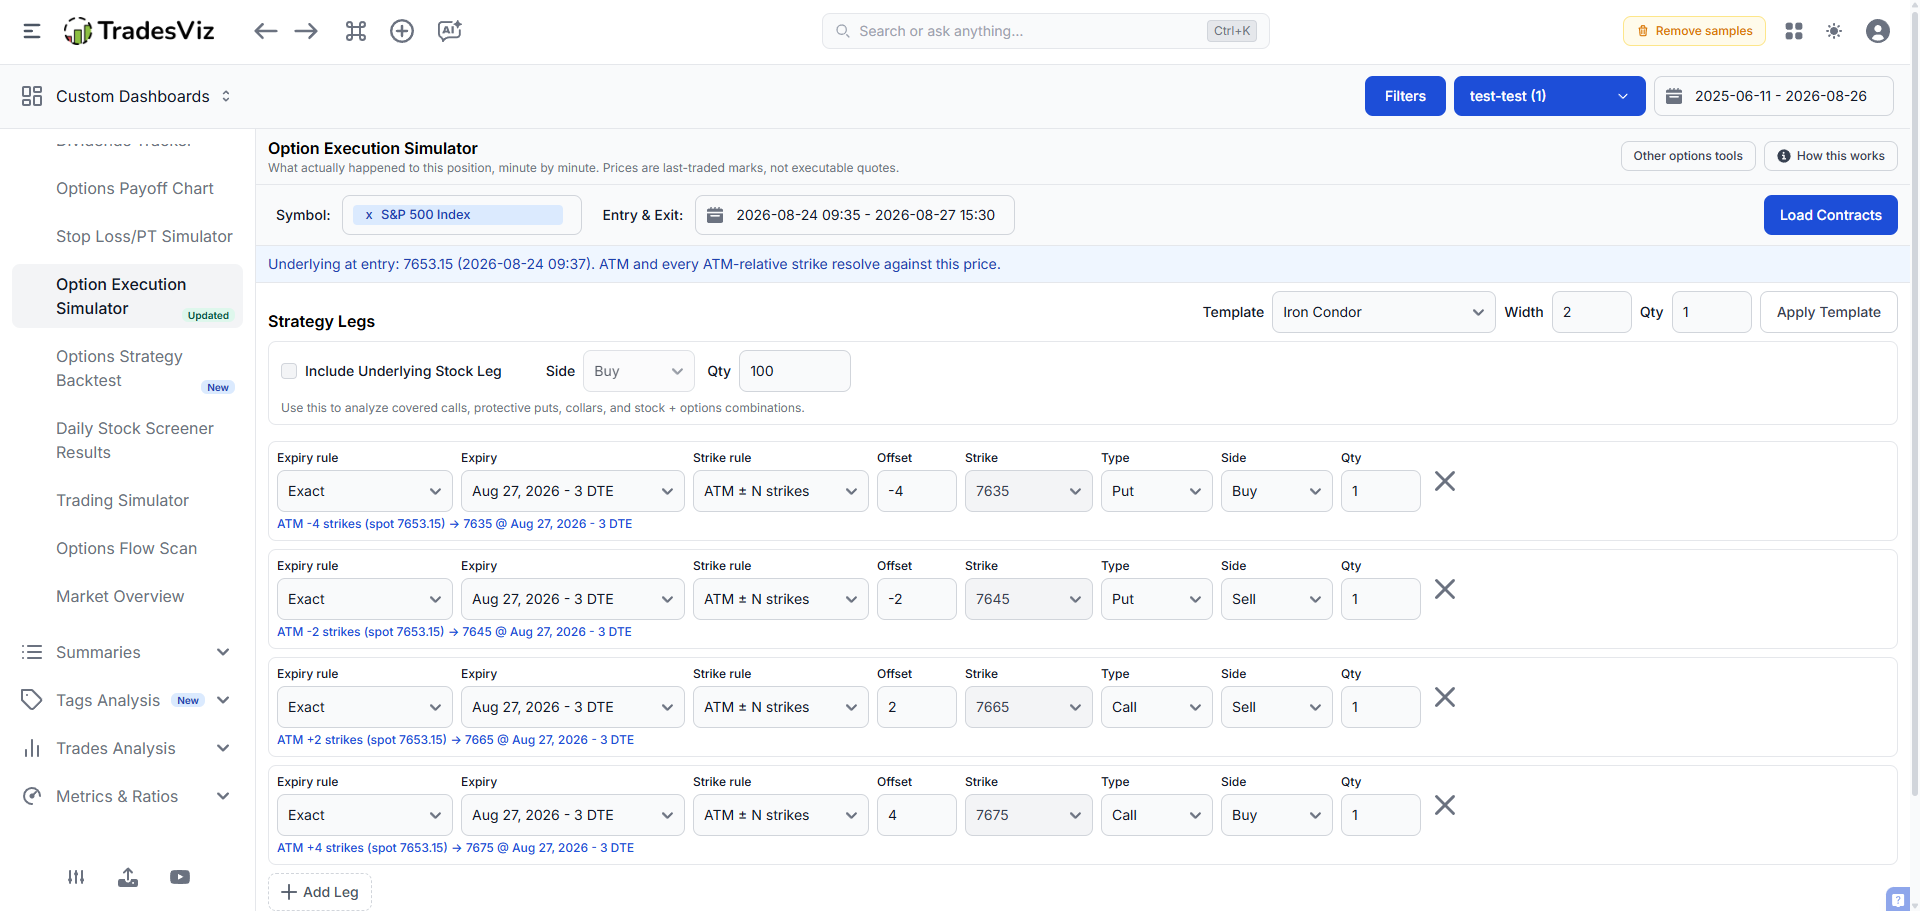
An Iron Condor template resolved against the underlying price at entry. Every rule remains editable, and the blue line beneath each leg confirms the exact contract selected.
Include commissions and slippage
Open Commissions & Slippage to enter a per-contract commission, a per-share commission for an underlying stock leg, and either fixed-premium or percentage slippage. Costs are charged on entry and exit and applied adversely to both long and short legs. Changing them re-prices the results immediately, so you can compare gross and net outcomes without fetching the historical position again.
See the result from four angles
- Overview: review entry debit or credit, exit value, gross and net PnL, maximum open profit, maximum adverse excursion, capture ratio, best available exit, time underwater, time in profit, underlying move, best and worst leg, and the theoretical result if held to expiry.
- Path: inspect an exit-time sweep showing the PnL that would have been realized if the position were closed at each available bar. The chart marks the best available exit and the exit you actually selected, alongside the combined strategy value chart.
- Legs: compare each contract's entry, exit and contribution to the total. Mark-quality data shows how much of the hold contained an actual trade and where the path relied on a carried-forward mark.
- Underlying: keep the underlying chart separate from the position-path analysis when you want more chart space.
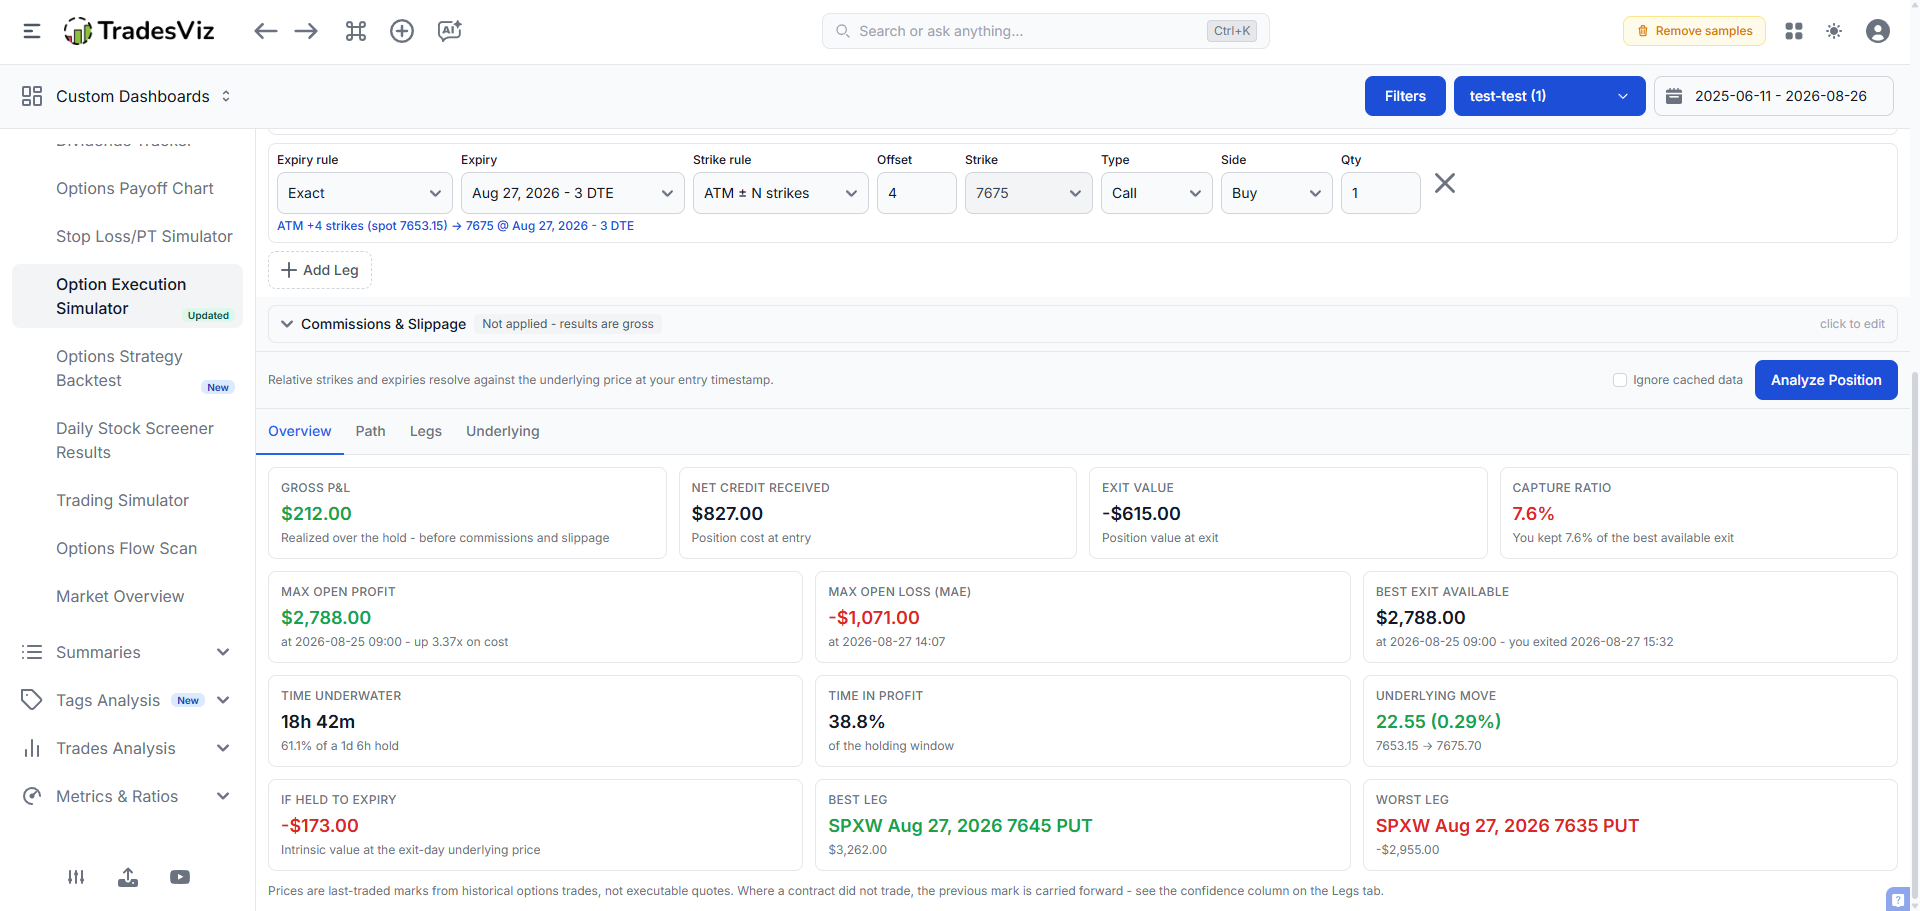
The Overview turns one final PnL number into a fuller review of opportunity, drawdown, time in profit, time underwater and leg contribution.
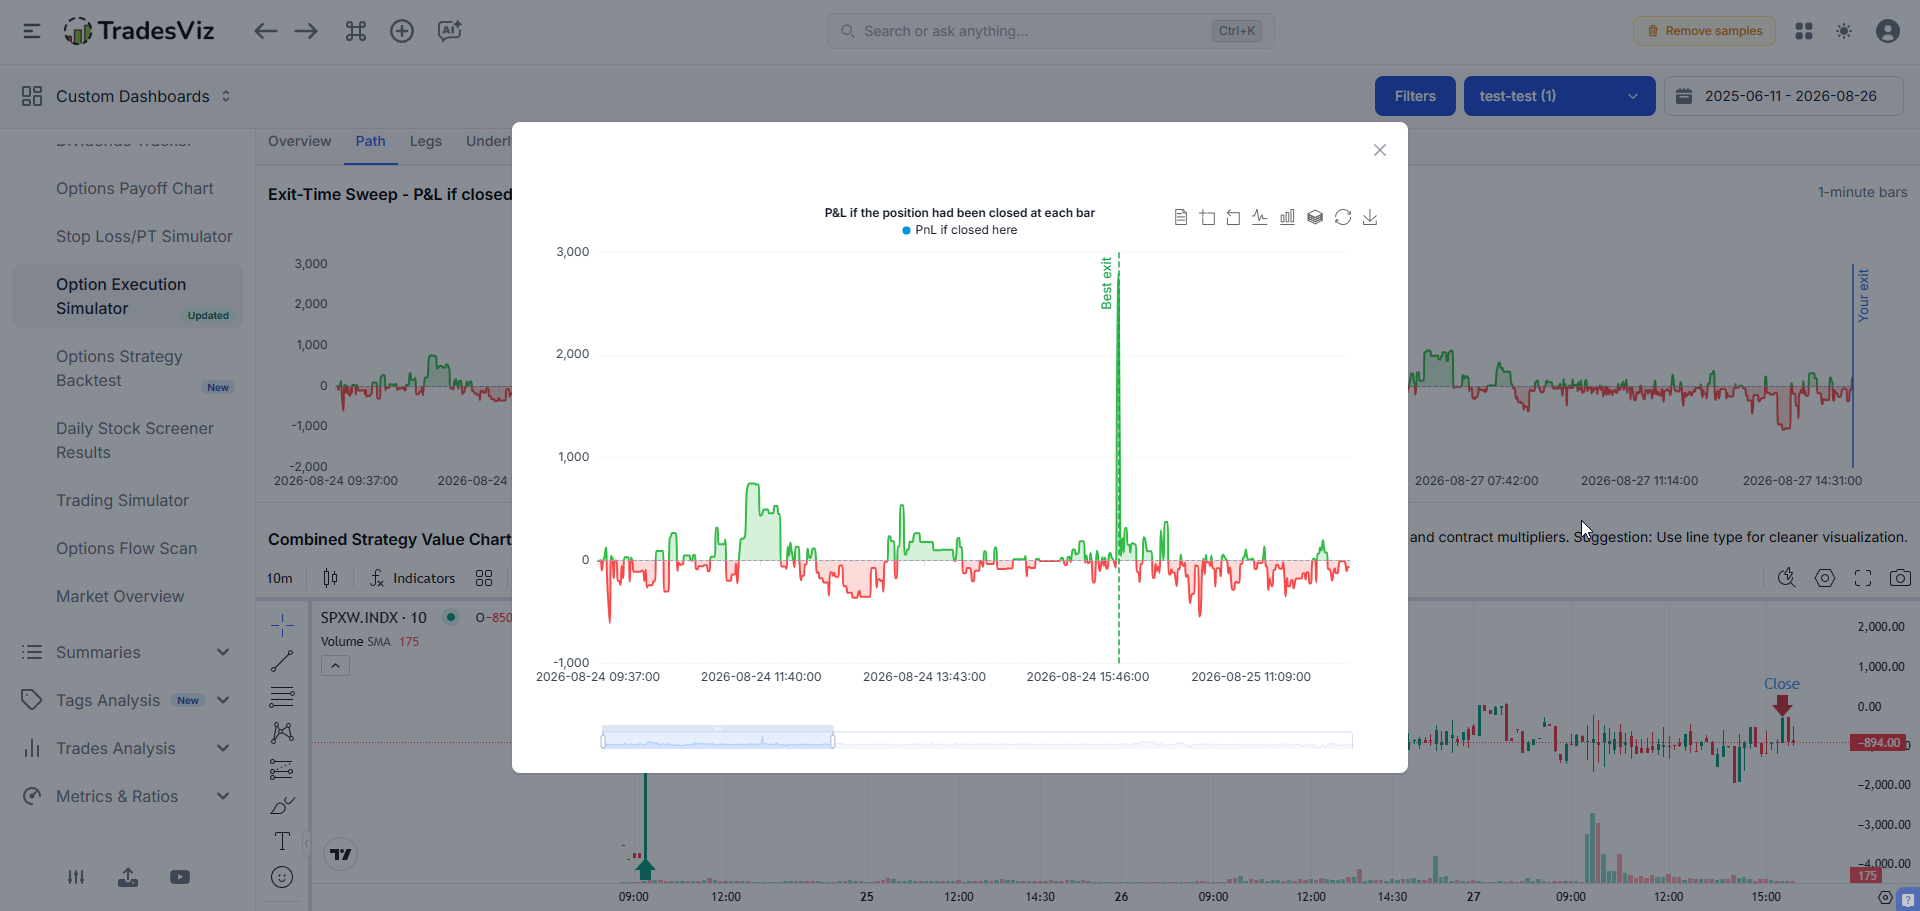
Expand the exit-time sweep to inspect the position bar by bar and compare the best available exit with the exit you selected.
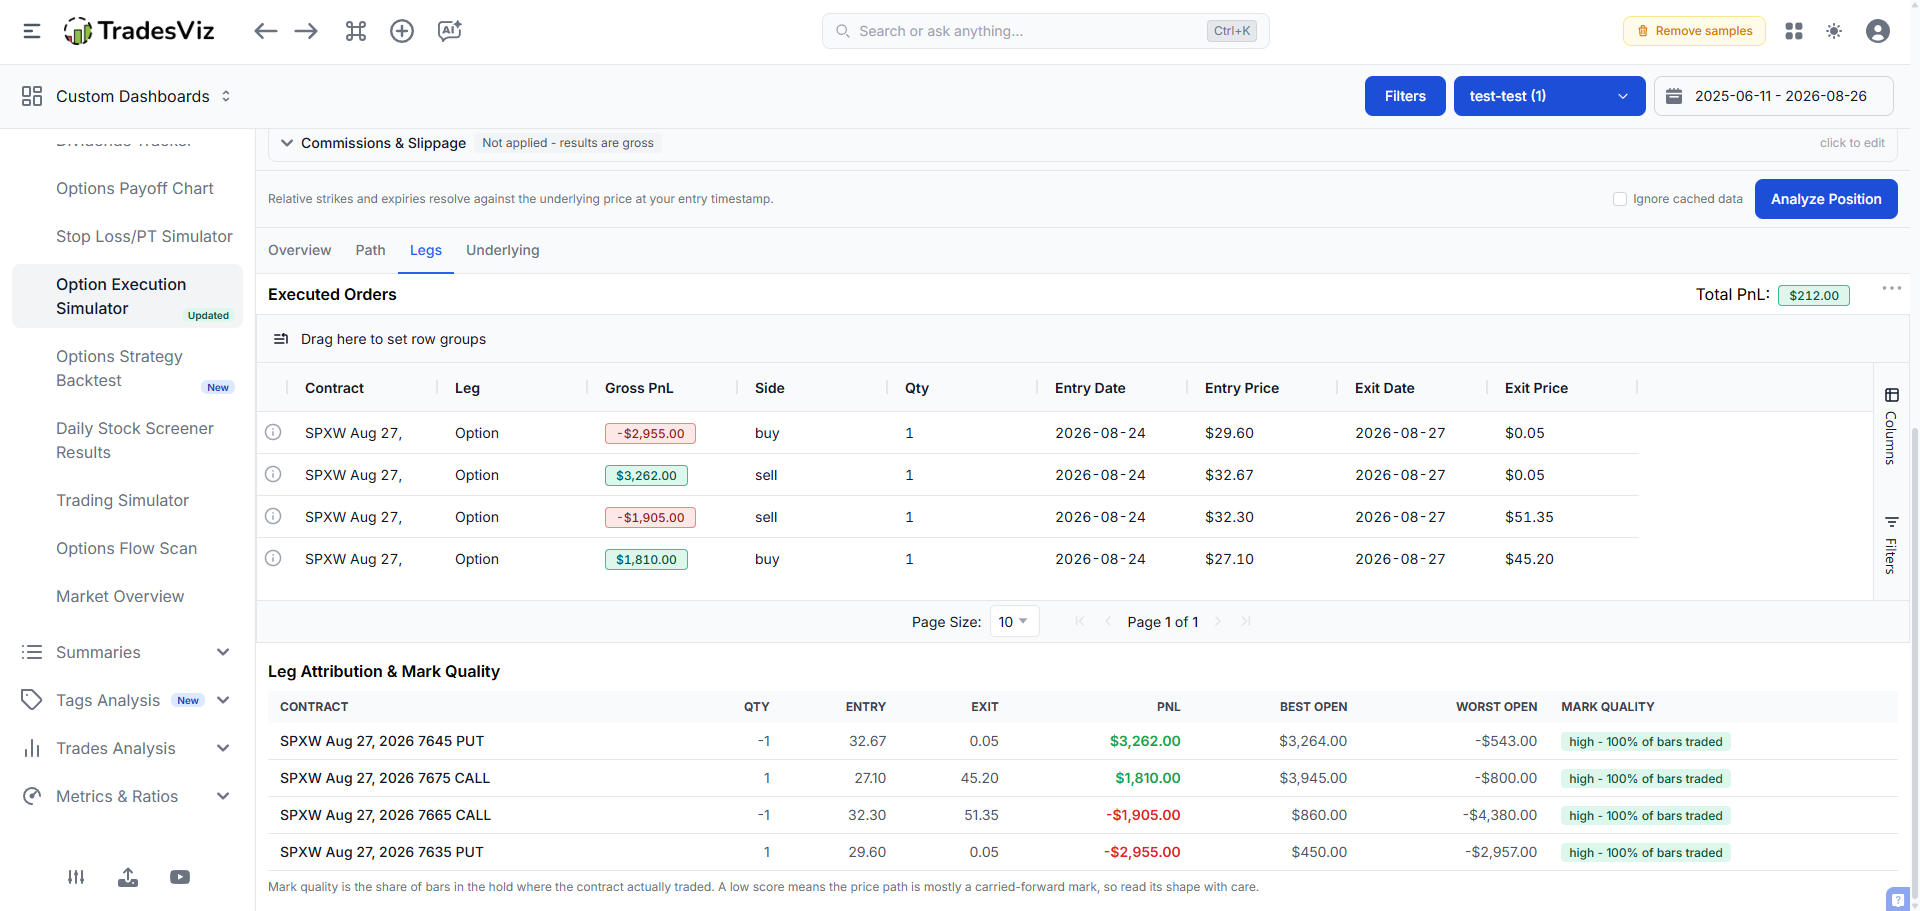
The Legs tab separates each contract's contribution and shows whether its path came from frequent trades or carried-forward marks.
Current workflow
- Open Tools > Option Execution Simulator.
- Select a symbol and one historical entry/exit window, then click Load Contracts.
- Apply a strategy template or build up to eight option legs manually. Add a stock leg when the structure requires one.
- Confirm the resolved strikes and expiries, then add commission and slippage assumptions if needed.
- Click Analyze Position.
- Review the Overview, Path, Legs and Underlying tabs. From the Legs table menu, you can still add the simulated executions to the selected journal account.
The tool chooser at the top also makes the boundary between the TradesViz options tools clearer: use this simulator to analyze one historical position, the Options Chain Simulator to practice placing orders as a past session unfolds, the Options Payoff Chart to model expiry payoff, or the Options Strategy Backtester to repeat one rule across many dates.
Important data note: the position path uses historical last-traded options marks. If a contract does not trade on a bar, the previous mark is carried forward. These are not executable quotes, so always read low mark-quality legs with care. The simulator is historical analysis, not a forecast.