Your trades - organized, visualized, and crystal clear. 📊✨
With the Symbol Grouped View in the TradesViz Custom Dashboard, you can instantly see performance by ticker, track total PnL, win rates, trade durations, and volumes
All in one clean, customizable table.
No spreadsheets. No chaos. Just pure trading insight at a glance.
Explore Symbol Grouped View in TradesViz and take control of your trading data 👇
The options flow screener for December 26, 2025 shows strong selling activity in split trades over the last two days, led by consistent moves across tech, retail, and energy names.
$MU topped the list with a 5.75 percent increase to 239 total trades, showing active institutional rotation and volume spikes into the year’s end. $RCL followed with a massive 3,550 percent surge to 146, reflecting heavy turnover in leisure and travel-related contracts. $AAPL rose 13.33 percent to 102, while $PM posted a 3,100 percent jump to 96, indicating elevated option selling in large-cap consumer names. $C and $TQQQ saw strong increases of 60 and 566.67 percent respectively, marking steady movement in financials and leveraged ETFs.
$COST climbed 217.65 percent to 54, $PBR surged 2,250 percent to 47, $IREN gained 131.58 percent to 44, and $NKE advanced 32.14 percent to 37, underscoring widespread selling pressure across multiple sectors.
The $MU chart shows steady aggregate premium flow through the last two sessions, with a balanced mix of bullish and bearish activity ending at mildly higher price levels, suggesting profit-taking rather than directional weakness.
The options flow for the previous week shows strong institutional activity concentrated in $GDX and $EEM, with multiple large call sweeps targeting mid-January 2026 expirations.
$GDX dominated the flow with numerous buy sweeps at strikes between $35 and $55. The largest included $208M and $179M call sweeps at the $50 and $55 strikes, followed by sequences of $155M, $149M, and $118M, indicating sustained bullish sentiment in gold-related assets. A few sell sweeps appeared at $35 and $50 strikes, but overall call buying remained dominant throughout the period.
$EEM recorded consistent call buying across $45 and $48 strikes, with premiums ranging from $228M to $100M, showing broad exposure to emerging markets. $WOLF1 also appeared at the top with back-to-back put buy sweeps at $100 and $95 strikes expiring December 19, 2025, each worth $1.28M, possibly short-term hedges or profit-taking plays.
Overall, the options flow highlights large-scale accumulation of $GDX and $EEM calls, reflecting bullish positioning in precious metals and emerging market sectors, while moderate $WOLF1 put activity suggests cautious portfolio adjustments heading into late December.
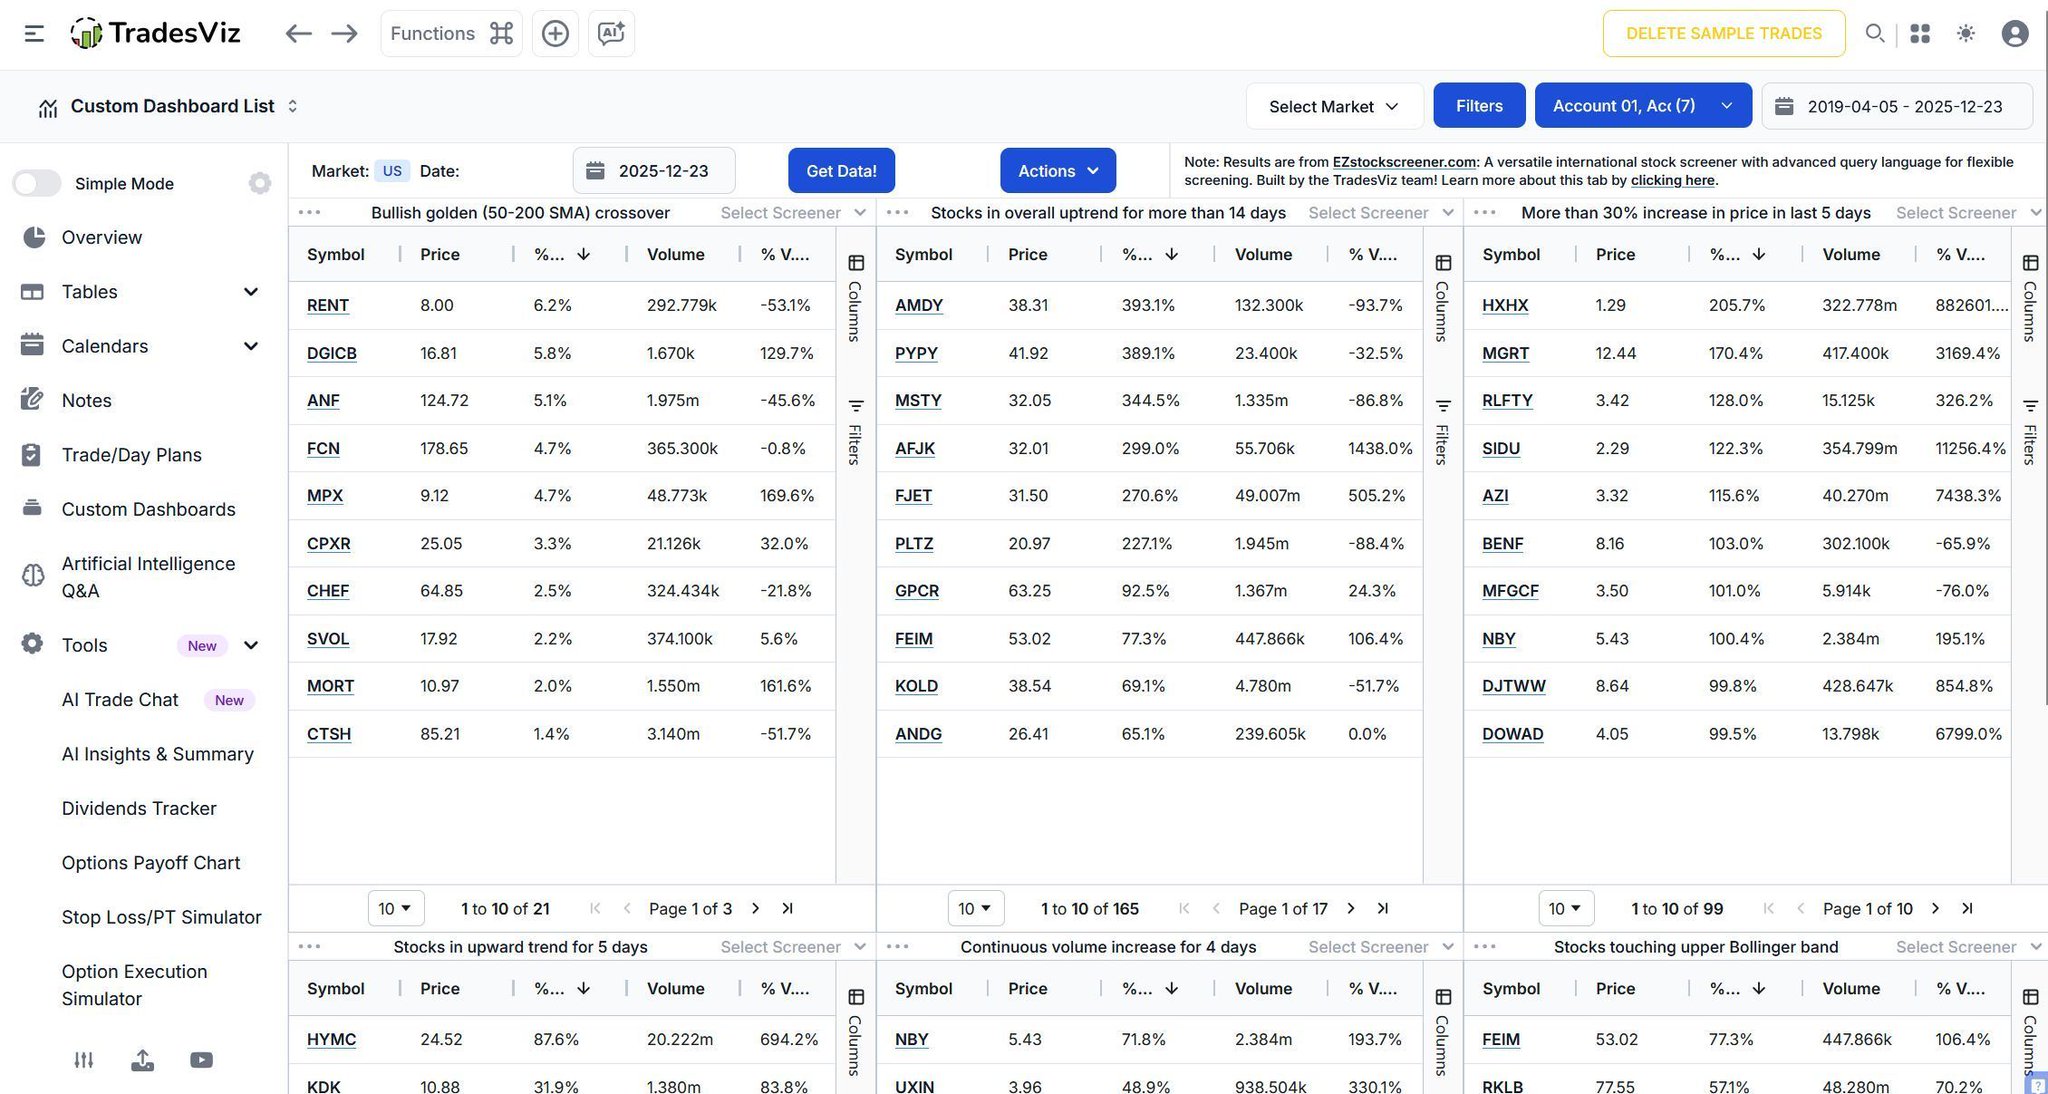
The stock screener for December 26, 2025 highlights strong price momentum across mid and small cap stocks, with multiple names maintaining consistent five day uptrends and several posting single day breakouts supported by massive volume surges.
In the five day upward trend category, $HYMC led with a 78.3 percent gain to 24.96 on 6.47M volume, up 125.4 percent from prior sessions. $ISSC followed with a 77.6 percent rise to 19.52, while $GLSI increased 60.2 percent to 17.21 with a 153.6 percent jump in activity. $IPSC added 55.9 percent to 1.04, $CMTL gained 55.8 percent, and $FBGL rose 47.1 percent. $MGNC advanced 36 percent, $HQI climbed 32 percent on 68.5 percent higher volume, and $FEIM and $METC rounded out the list with gains of 31.5 and 30 percent respectively.
In the list of stocks up more than 20 percent in one day, $SOBR topped with an 82.3 percent surge to 2.37 on massive 143.19M volume, up 14,772.5 percent. $OMER followed with a 75.5 percent rise to 15.36, $EUDA advanced 44.3 percent, and $DVAX gained 38.2 percent on 30.7M shares traded. $INDP rose 35.8 percent, $SIDU added 33.3 percent, and $IZM climbed 26.7 percent with over 824.9K volume. $EWTX, $CREV, and $ASPCU posted increases between 20.9 and 24.8 percent, showing strong short-term spikes.
Overall, the December 26 screener reflects widespread bullish sentiment, with $HYMC, $ISSC, and $SOBR leading upward momentum supported by explosive trading volume heading into the final week of the year.
Here is to a fresh start and new opportunities in the markets. 🥂 🎂
We are grateful to have you with us on this journey!
🎁 Grab up the holiday special 50% off your subscription.
🎟️ Code TVNEWYEAR26.
Let's make this year count. 🚀 ✨
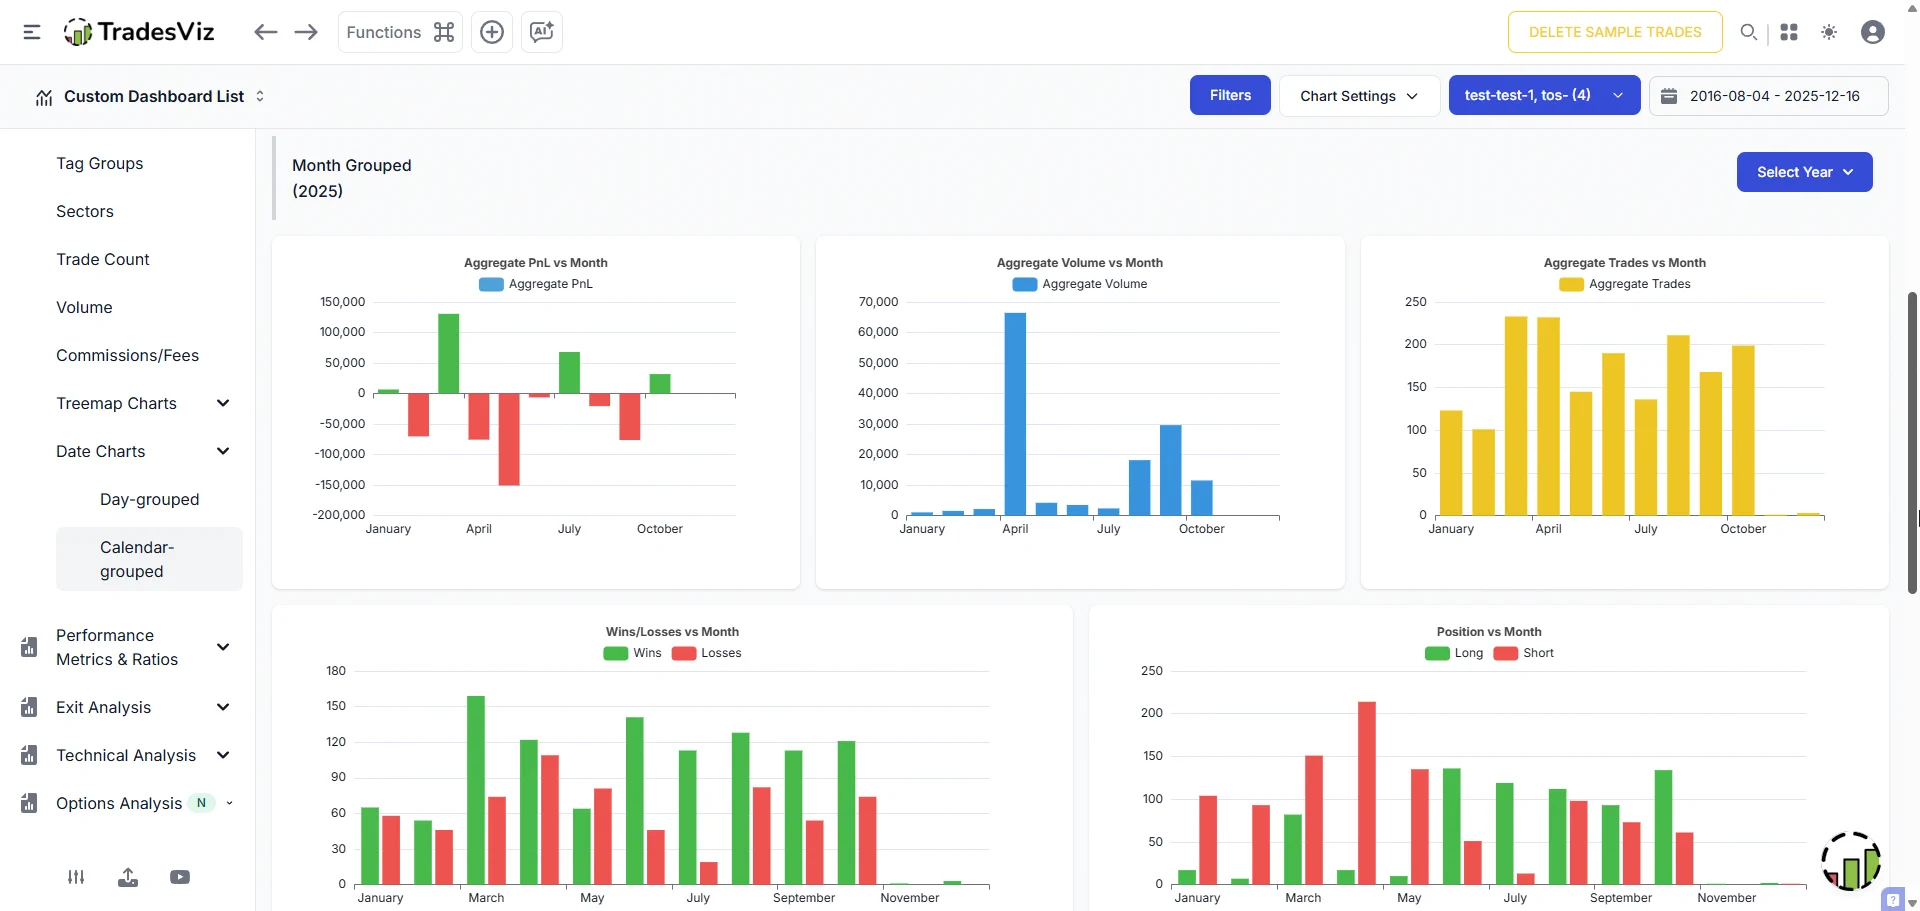
It's time to check the Date charts in your TradesViz trading journal dashboard.
View summary (trade pnl, count, volume, win-rate, long/short) every year > month > day in a single click.
Use this to review your trades this week👇
All your trading stats. One powerful view. ⚡📊
👉 Track multiple accounts
👉 Compare strategies
👉 Visualize cumulative PnL
All in one place!
50% TOTAL OFF EVERYTHING. 🎅
🎟️ Use Code: TVNEWYEAR26
$360 ❌ $270 ❌ $188 ✅
The ultimate trading journal just hit its best price of the year.
Upgrade your trading desk with the all-in-one tool PROs use:
✅ AI Trade Analysis
✅ Realistic Simulator
✅ Advanced Journaling
✅ Custom Charting
+ MORE!
25%+30% off: TVNEWYEAR25 🎉
Your data, your insights, your design. 🎯
The Custom Dashboard - Win Rate Statistics Template in TradesViz gives you complete flexibility to visualize your performance your way.
Track win/loss percentages by price, volume, or duration, add tables, charts, and widgets - and tailor every element to match your unique trading style.
It’s fully customizable analytics that turns raw numbers into real understanding.
Build your Custom Win Rate Dashboard in TradesViz and see exactly where you trade best 👇
Find the strongest setups in seconds. ⚡📊
The Stock Screener in TradesViz brings multiple technical filters together
Moving average crossovers, breakout movers, volume surges, and trend continuations - all on one powerful screen.
Instantly spot stocks aligning with your strategy and market conditions.
Explore the Screeners in TradesViz and see what’s moving today 👇