
TradesViz
Trading is personal, and your journal should be too. Whether you want a simple overview or a deep dive,

TradesViz
Trading is personal, and your journal should be too. Whether you want a simple overview or a deep dive,
TradesViz
Stop guessing "What If?" Start knowing for sure. ⏳ Every trader has looked at a closed trade and wondered, "What if I used a 20-point stop instead of 10?" The Stop Loss & Profit Target Simulator is your personal trading time machine. It lets you "Rewind, Rethink, and Refine" your past performance by applying different exit rules to your historical data. Explore alternate outcomes and see exactly how much money you left on the table.

TradesViz
A goal without a tracker is just a wish. 🌠 It’s easy to say "I want to be profitable." It’s harder to track the specific metrics that get you there. The Goals Dashboard turns your vague ambitions into concrete data points. In this view, the trader can instantly see their monthly "Report Card." While February 2022 was a stellar month with a 97% Goal Completion rate (Green Gauge), November 2021 was a struggle at only 30% (Red Gauge). Stop lying to yourself. Let the data keep you honest.

TradesViz
Spot the divergence before it happens. 📉📈 Markets are interconnected. Watching a single asset in isolation leaves you blind to the broader context. This 4-screen setup allows you to track correlations in real-time. Use the "Sync Charts" button at the top to ensure all four simulations move in perfect lock-step, allowing you to see the exact moment one asset breaks down while the others hold up. Don't just trade the ticker. Trade the market.

TradesViz
Your edge isn't random. It's recurring. 🔄 Why guess what to trade today when your data already knows? The AI Insights scans your entire history to find the setups that statistically work for you. In this report, the AI explicitly identifies a "favorable window" for ES.FUTUS on Thursday evenings around 20:31, where the trader has been historically profitable. Conversely, it flags a warning for XAUUSD, noting that similar setups resulted in losses previously. Trade where you win. Avoid where you lose.

TradesViz
The Feb 6 sweep screen showed a broad surge in two‑day call buying across megacap tech and digital assets. $AMZN led with a 228% increase in sweep trades, totaling roughly 10 K contracts, confirming a decisive shift in accumulation. The intraday trend chart revealed heavy morning inflows followed by compression into the close as aggregate premium flow stabilized near 7 million. $MSTR topped the percentage list with a 297% spike, while $GOOG and $GOOGL both posted gains above 200%, reflecting synchronized buildup across the Alphabet complex. $IBIT sustained elevated crypto‑linked flow at 125%, maintaining its pattern of risk‑on positioning. $MSFT and $AAPL added steadier, mid‑range increases around 25–40%, complementing renewed rotation into $AMD and $ORCL, up 41% and 83% respectively. $TSLA’s 22% advance rounded out the high‑liquidity group as traders added moderate exposure after prior volatility. The alignment of expanding sweep volumes across both tech and crypto names signals coordinated institutional accumulation rather than isolated momentum chasing. When top‑tier equities move in unison with digital proxies, it often reflects unified positioning for beta expansion into the next risk cycle.

TradesViz
The Feb 6 options tape showed concentrated institutional flow across commodities and energy, led by clear rotation in $GLD and $ET. $GLD dominated early with two large sweeps—$450C and $460C expiring Feb 20—totaling about 100 million in combined premium. The matching timing of both trades suggests structured premium recycling within gold exposure rather than speculative positioning. $ET followed with a sequence of buy sweeps near the Jan 2027 $13C line, aggregating roughly 180 million in premium. Each print ranged between 16 and 21 million, indicating systematic accumulation that continues to build long‑dated energy exposure. Elsewhere, $MU printed a 16 million sell sweep on the Mar 2026 $350P and $TSLA showed a 22 million split on the Mar 2026 $430P, both reflecting downside hedging after recent gains. Moderate flow appeared in $SLV, $ALB, and $NOW around 10–12 million each, extending activity into metals, lithium, and software.

TradesViz
The Feb 6 technical screen showed sustained multi‑day momentum alongside fresh trend confirmations across several names. **Continuous Higher Highs + Green for 4 Days:** $BMNZ led with a 63.2% advance as volume approached 2M shares, confirming strong but controlled participation. $ETHD and $HOOZ followed with 56.6% and 50.4% gains, showing localized strength in digital and speculative themes. $CRCD, $PLX, and $TOYO each printed 38–46% moves with volume expansions above 50%, while $DVA maintained consistency at +32.5% on rising institutional turnover. **Bullish Golden (50–200 SMA) Crossovers:** Momentum extended into new trend signals, led by $MSM (+12.6%), $OLN (+12.0%), and $FBIN (+11.5%), all supported by triple‑digit volume growth — a textbook sign of sustainable upside. $FRME, $SKM, and $SBC added steady confirmation as crossovers aligned with broad market participation. The alignment of multi‑session gains and SMA crossovers points to healthy continuation rather than exhaustion. Broad participation across industries signals expanding breadth — the kind of technical backdrop that supports sustained accumulation into the mid‑month rotation.

TradesViz
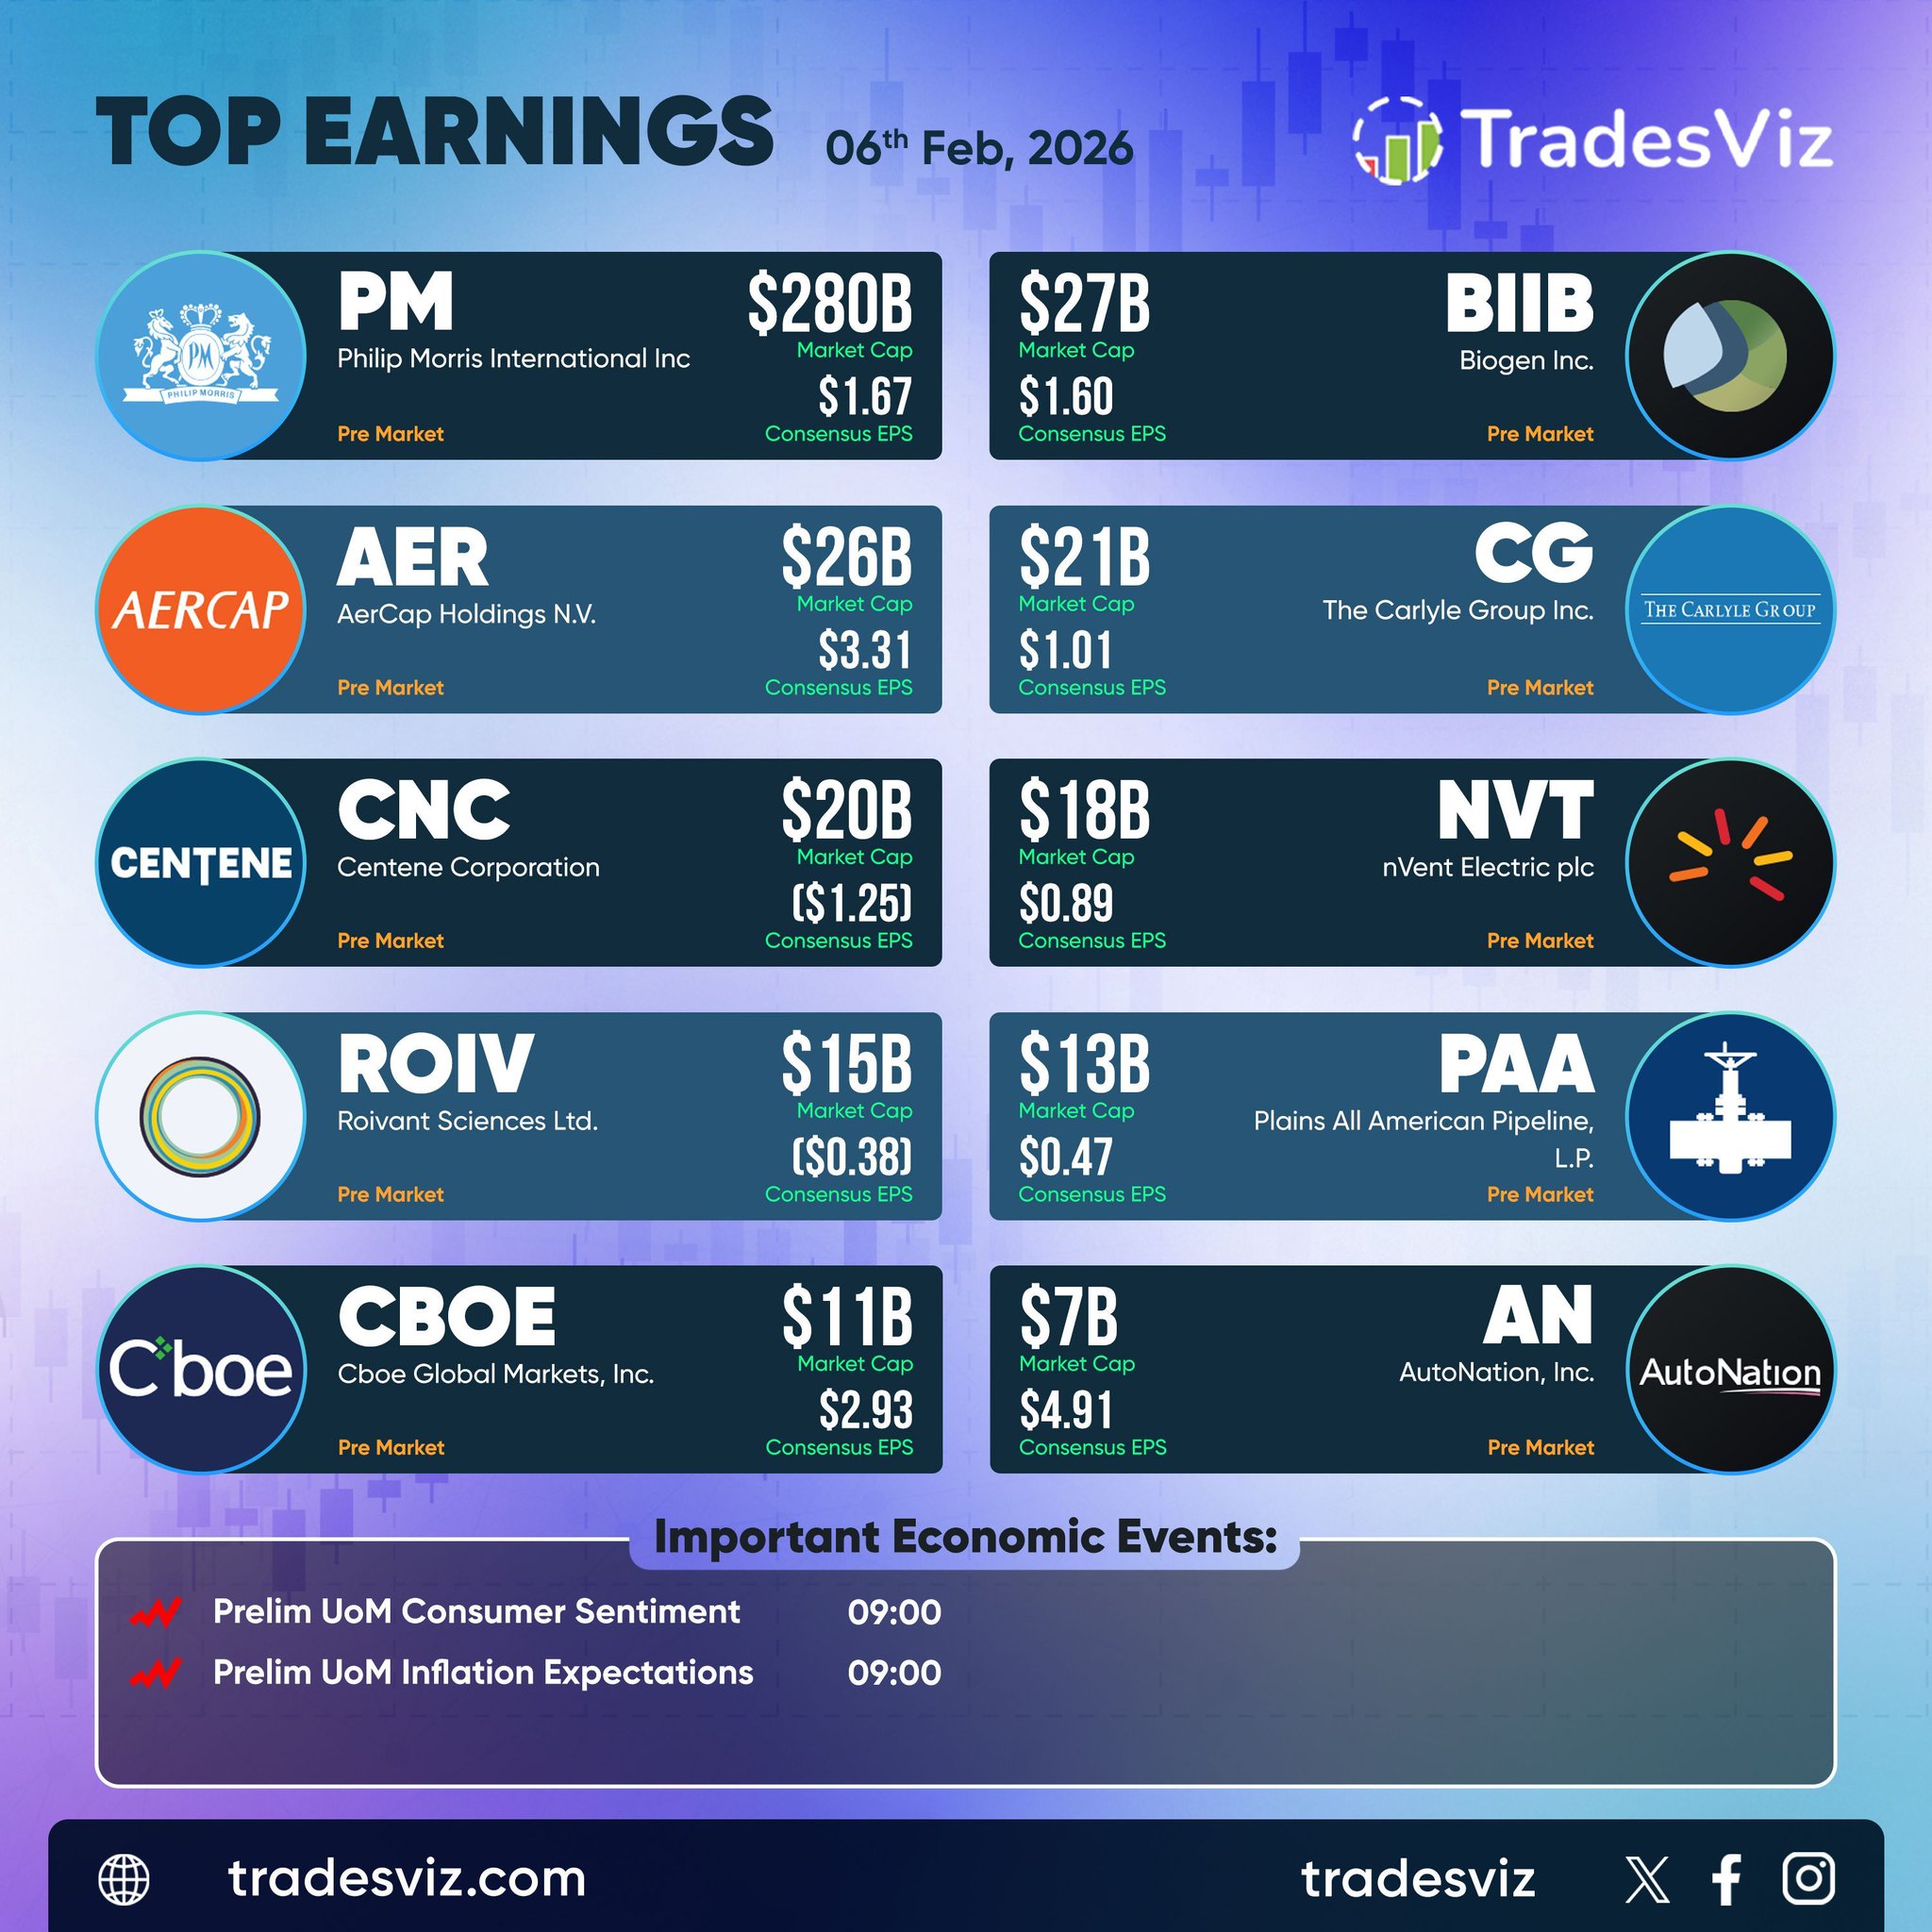
Earnings for Feb 6 bring a balanced mix across healthcare, industrials, and financials. $PM leads the pre‑market slate at a $280B market cap with a $1.67 EPS estimate, setting the tone for global consumer staples. $BIIB follows at $27B with a $1.60 EPS forecast, highlighting continued focus on large‑cap biotech. $AER and $CG report early, providing key reads on leasing and asset management with $3.31 and $1.01 EPS expectations. $CNC and $NVT add exposure to managed care and industrial engineering, forecasting $1.25 and $0.89 respectively, while $ROIV posts a modest ($0.38) against a $15B valuation, rounding out healthcare innovation. $CBOE and $AN close the list with $2.93 and $4.91 EPS targets, representing capital markets and consumer cyclicals. $PAA adds the energy component with a $0.47 estimate, offering insight into midstream sentiment. Macro focus shifts to UoM Consumer Sentiment and Inflation Expectations at 09:00. Together, these readings and the corporate lineup form a high‑signal view of consumer, industrial, and financial trends into mid‑week trading.
TradesViz
Still paying for a separate simulator? Still paying for a "crypto-only" journal?.... You're just paying a "complexity tax" for tools that do less. TradesViz delivers everything in one interface: • 30,000+ Symbols (including
