Put‑to‑call ratios surged into Jan 20, marking a notable rise in hedging demand across multiple large‑cap names. $UPST led with an extraordinary 20,778% increase in option premium, while $HYG and $HAL followed with 16,060% and 4,455% gains respectively. $INSM also posted a sharp 3,735% spike, signaling concentrated bearish activity in select risk‑tier assets.
$HAL’s chart reflected that sentiment shift, with consistent downside skew and elevated put buying through late January sessions. The increase came alongside muted price follow‑through, highlighting traders securing protection rather than chasing directional exposure.
Broadly, the theme points to renewed caution beneath the surface. When put premiums surge this quickly across unrelated sectors, it often signals portfolio‑level hedging as volatility expectations reset.
Large‑cap names dominated the tape last week as deep‑dated flow clustered around $ABBV and $WOLFI. $ABBV printed a series of repeated sweeps across strikes from $175 to $200 into the Jan ’26 expiry, with total premiums stacked above $600M. The steady cadence across multiple strikes and timestamps signaled organized institutional activity rather than short‑term speculation.
$WOLFI drew heavy put interest across the $15–50 range, totaling more than $240M in notional exposure. The distribution suggests strategic downside hedging alongside selective long accumulation. $TSLA and $MSTR also featured, with notable puts and buys, but at smaller scale.
The flow map reflected size positioning in both large‑cap healthcare and emerging speculative names. Persistent sweeps across expiries this far out typically point to strategic, conviction‑driven allocation rather than near‑term trading noise.
Momentum stayed elevated into Jan 20, with continued volume expansion across multiple leaders. $IBRX extended its run with a 113% gain backed by a near 980% surge in trading volume, while $GLXY and $BAYRY each pushed higher with strong multi‑day accumulation. Several mid‑caps including $TE, $EGY, and $SEED also maintained steady four‑day volume climbs, highlighting sustained transactional interest beneath surface strength.
At the same time, band‑pressure builds intensified. $ASTX, $IREG, and $FIGR all touched their upper Bollinger bands after explosive price and volume moves, a classic marker of stretched momentum. $KLAG and $CIFG showed similar signatures, each posting triple‑digit volume growth alongside double‑digit price expansion.
The alignment of rising volume and repeated band tests points to broad speculative appetite. Persistent participation at these extremes typically signals strong tape conviction, though it can also mark momentum entering a mature phase.
Earnings season carries forward on Jan 20 with a broad mix of tech, industrial, and financial names on deck. $NFLX leads after hours at a $373B market cap with a $0.55 EPS estimate, setting the tone for media and tech. $UAL joins the late session lineup with a $2.98 EPS estimate, adding transportation exposure to the post‑close mix.
Pre‑market focus shifts to financials and cyclicals. $USB, $FITB, and $KEY all report before the bell, giving a detailed read on deposit trends and loan growth expectations. $MMM, $FAST, and $DHI add industrial and housing exposure with earnings forecasts ranging from $0.26 to $1.96 per share.
Together, this docket covers key sectors for Q1 momentum. With heavy representation across banks, builders, and industrials, the session’s commentary will shape early‑year sentiment on credit health and economic durability.
This one chart has more useful insights than your entire 100-page excel sheet of trades.
TradesViz users get it in 2 seconds in their dashboard.
If you are using outdated tools and journals, this is how far behind you are. 😐
From question to insight in seconds. ⏱️
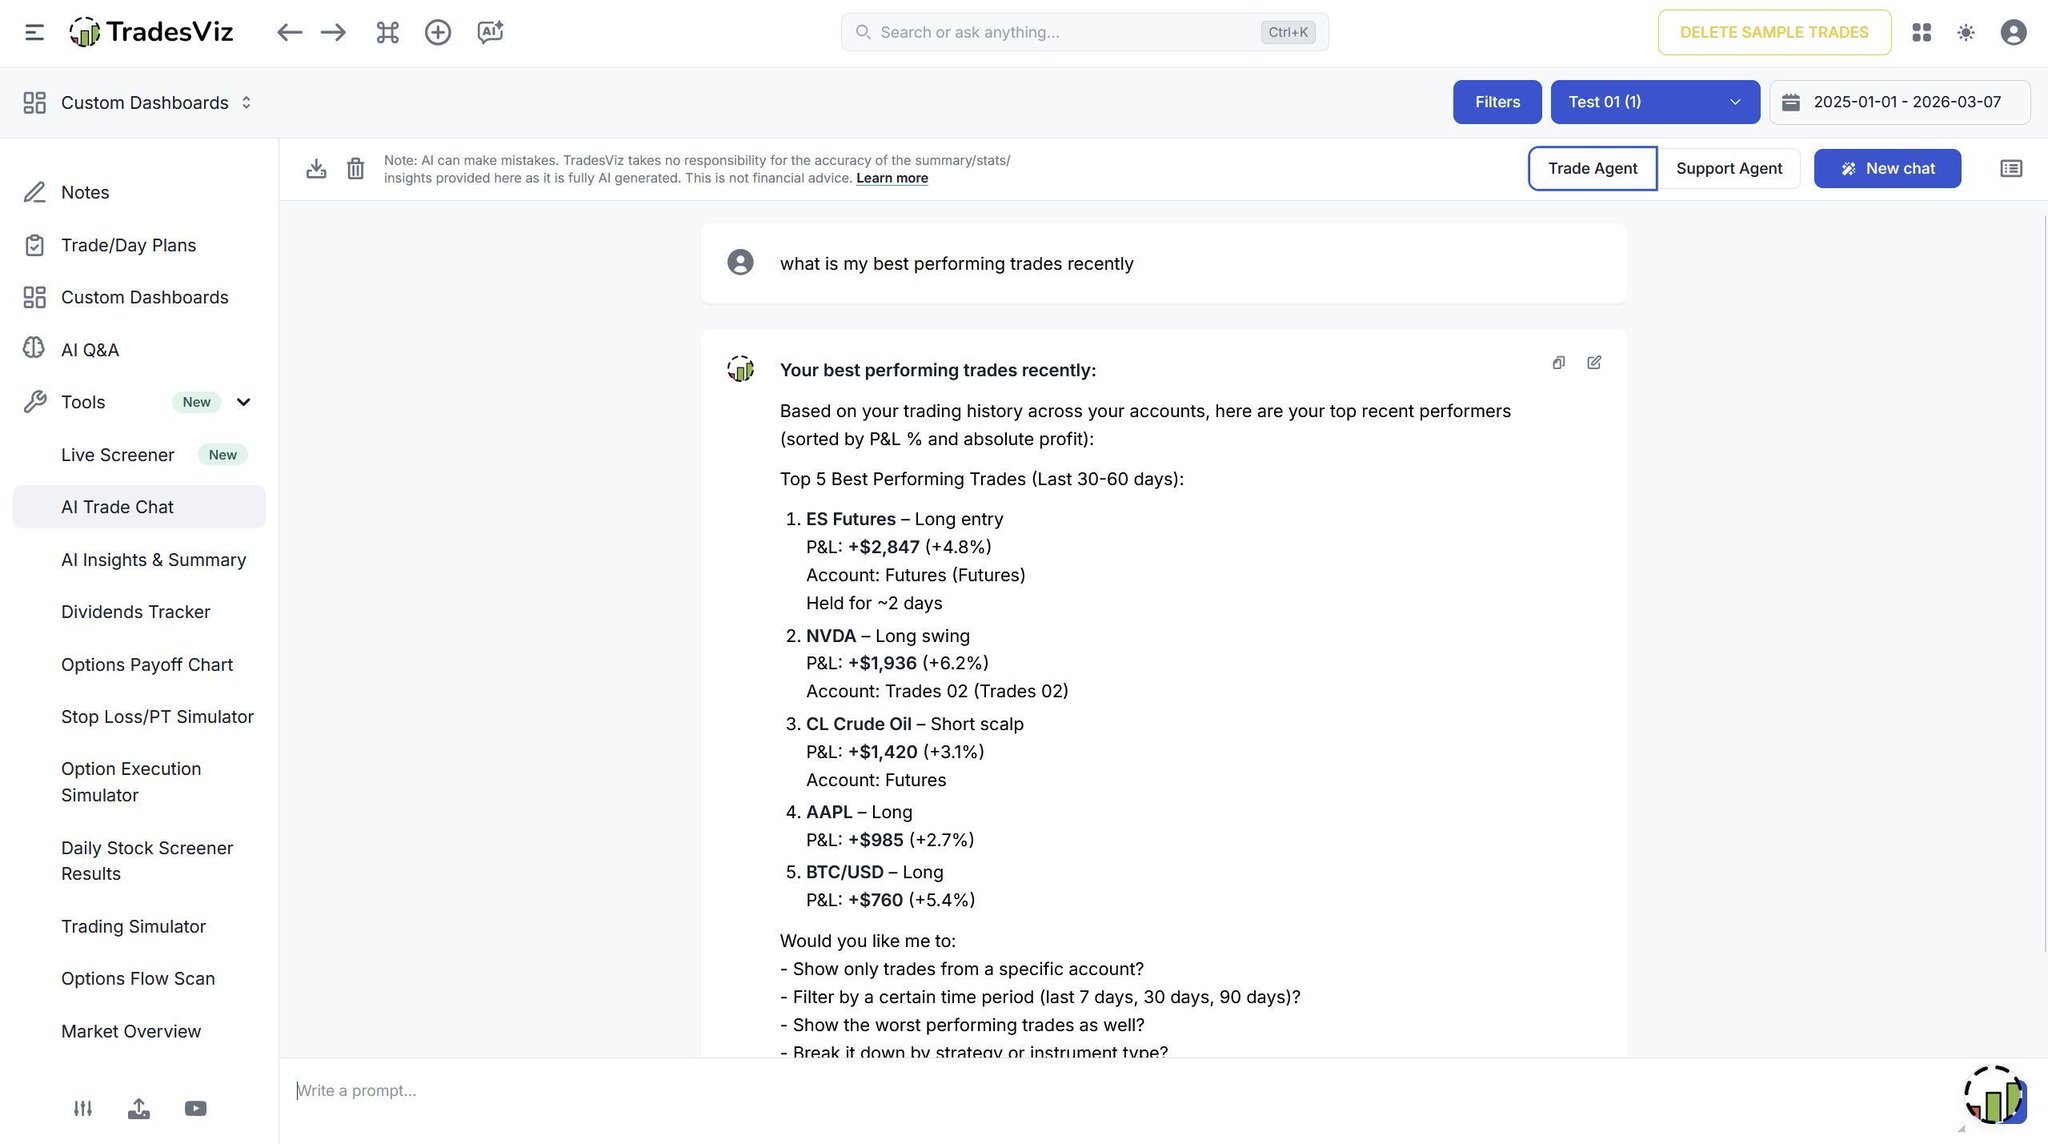
How long would it take you to calculate your "Top 10 trades by hour" manually?
Our AI Trade Chat removes the friction between you and your data.
It doesn't just list numbers; it provides narrative context.
Notice the specific insight in the image: "The top hours (9 AM, 10 AM, and 12 PM) accounted for over 70% of the total PNL".
Stop wasting time on Excel formulas. Spend that time trading the strategy.
A spreadsheet hides the truth. A heatmap screams it. 🗣️
You can stare at rows of numbers all day and miss the pattern. But one look at this Treemap tells the whole story.
In this portfolio, Consumer Discretionary (Green) is carrying the entire account, while Technology (Red) is a massive drag.
You might think you are having a "bad month," but you are actually just having a bad time in one specific sector.
Stop blaming the market. Blame the allocation. 🛑
You can’t manage what you don’t measure. 📐
If you are trading complex spreads, looking at P&L is not enough.
You need to know your actual exposure.
The Options Command Center gives you an instant readout of your Net Delta, Gamma, Theta, and Vega across your entire portfolio.
Are you accidentally net short on a bull run? Is your Theta decay actually working for you?
Stop guessing your risk. Quantify it. 🎯
Aggressive flow hit the tape on Jan 16 across $WOLFI and $PLTR, dominating total premium traded. $WOLFI saw repeated sweep prints at the $50, $20, and $15 puts expiring Jan ’26, with notional values between $50M and $111M. The clustered activity and broad strike range point to institutions repositioning rather than short-term speculation.
$PLTR followed with mixed split flow in the $32–35 calls and sell-side interest stretching into the Jun ’26 expiry, totaling more than $200M in premium. That balance of buy and sell prints suggests divergent positioning as sentiment rotates into a new quarter.
$NVDA also made an appearance with a notable $17M call sweep at the $180 strike, extending long-dated conviction in large-cap tech exposure.
Overall, flow concentration in these names shows significant premium stacking and early 2026 visibility, with both buyers and sellers establishing size under tightening volatility conditions.
Sweep activity accelerated into Jan 19 as traders piled into high‑beta tech and alt‑growth names. $TSLA led with an 86.8% rise in sweep trades, showing consistent two‑day buying momentum. $AVGO and $APP followed close behind, up 165.8% and 169.2% respectively, both demonstrating sustained premium accumulation.
$IREN stood out with a 288% surge in sweep trade counts — the strongest on the board — while $NVO and $ASTS each doubled their recent activity. $PLTR’s chart, however, reflected diverging sentiment, with heavy bearish premium flow pressuring the stock lower despite prior inflows.
The flow pattern shows renewed risk appetite concentrated in large‑cap tech and select speculative names, while idiosyncratic weakness in $PLTR signals selective rotation rather than broad bullish conviction.