Please note: The following guide is for TradesViz 1.0 (old) which is no longer supported.
We have migrated/upgraded to TradesViz v2.0 which is superior in UI/UX and features.
Please visit this guide to learn more about getting started with TradesViz v2.0: https://www.tradesviz.com/blog/tradesviz-2023-revamp/
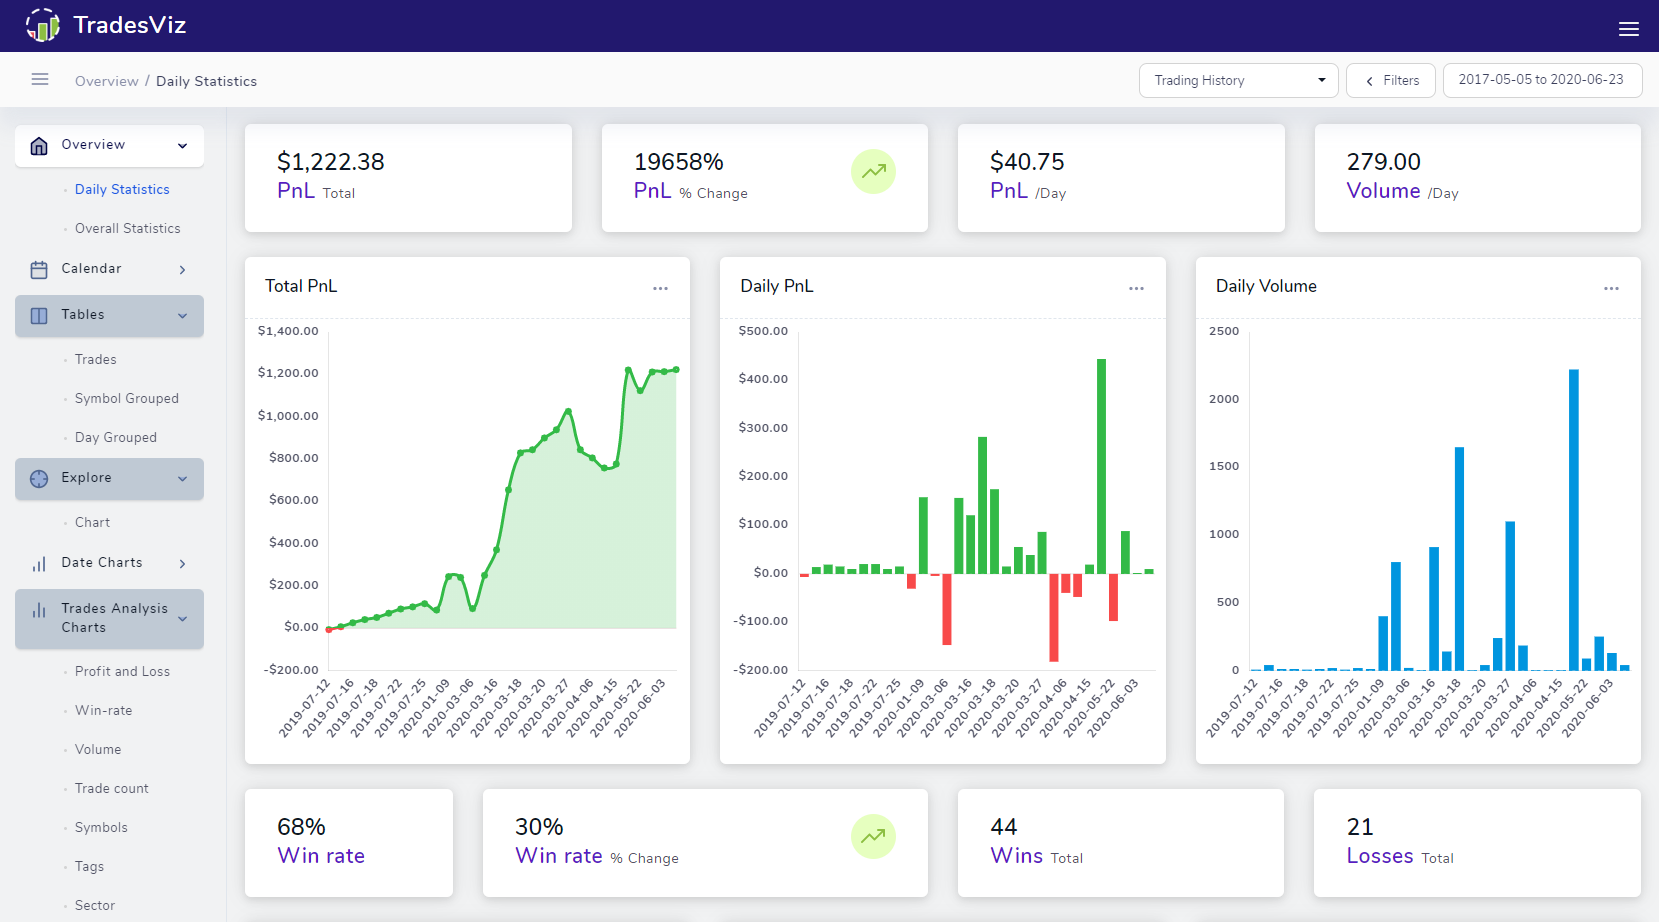
The TradesViz dashboard is a simple interface that focuses on quickly and intuitively being able to access different types of data and visualizations in one single window. That said, there are several components that make this UI work. This post will explore the different sections of the TradesViz dashboard.
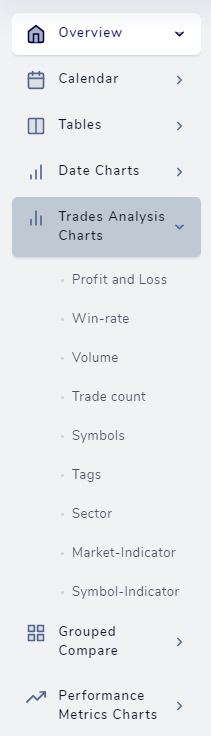
The sidebar
The whole layout and design of TradesViz are centered around this: being able to easily access any type of data without constantly keeping track of many different external windows or tabs. Everything under one roof. Because of this, you will not notice any page loads or new tabs opening when you click or visit any links in the sidebar.
This means you can look at a table, switch to the trade's information, edit the trade's day data - while also applying global filters - ALL at the same time in the same window without navigating away from your dashboard. Let us know your opinions on this design - whether you like it? has it been useful to you? or do you prefer the old new tab/new window for everything approach? write to us (here or) at [email protected]
We have written blog posts exploring in detail 6 main tabs in the sidebar and fro several important features of TradesViz. Here, are the links to those posts:
- Overview
- Calendar
- Tables
- All about interactive charts
- Generating stock charts
- Import and Export trades
- Sharing trades, days and training accounts
The tabs contents
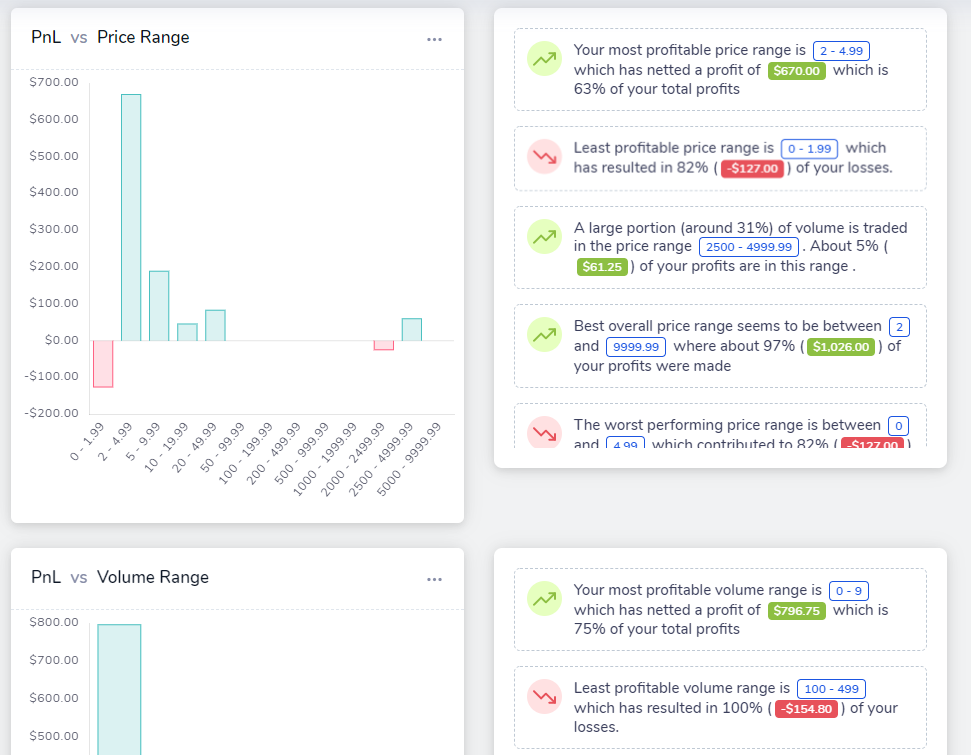
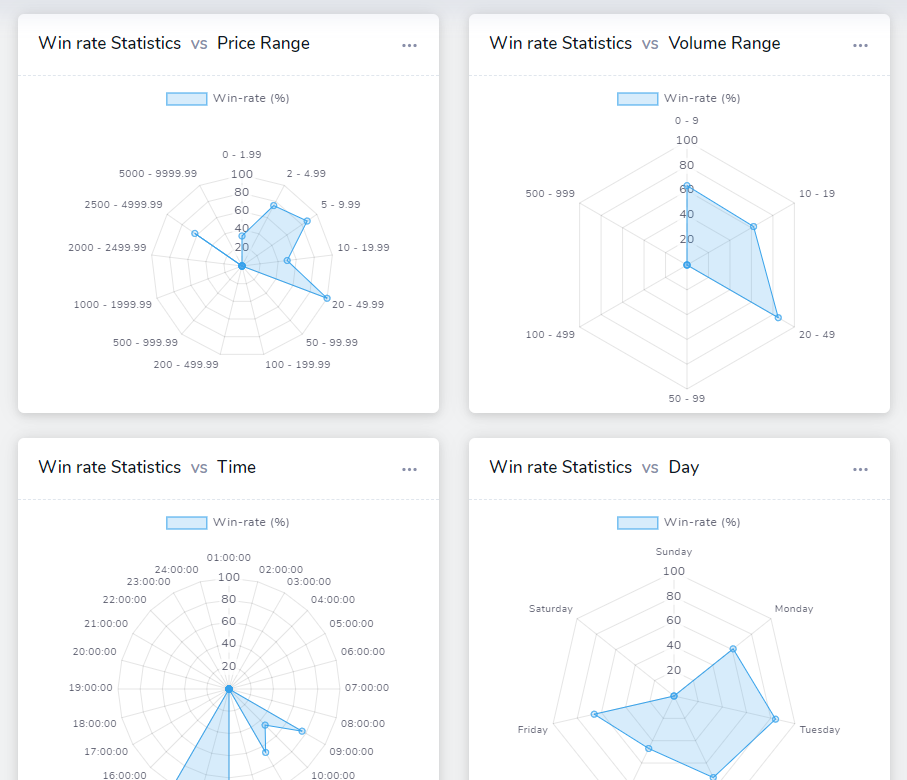
Switching tabs on using the sidebar changes the content of the main area dynamically. Here are some examples of the views you might have seen using TradesViz:
The dropdowns bar
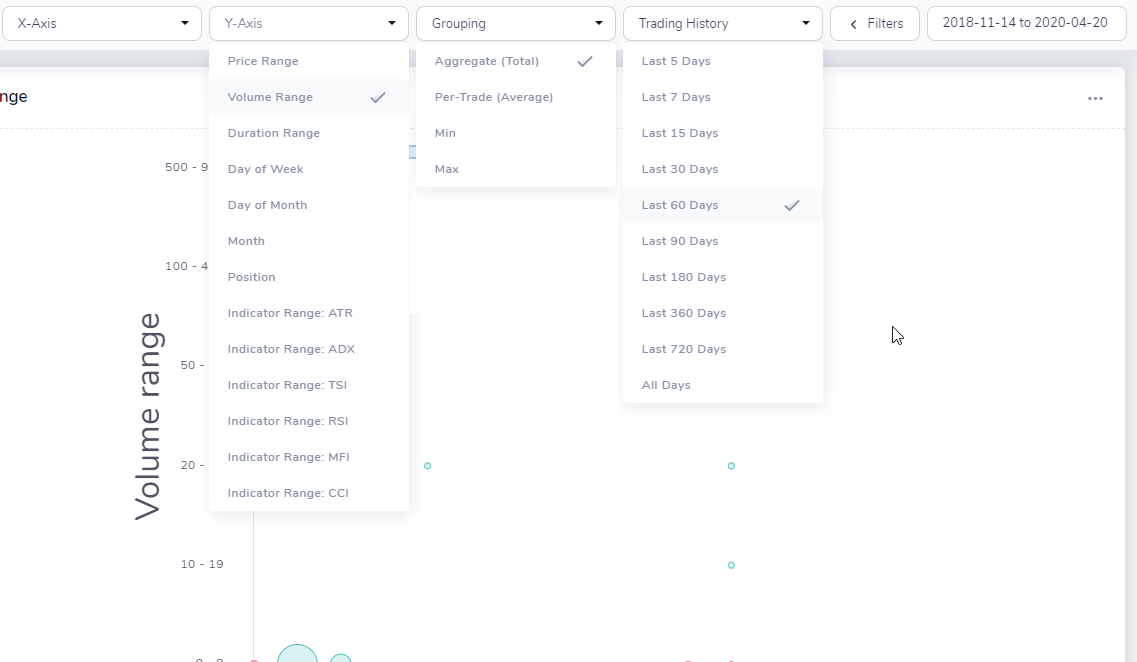
This area is essentially a global control panel for the entire dashboard. Lots of dropdowns such as date, price ranges, X/Y-axis data will automatically appear here based on the currently open tab. With the exception of Filters and Date, you will notice that the other dropdowns appear and disappear based on the selected tab. For example, opening the grouped compare tab adds an X and Y axis dropdown along with a grouping dropdown. The image below shows some of the dropdowns expanded.
It's worth focusing on the filters dropdown as it's probably the dropdown that will be used most of the time as it's applicable to all the tabs. Note that some of the dropdowns have a global effect. For example, any setting in the "Filters" dropdown or the date or in the "Trading History" will immediately refresh the current tab with the update data based on the selected dropdown options.
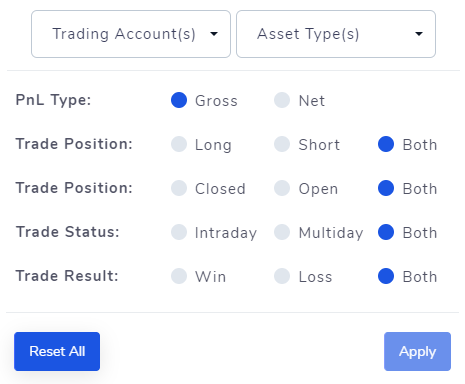
The filters dropdown has all the options that are applicable to a trade or a set of trades generically. For example, any trade that has a PnL is bound to have 2 types of PnL - including commissions and fees (Net PnL) or just the Gross PnL - or, any individual simple trade can be either a long or a short position trade - like this, all the other available toggles are shown in the image above. All it takes to change this is selecting the preferred options and clicking on Apply. All the active tabs and the currently open tab will automatically be refreshed dynamically in the same window. No need to refresh the page manually. Simply put, the filters tab is like a global filter that controls what trades you want to see in your dashboard. Applying any change using this global toggle filter affects all the tabs - including the trade 3 explore tabs and the table tabs! For example, if you are not seeing all your trades on a particular day when viewing a day view, it could be because you have applied filters to accounts that removes these trades! Careful with this when you are selecting sharing settings for a day that require you to select the trading accounts from which you want to share your trades.
The flexibility and the combinations of options you can play with are limitless here! Use these dropdowns to quickly identify and zoom into the profitable setups from the thousands of trades you might have in your account.
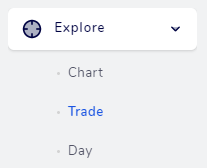
The 3 "explore" tabs
Viewing trades, trading days, and charts are the main interactive elements of TradesViz. You no longer have to juggle 10 different browser tabs switching between a table and the trade details - now everything is in one place. Note that these tabs only appear when you explore a particular element (i.e a trade, day, or a chart) - that's the reason why this tab is not visible in the first image in this blog post which lists all the tabs in the sidebar. The image below shows an "Explore" outer-tab which appears only one of these 3 elements is explored.
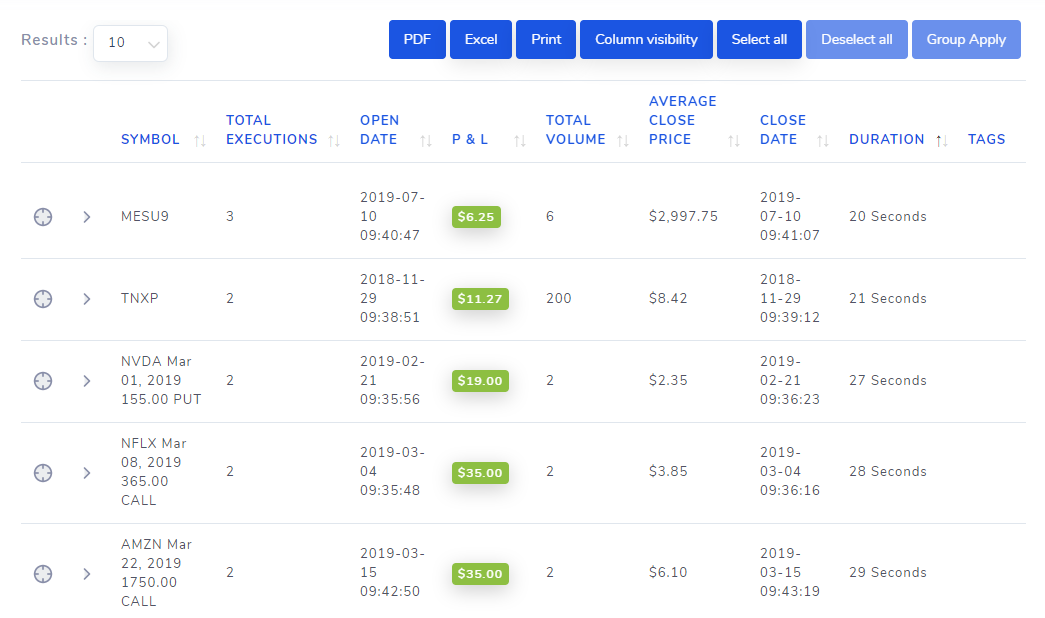
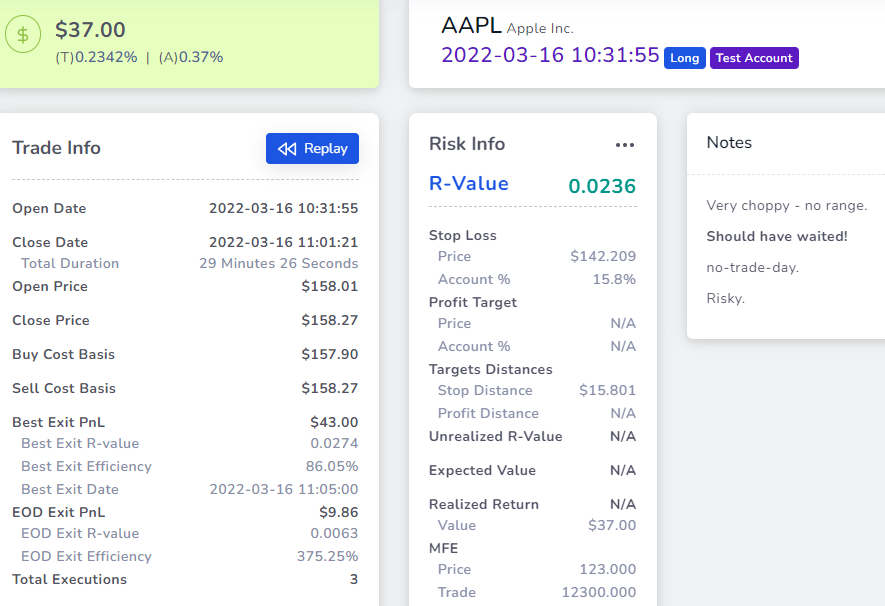
Trade explore
Clicking on any trade explore button in any table will automatically show the trade explore tab. This tab has all details about a trade, all the charts, notes, and your uploaded images. Click on the title link above to explore more!
Day explore
Your entire trading day in one view! View market events, all the trades made on that day, add custom barchart for any symbol, and more!
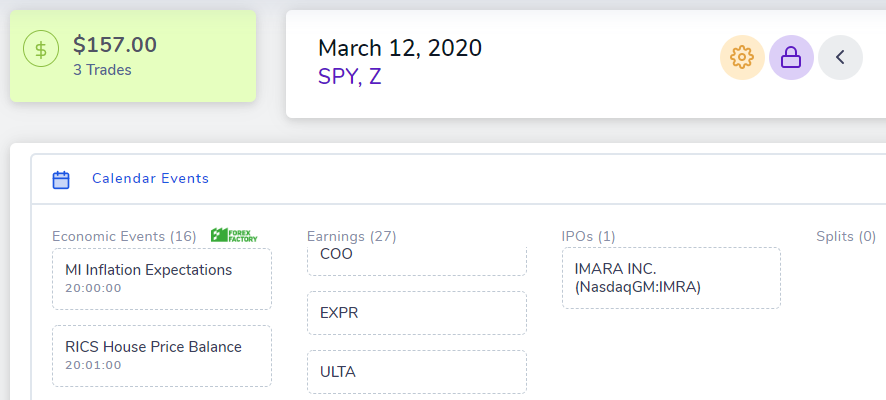
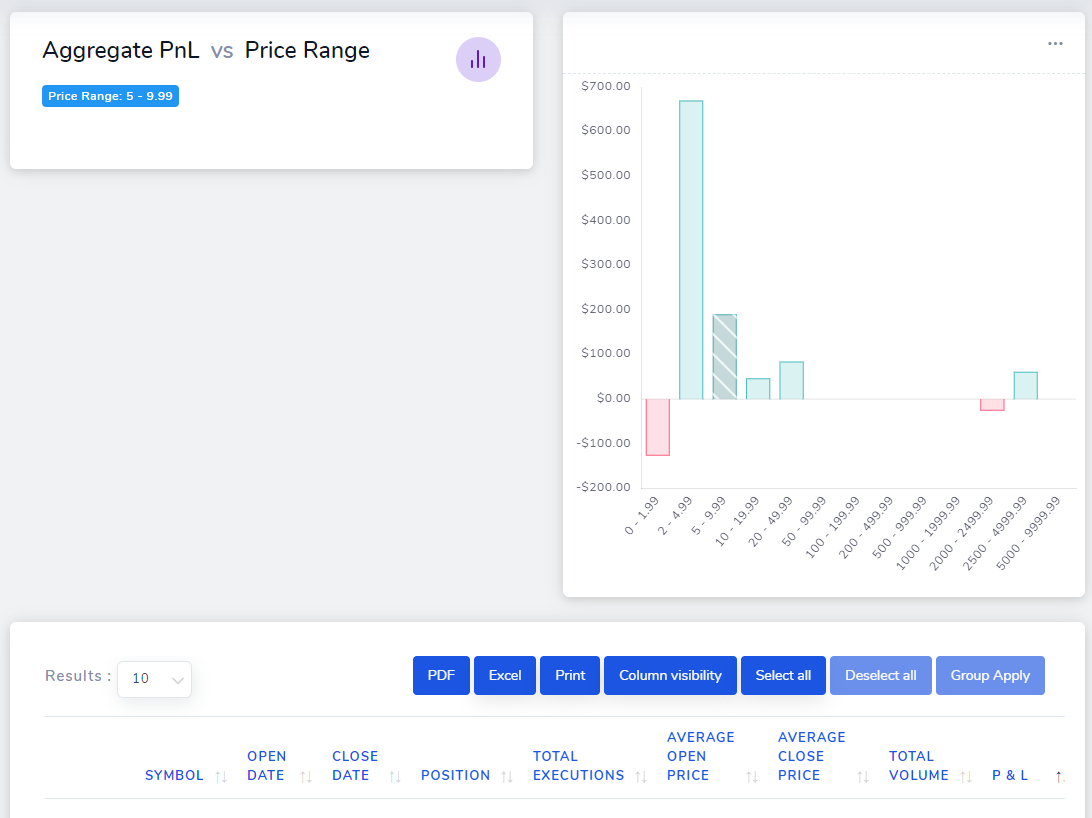
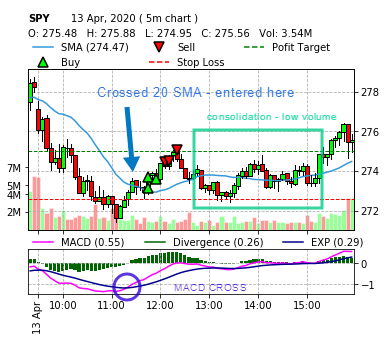
Chart explore
The crux of TradesViz - explore every single chart and see what each data point contains, add these data points as global filters.
These components pretty much sum up all the important parts of the dashboard. What is left for you to explore this and be on your way to analyze and fully understand your trades to become a profitable trader!
Do let us know if you have any questions or feature requests by filling the form here or by directly emailing us at [email protected].