One of the core components of any trading journal is its PnL calendar. No matter what you trade, how you trade, or how long you trade for, everyone checks the trading calendar. It's also one of our most popular custom dashboard widgets!
It has been nearly 4 years since we first wrote about the calendar in our blog. You can read the original here: https://tradesviz.com/tab-explore-tradeold.
With the launch of TradesViz v2 and using user feedback accumulated throughout the years, we have greatly improved the utility of the calendar tab.
Before diving into the details, if you are more interested in a video format, please check this:
(We have 10 NEW videos all focusing on features of TradesViz v2.0 UI)
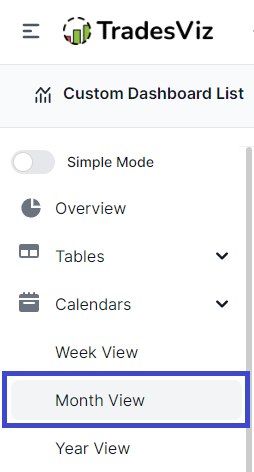
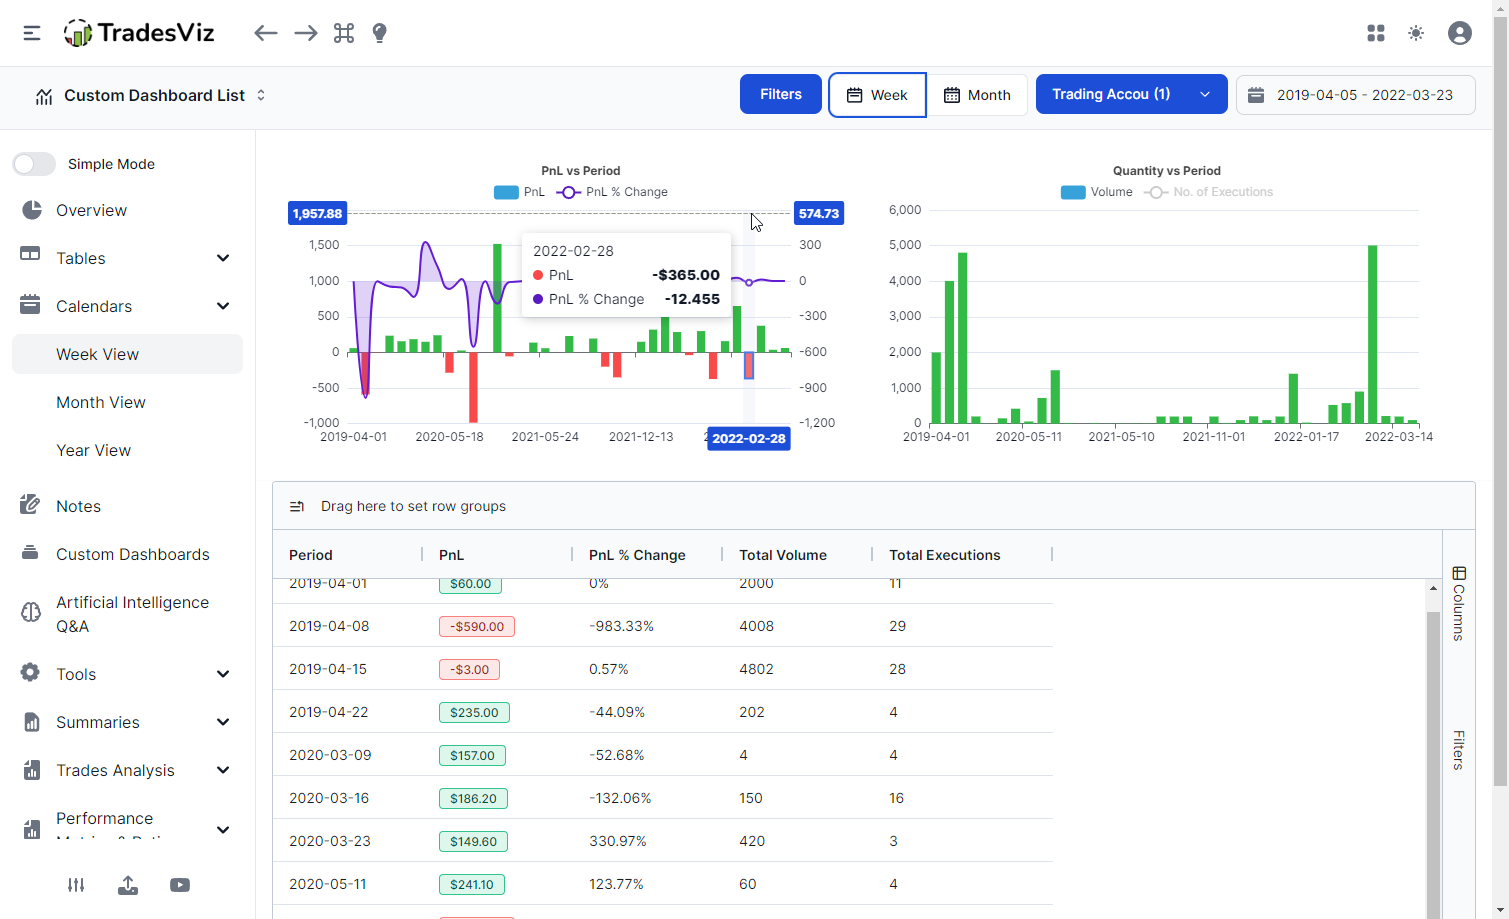
To get to the calendar view, click on the calendar tab on the left side and select "Month". Note that there are multiple calendar views. The most popular one is the month view and that is what we will be exploring in this blog post. The year view is a simple heatmap of the entire trading year where you can click on any single point to explore that day and the week view shows your realized pnl and returns on a weekly basis with multiple visualizations.
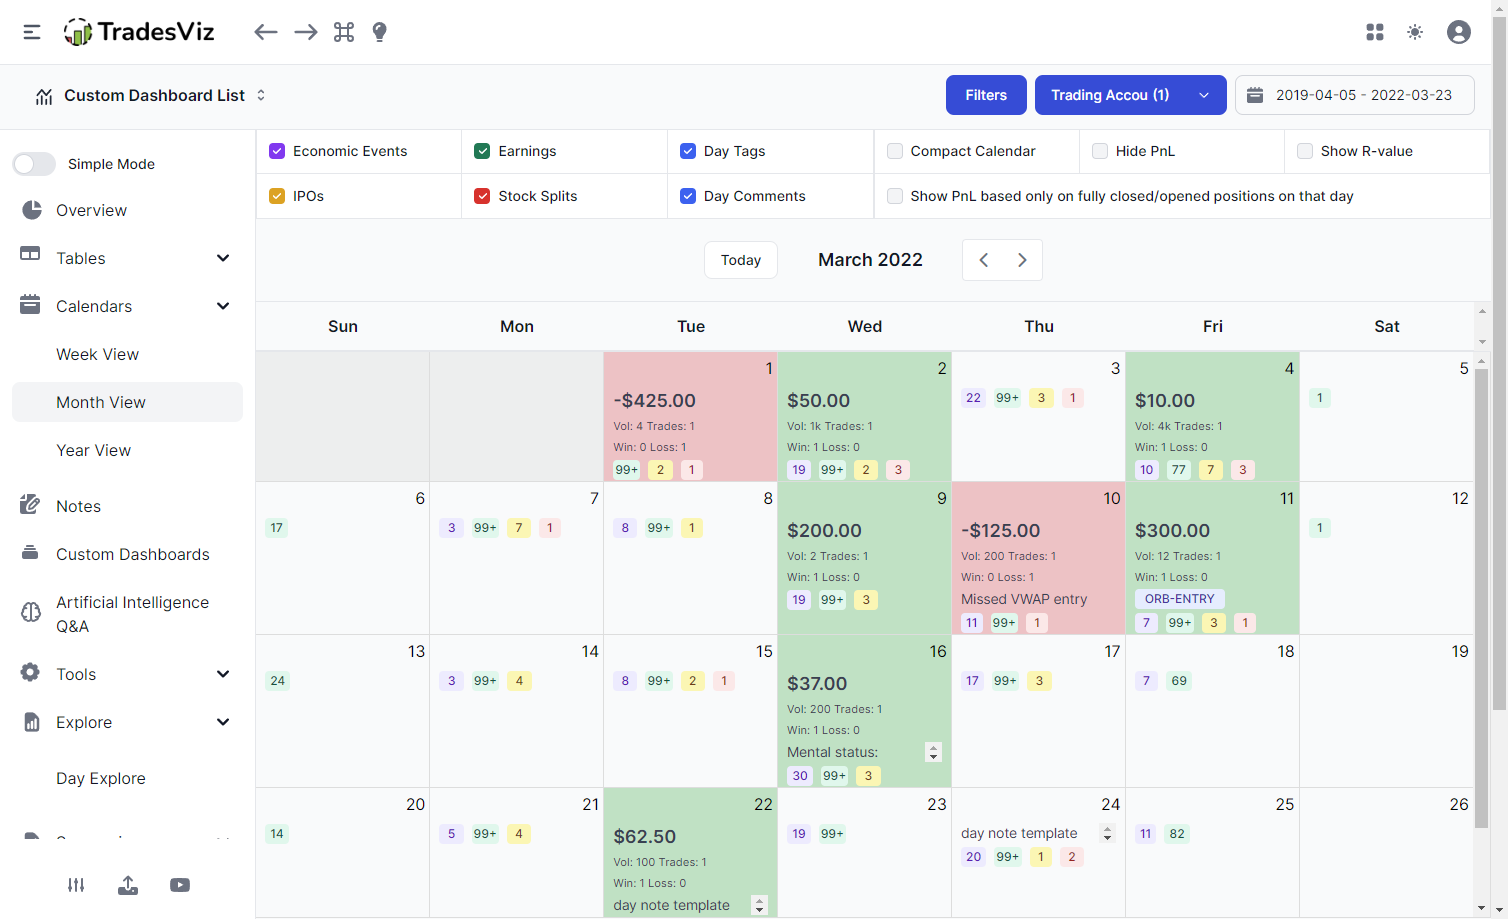
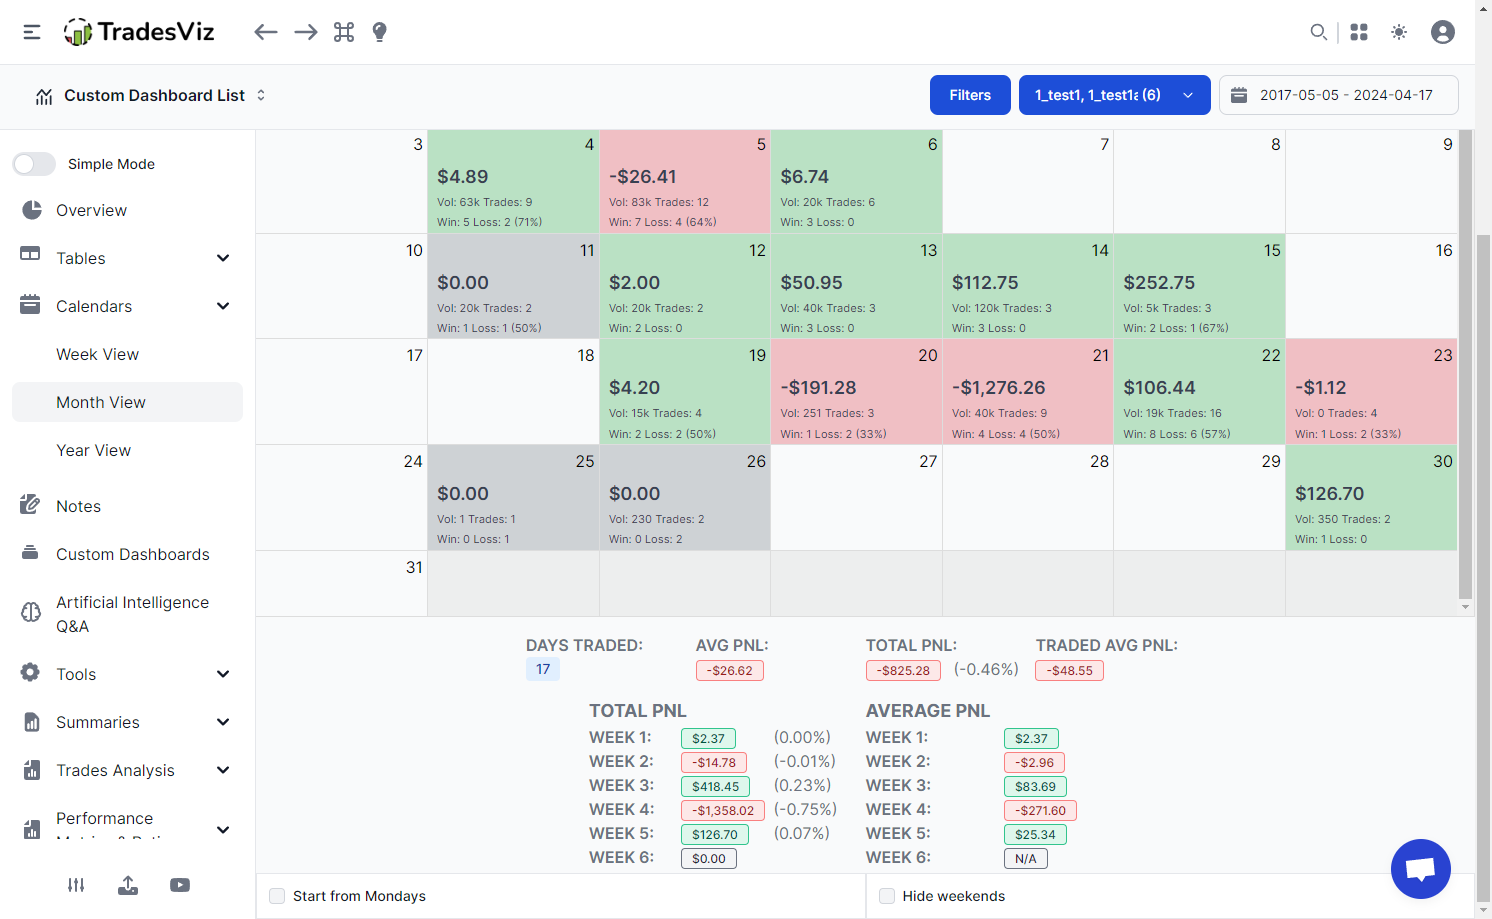
After exploring the month view, you will see a page like this:
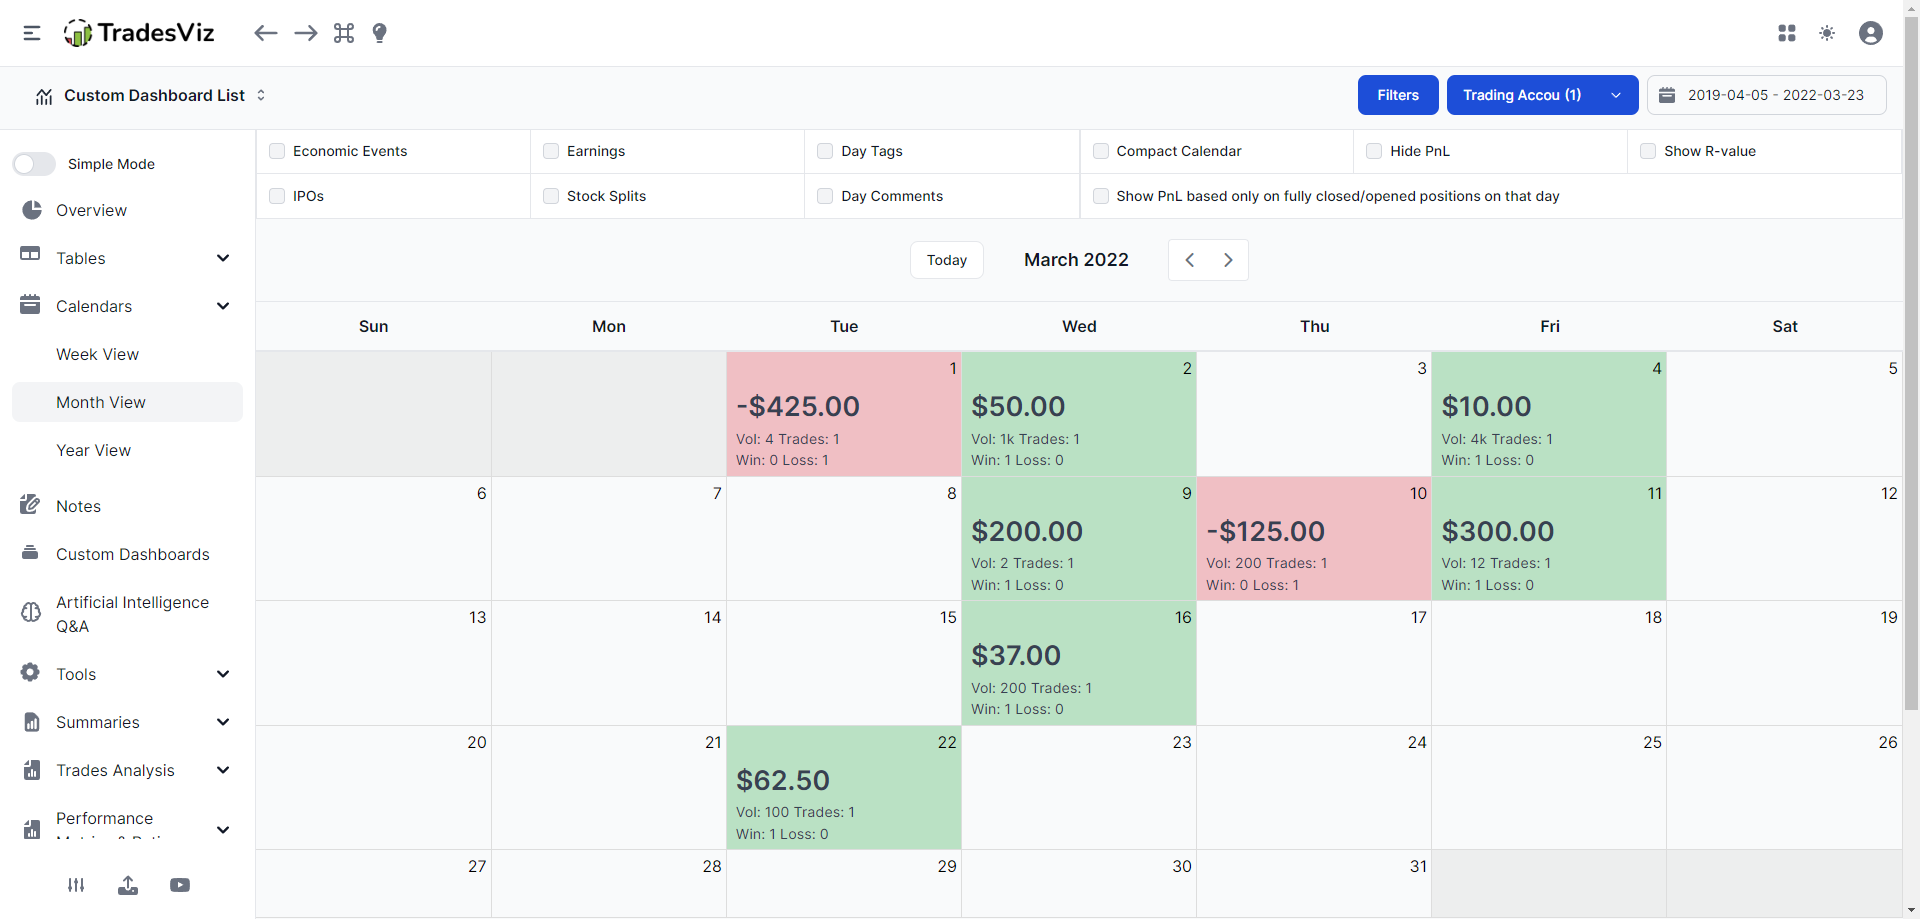
You will see a calendar with each cell colored in either green (profit day), red (loss day), or gray (no realized pnl). The month that you will see is the most recent trading month based on the selected accounts and filters.
It is important to understand that the number represented in each cell of the calendar is the realized pnl per day. This is the total profit or loss made on that by closing executions. It may be from partially closed trades or fully closed trades. You will observe this difference if you swing trade and close the position over multiple days and compare the calendar with the pnl vs day chart. The chart on the other hand always shows fully realized pnl.
For example, if you opened 100 shares of AAPL on the 15th of Jan and closed 50 of them for a profit of $10 on the 16th and the remaining 50 on the 17th of Jan for a profit of $15. In the calendar, you will see $0 on the 15th, $10 on the 16th, and $15 on the 17th. Whereas, on the chart, you will see a single data point of $25 ($10 + $15) on the 17th (the closing date).
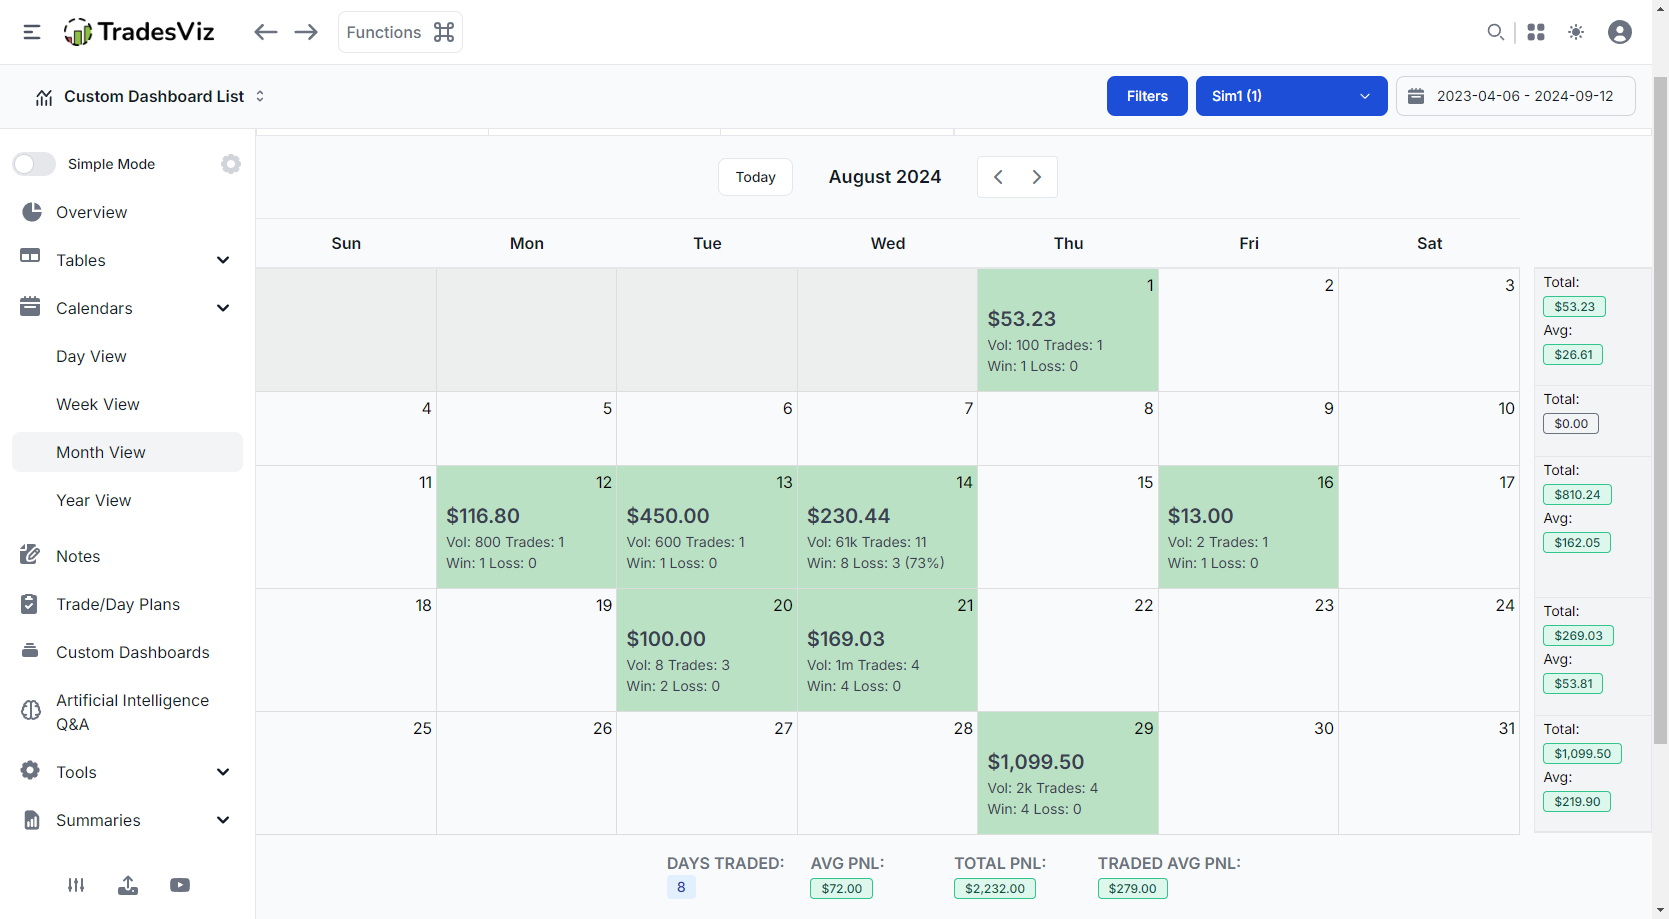
Apart from PnL, you will also see the total volume (the total no. of shares/contracts, etc., bought and sold), the wins and losses. If you need a more simplified look, you can check the "Compact calendar" to view the calendar in a compact way that shows all the data fit within the screen like below:
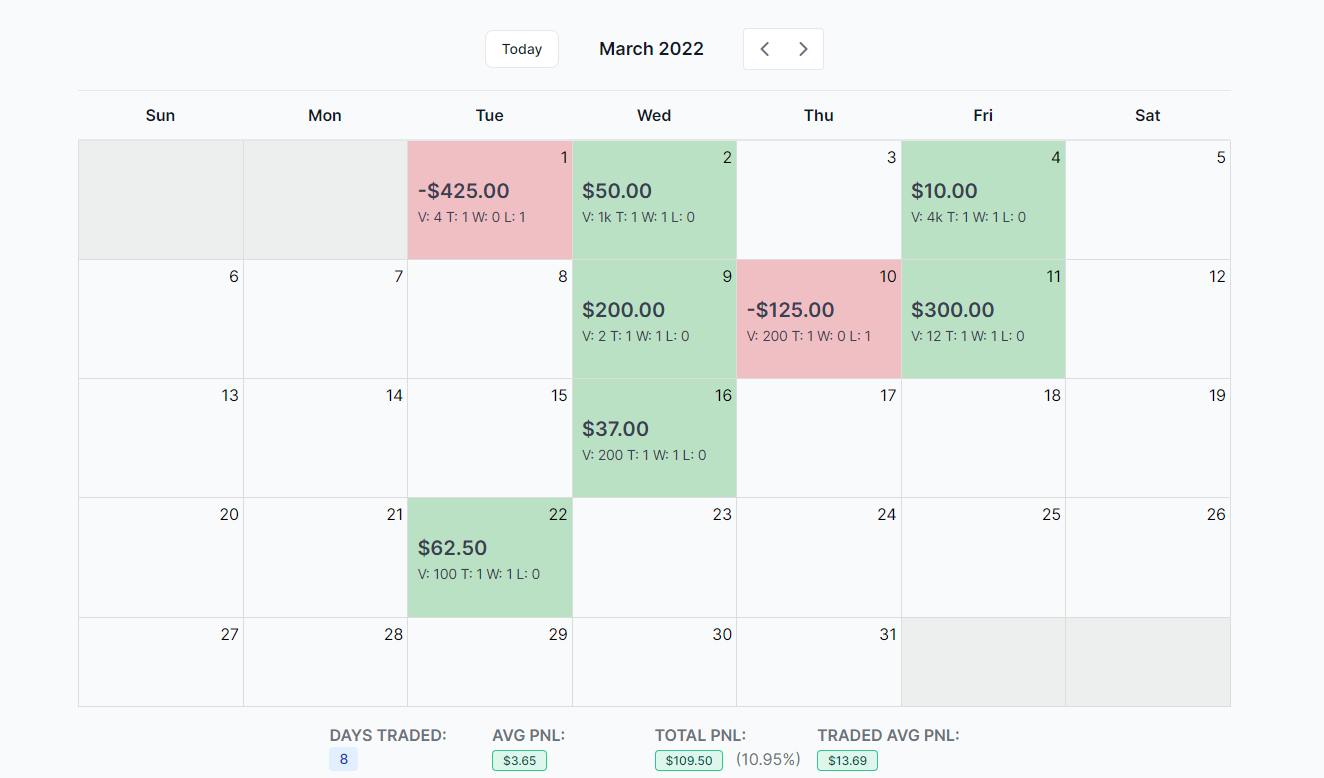
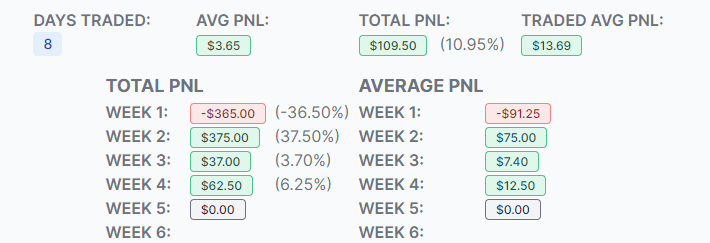
Below the calendar, you will see a per-week summary including the total % in terms of deposits made till that week. If no deposits are in your account, you will not see any % returns. You can add account deposits in the Summary > Equity Curve tab.
This sums up the elements of the calendar tab. In terms of utility, the most important utility is that you can click on the date number in any cell to explore the day - this is the day explore view. We have an in-depth guide and video about this.
Finally, let's explore the controls at the top of the calendar. This one of the features differentiates TradesViz's calendar from other journals' calendars.

On the left side, you will see toggles for:
- Economic events
- Earnings
- Day Tags
- IPOs
- Stock Splits
- Day Comments
- Day Tags
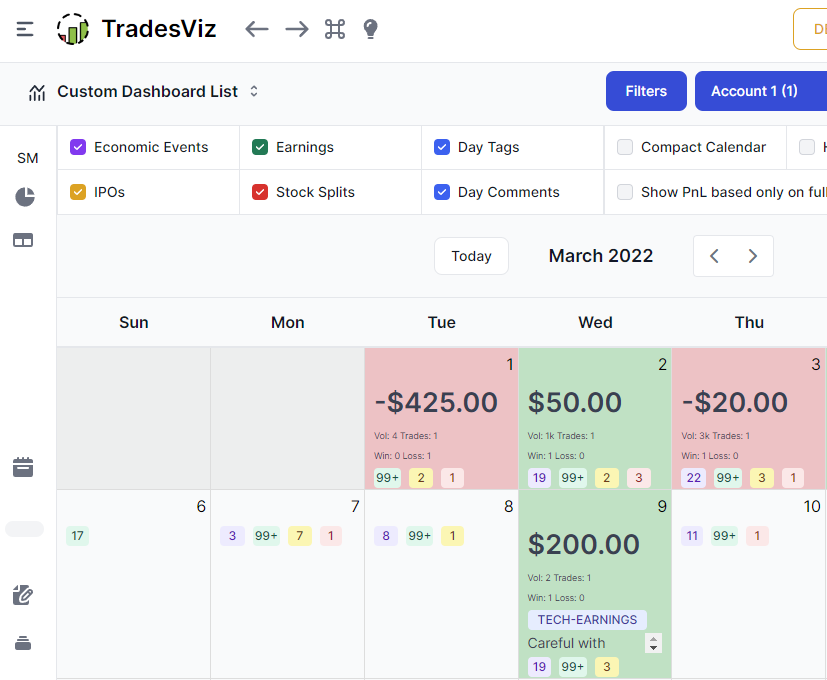
These are all UI elements that appear on the calendar when checked. Here's an example with all of them checked. Note that the events are color-coded so that you can easily recognize them in the calendar. In each cell, you will see a small number denoting the no. of events that you have selected.
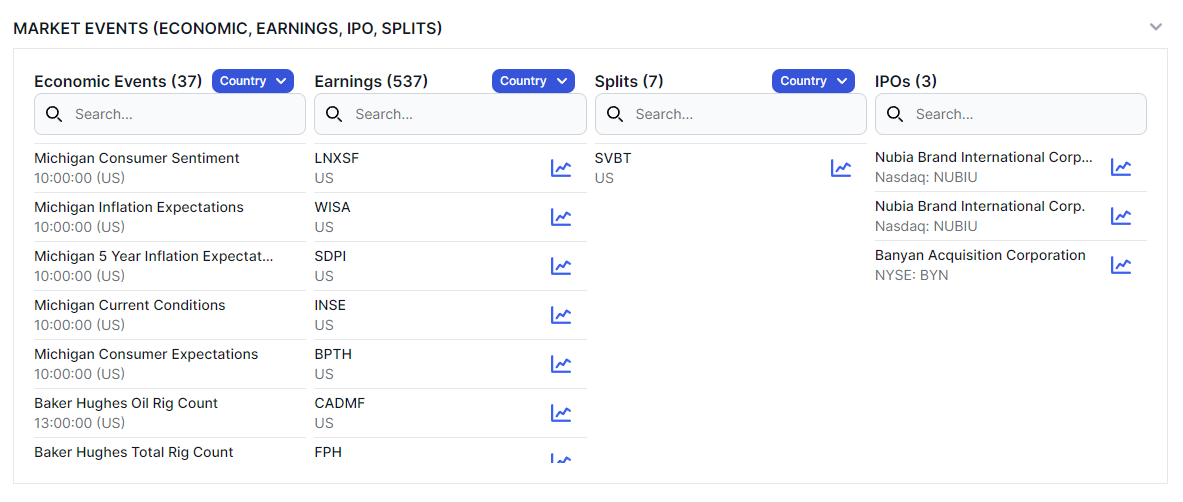
In addition to this, you can also view the day notes and day tags. It's important to note that these are NOT the notes or tags attached to your trades, rather they are the notes and tags you enter in the day explore view. You can view these events in detail only when you explore the day by clicking on the date number in the cell. Here's an example of the events list in the day explore view:
These calendar settings are saved to your local cache so you don't need to enable/disable them every time you visit your calendar tab.
Next, the settings on the right side of the top of the calendar pertain to modifying the data shown in the calendar except for the compact calendar function which we have discussed above. Let's explore each function below:
Hide PnL: It hides your pnl from the calendar cells so that you can easily screenshot it and share it in case you don't want anyone to view your PnL.
Show R-value: If you have entered stop loss for all of your trades, you will see R-value instead of PnL in the calendar cells.
Show PnL based only on fully closed/opened positions on that day: If you are a hybrid swing/intraday trader, it's easy to toggle between showing the trade's pnl that were fully opened AND closed on the same day and the trades that you held for more than one day. If you don't see pnl for specific days - it's likely that you have this option enabled.
This is all you need to know about the main monthly calendar tab in TradesViz. Compared to the 2020 version, we have improved the flexibility of the calendar section. There are no alternatives at all in any other online journaling solutions for the features you see here. The concept calendar -> day explore was introduced and refined by TradesViz in 2020.
Other than the main monthly calendar, we also have a year heat map view which looks like this:
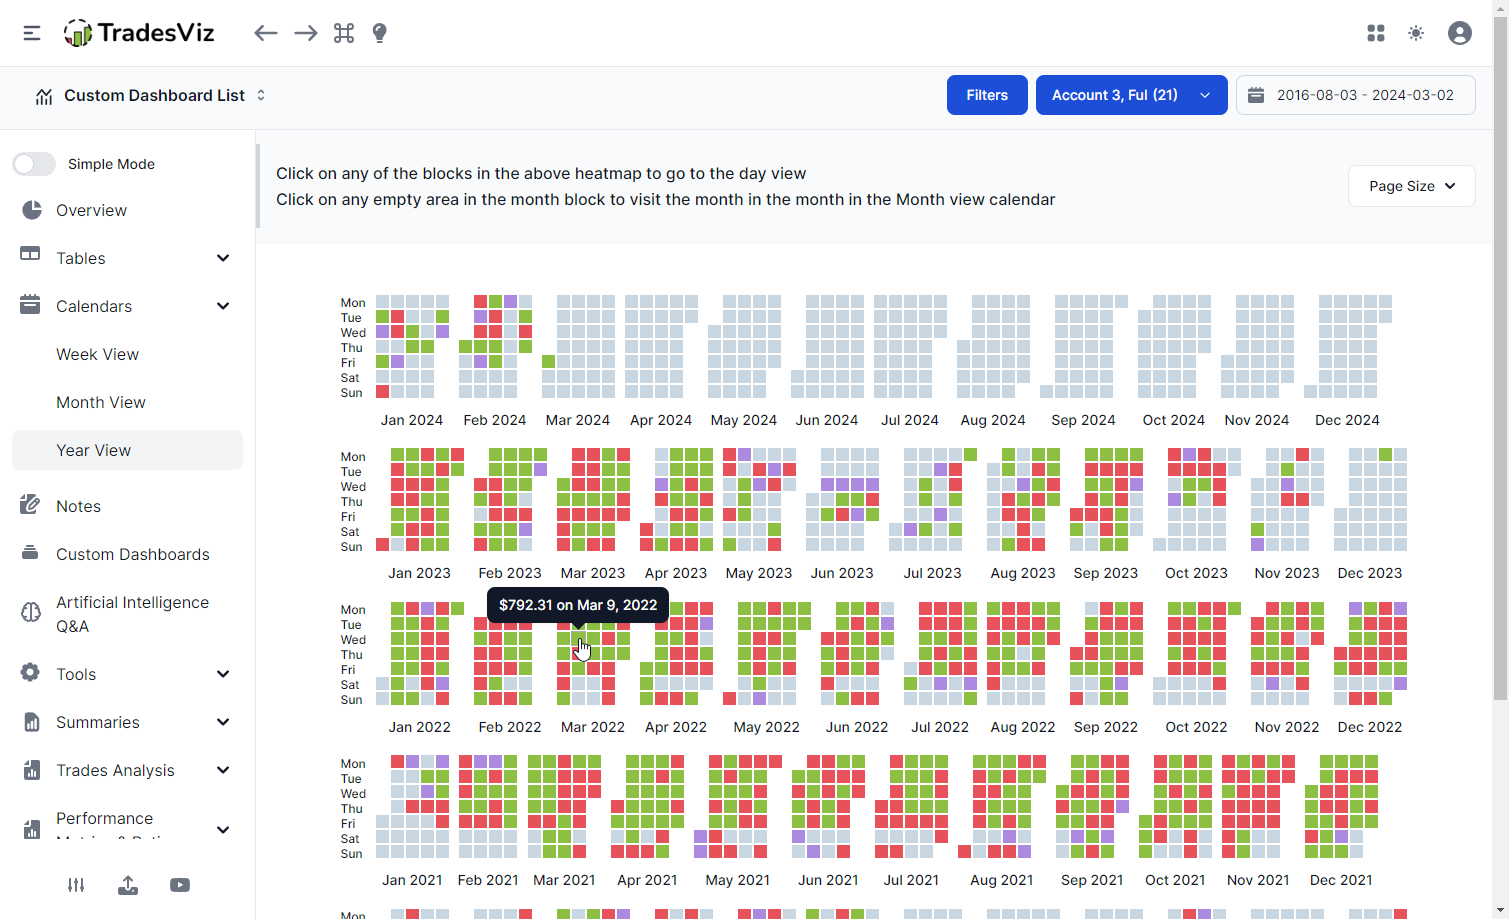
You can click on any cell in this year's heatmap to jump to that date (day explore) to view more info.
The other view is the weekly pnl view - these are all different ways to look at your performance from different date/calendar perspectives.
We will soon release blog posts for other important tabs using updated v2.0 screenshots and info. Meanwhile, we have already released videos about all of these tabs so please make sure to check them out.
Update April 2024:
You can now choose to hide or show weekends and also make sure each week starts from Monday using new settings at the bottom of the calendar!
Video showing the different states of the calendar:
Sep 2024 Updates
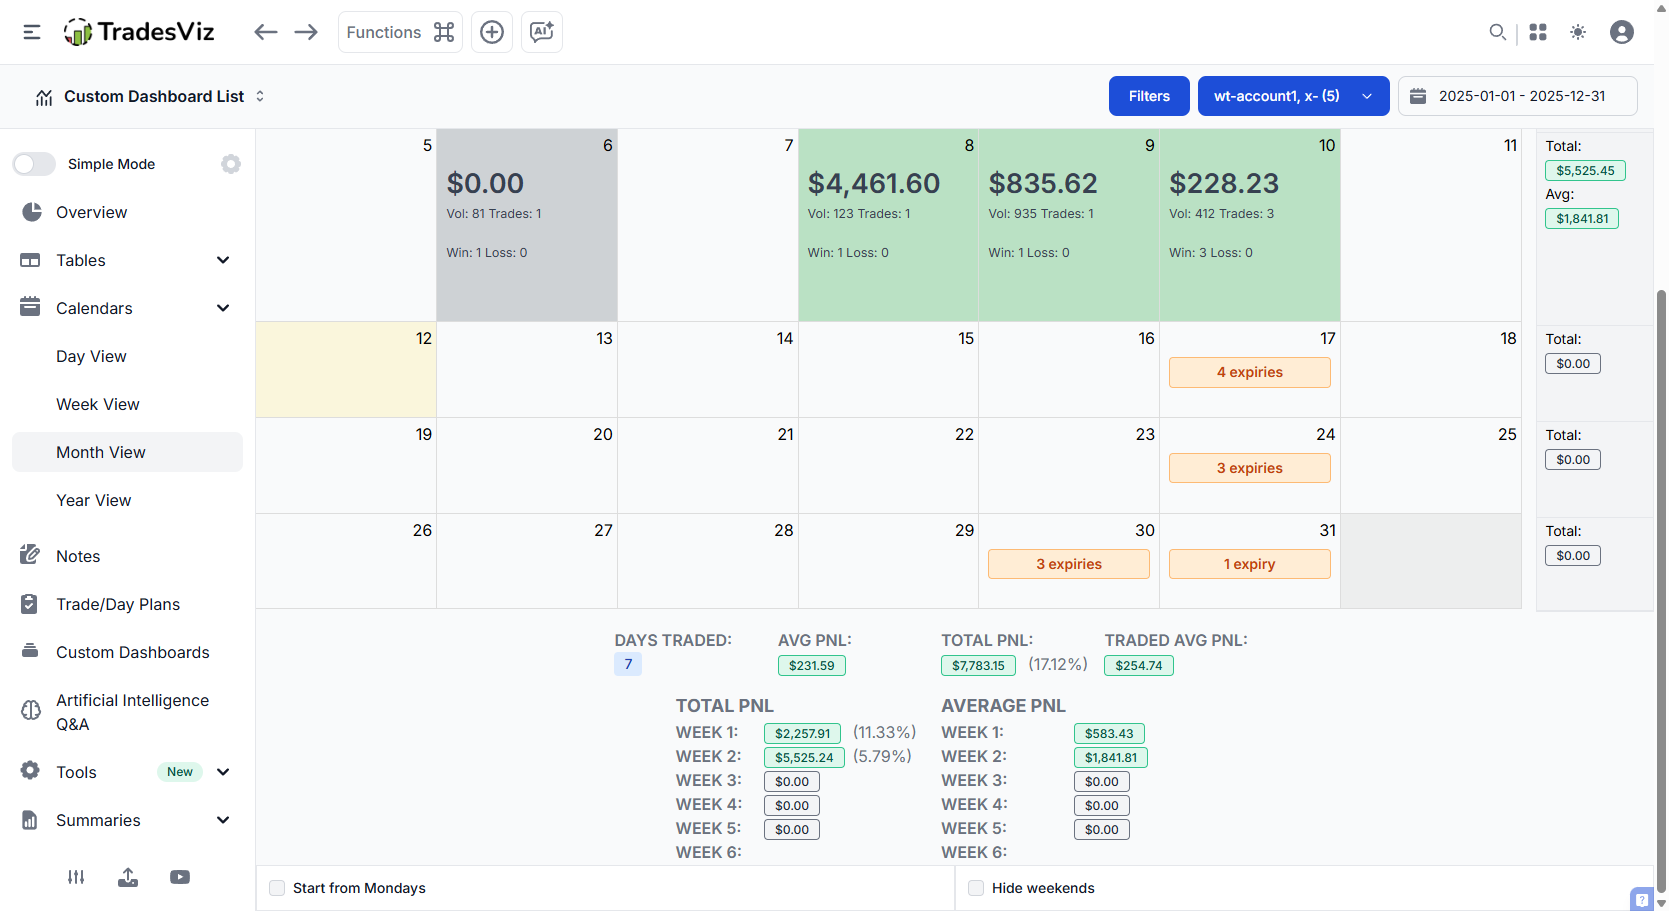
- A new weekly sidebar is added as a separate column to easily get the weekly pnl without needing to scroll the page (works for pnl, no pnl, and r-value mode)
- Turning off pnl will also hide all pnl elements below the calendar
Oct 2025 Updates
You can now toggle between viewing the count of expiry trades on future trades using the "show expiry" checkbox at the top of the calendar.
You can also view the trades with expiry executions in the day explore tab in a new table:
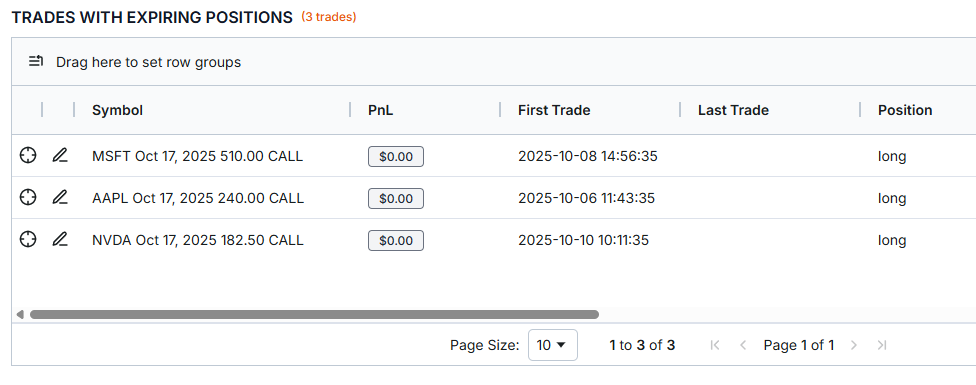
We hope this makes trade management and tracking a bit easier for options traders!
March 2026 Updates
We have fully revamped the calendar to be simpler, faster, more responsive. With this new UI, all of the options are now neatly tucked inside the settings dropdown. The weekly sidebar is now easier to read and the calendar always fits the full screen. On top of this, we have also added a new event type: High impact events count.
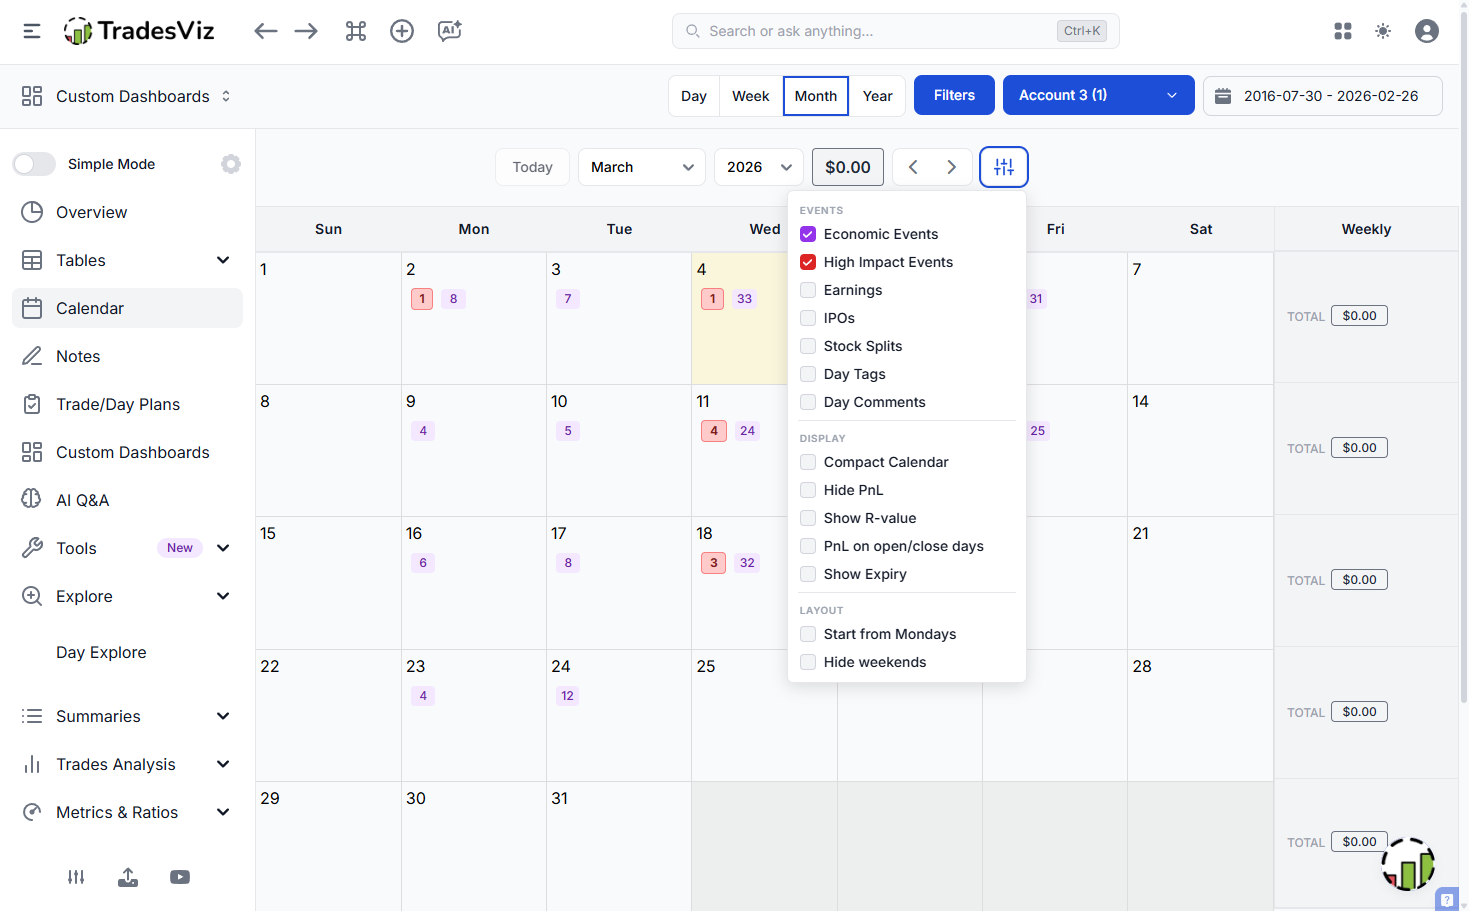
We filter from the economic events all the high-impact events (for the US) and show them as a separate counter in the calendar itself, so you can plan ahead! The same is also applied in the day explore tab.