Please note: The following guide is for TradesViz 1.0 (old) which is no longer supported.
We have migrated/upgraded to TradesViz v2.0 which is superior in UI/UX and features.
Please visit this guide to learn more about getting started with TradesViz v2.0: https://www.tradesviz.com/blog/tradesviz-2023-revamp/
The overview tab's goal is to summarize all data and show only the most important ones as the home page - This is the default page/tab you will see every time you log into your TradesViz account.
There are 2 sub-tabs:
- Daily Statistics (open by default)
- Overall Statistics
Daily Statistics
To reduce clutter, only 6 important charts are visible on the dashboard's home page. They are:
- Total PnL change over the last 30 days
- Daily PnL for the last 30 days
- Daily Volume for the last 30 days
- Total Win-rate change over the last 30 days
- Daily Win-rate for the last 30 days
- Total Win/Loss score change for the last 30 days
There is a pattern here. The charts can be grouped into 2 broad categories. The first being cumulative statistics such as total pnl and total winrate and the second being per-day statistics such as total pnl per day or total daily volume. We believe that these statistics give a trade enough information about the overall progress in terms of PnL, Volume, and Win-rate - the most used statistic in TradesViz. Most of the charts you will see in TradesViz will be centered mainly around these 3 statistics.
Charts 1-5 are pretty much self-explanatory as they are commonly used in several trading platforms. The last chart is a bit different compared to the other win-rate charts. One of the main goals of TradesViz is to visualize data in many different ways and from various perspectives so we can find hidden patterns. In that way, while the total win/loss score uses the same data as the overall win-rate chart (chart 4), this chart can almost be treated as a scoreboard for your trading. Chart 6 plots this: (total wins - total losses). That's it! It can often lead to very different looking charts that enable you to quickly take action or make observations that you would otherwise not have noticed in the win-rate change graph.
All the charts on this page are fully interactive - meaning, you can zoom, pan, explore data points, and select datapoints as filters from any of the charts. For more information on how the interactive charts work and their features, please refer to this blog post.
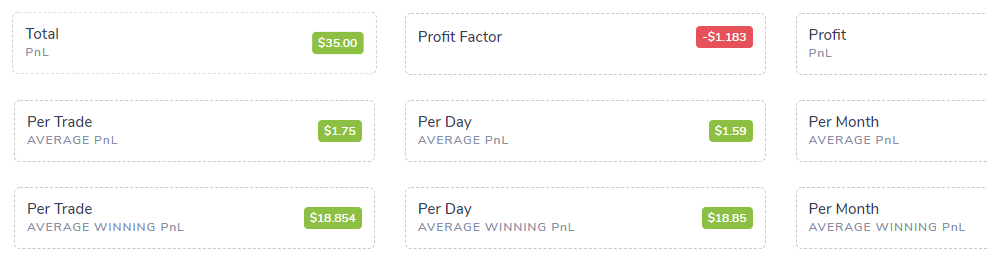
Overall Statistics
The ultimate summary of one's entire trading history. This tab contains pretty much every PnL, Volume, trade count statistics summarized from the entires trades database of your account. There are 6 essential sections here each addressing a particular area of trading.
- PnL
- Volume
- Total Trades
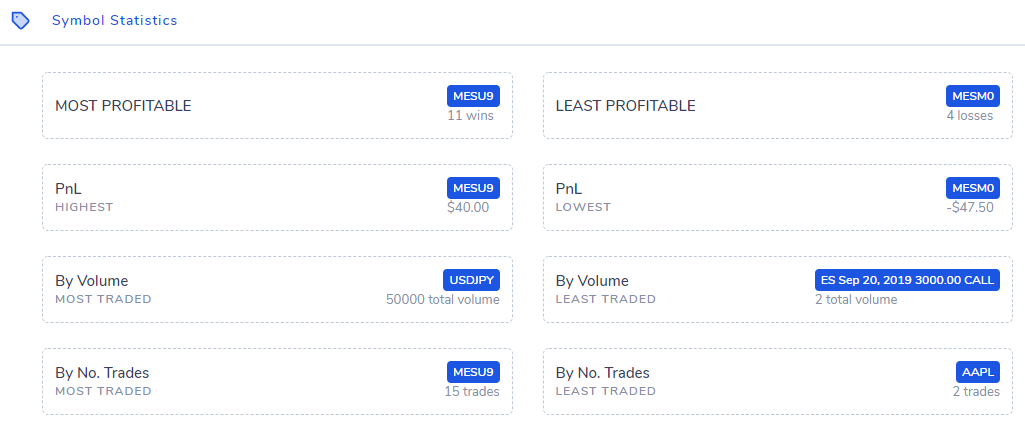
- Symbol Statistics
- Trade Duration
- Commission Statistics
Most of the data points there can be grouped into categories such as average per month, year, day, cumulative (since the first trade), most frequent, least frequent, min. and max. of certain stati ect., While these statistics are not something that need to be frequently checked, they do serve as a pointer of the overal direction you are heading in your trading.