We've combined two of our most powerful analytics features - Running PnL and MFE/MAE analysis - into a new unified view that lets you analyze multiple trades at once. Introducing the Drawdown View.
You'll find this new view right next to our existing Unified View and Chart View tabs in the trades table. Click on "Drawdown" to access it.
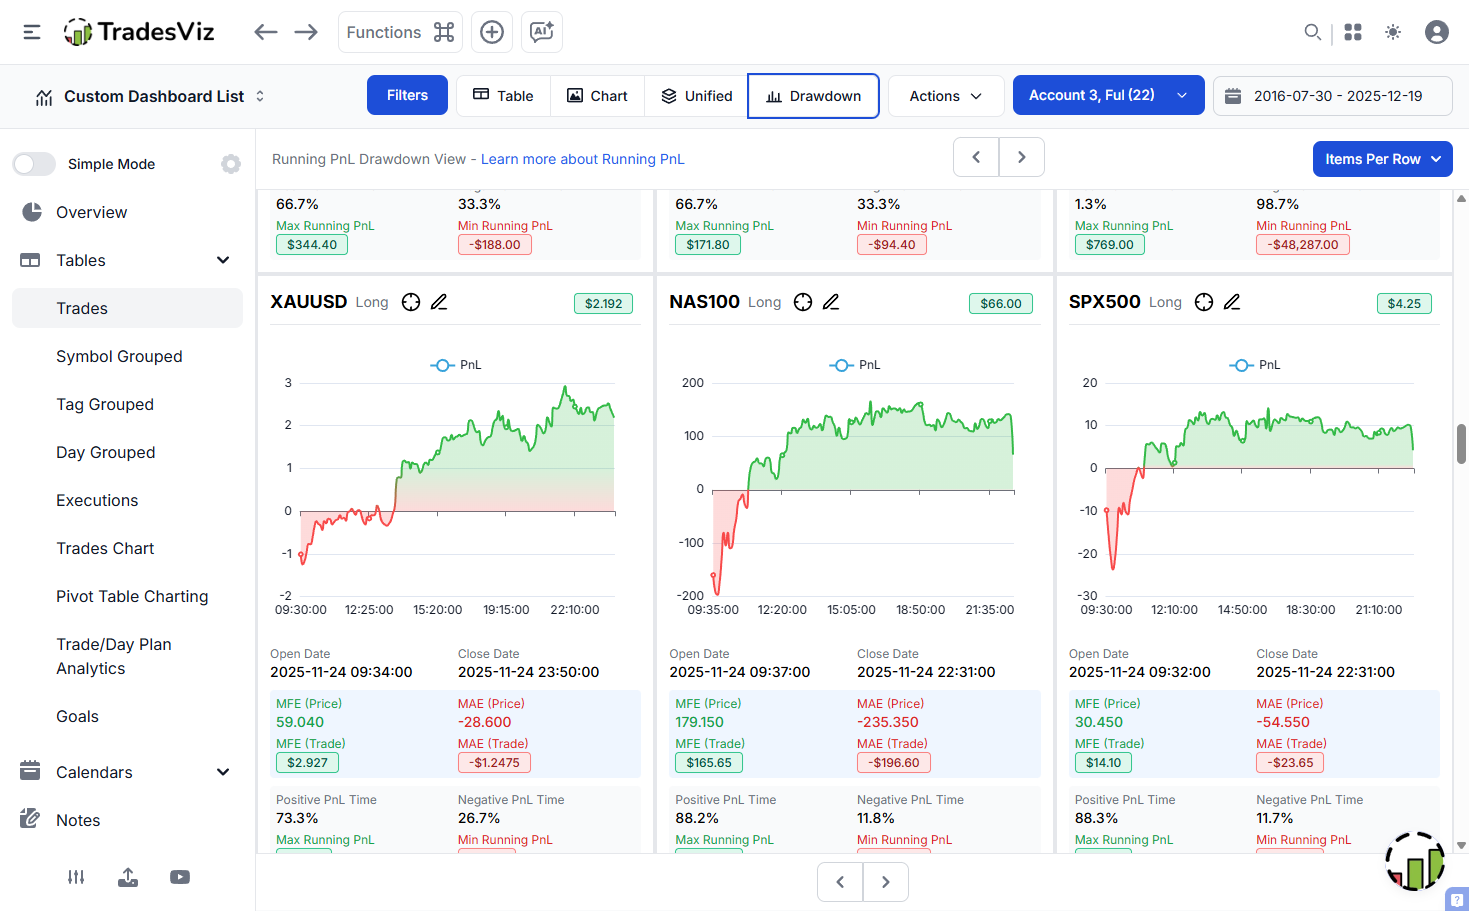
What is Drawdown View?
The Drawdown View displays the running PnL chart for each trade on the current page of your trades table - all visible at once. Instead of clicking into each trade individually to see the running PnL graph, you can now scan through multiple trades and immediately spot patterns in how your positions evolved over time.
This is particularly useful for:
- Identifying trades where you held through significant drawdowns
- Spotting patterns in how long you stay in winning vs losing positions
- Comparing risk exposure across multiple trades at a glance
- Quick visual review of your running PnL risk patterns
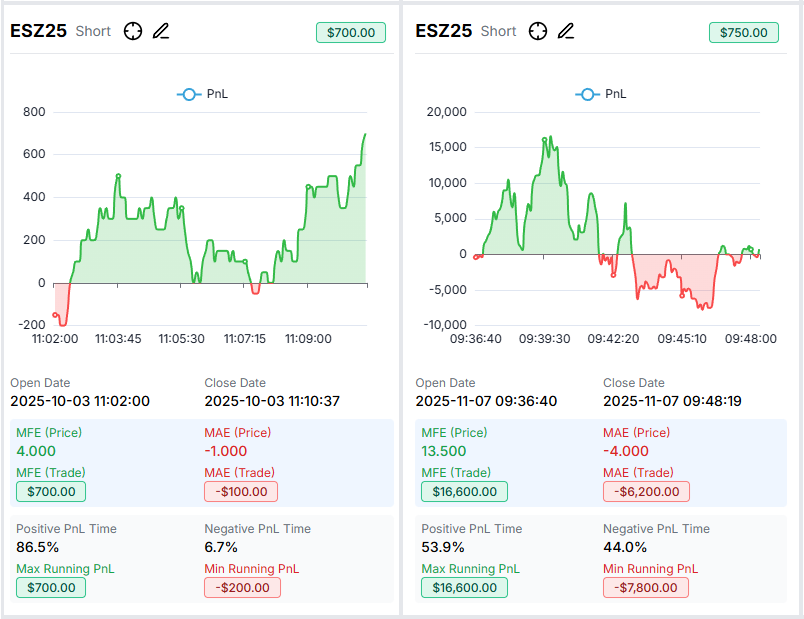
Anatomy of a Drawdown Card
Each trade card in Drawdown View contains:
- Header Row - Symbol, position (Long/Short), explore and edit icons, and the final PnL of the trade. Green background indicates a winner, red indicates a loser, dashed border indicates an open trade.
- Running PnL Chart - The continuous PnL graph showing how your position's value changed throughout the trade duration. Green shading shows when you were in profit, red shading shows when you were in a loss.
- Open/Close Dates - When you entered and exited the trade.
- MFE/MAE Stats - Maximum Favorable Excursion (price and trade value) and Maximum Adverse Excursion. These tell you the best and worst points during your trade. Learn more about MFE/MAE.
- Running PnL Stats - Percentage of time spent in positive vs negative PnL, plus the max and min running PnL values reached during the trade.
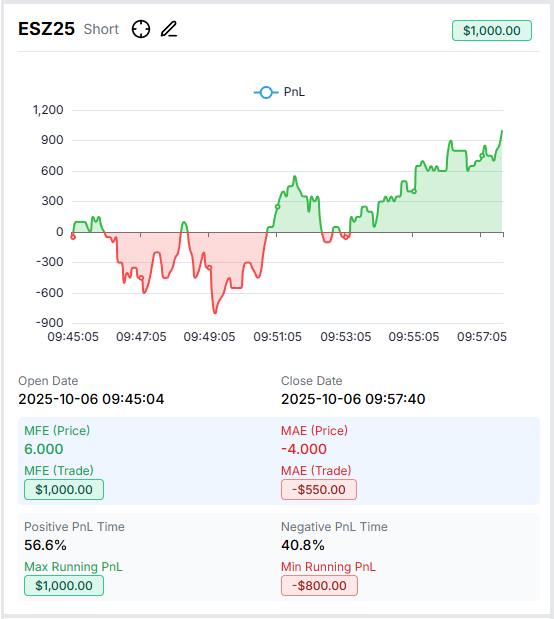
Why Running PnL Duration Matters
As we discussed in our Running PnL Risk Analysis post, understanding how long you spend in profit vs loss is critical for evaluating your risk management.
With Drawdown View, you can immediately see these patterns across multiple trades. Look at the "Positive PnL Time" and "Negative PnL Time" stats on each card - if you're seeing high negative duration percentages on winning trades, you might be holding through too much pain before your trades work out.
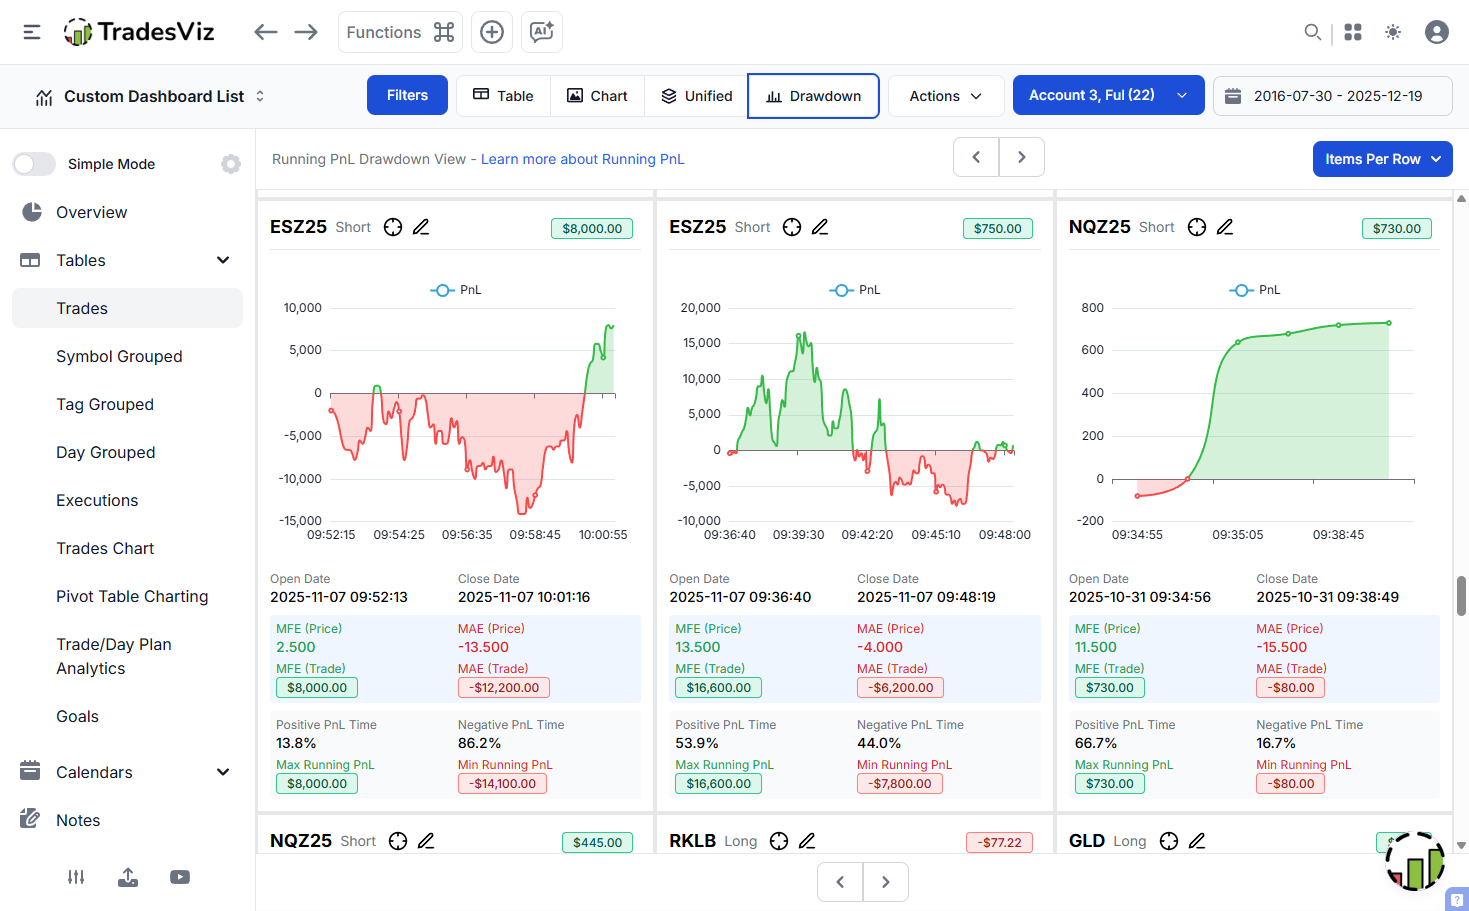
Combining with MFE/MAE Analysis
The MFE and MAE values shown on each card give you the duration-based context we've discussed before. When you see a trade with:
- High MFE (Trade) but lower final PnL → You didn't capture the full move
- High MAE (Trade) but positive final PnL → You held through a significant drawdown -> Are you sure you want to continue trading like this?...
- Low MAE and high MFE → Clean trade with good risk management
Now, instead of looking at these stats in isolation on the trade explore page, you can scan across many trades and quickly identify which ones deserve deeper analysis.
How to Use Drawdown View
- Navigate to your trades table
- Apply any filters or sorting you want (by date, symbol, PnL, etc.)
- Click "Drawdown" in the view switcher
- Use the pagination arrows to move through pages
- Adjust "Items Per Row" to show 1, 2, 3, or 4 trades per row
- Click the explore icon (crosshair) on any trade to dive deeper
Remember that running PnL data is calculated for stocks, futures, forex, cryptocurrency, and options trades (not yet for multi-asset trades). As with all advanced stats on TradesViz, the data is calculated using our high-resolution price data - including 5-second data for futures and S&P500 stocks. All the caveats, such as data not available on the same day, are explained on our advanced stats blog post. If you still do not see data even after EOD/next day, you can try recalculating the trades. This can be done easily for many trades at once using the trades table's action menu (actions > table actions > select all, actions > selected trades > recalculate).
We continue to build features that help you understand not just what happened in your trades, but how they unfolded. Combined with our MFE/MAE duration analysis and best exit analysis, the Drawdown View gives you yet another lens to optimize your trading.
Have ideas for what else you'd like to see in this view? Let us know: [email protected]