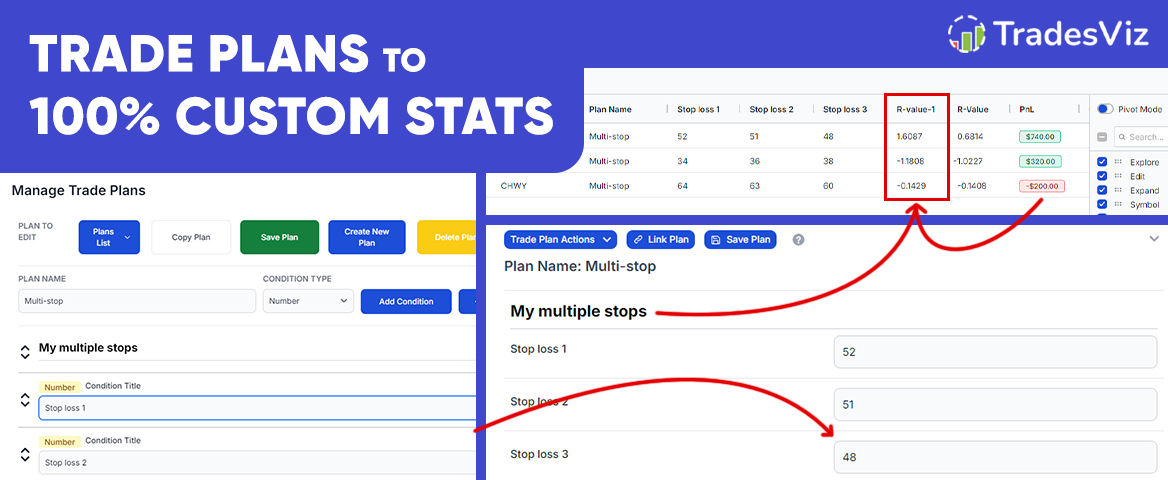
With the latest update to the pivot grid's custom columns and trade plans, it is now possible to utilize all of your numeric inputs as a formula or an expression to derive/calculate 100% custom metrics!
What does this mean?
Here's a COMPLETE A-Z example of how we combine 3 features: trade plans, pivot grid, and custom columns.
You can only enter and track one stop loss and profit target in TradesViz via the trade explore page (why only one? Because we use one pair of TP/SL to do many calculations for risk and open pnl, etc., and using many pairs of TP/SL would lead to a lot of confusion).
But what if you wanted many? AND what if you wanted to calculate R-value for each?....
Your first thought would be to use Excel - but that's just too slow, and your data is not there.
First, let's build a custom trade plan that has 3 stop losses.
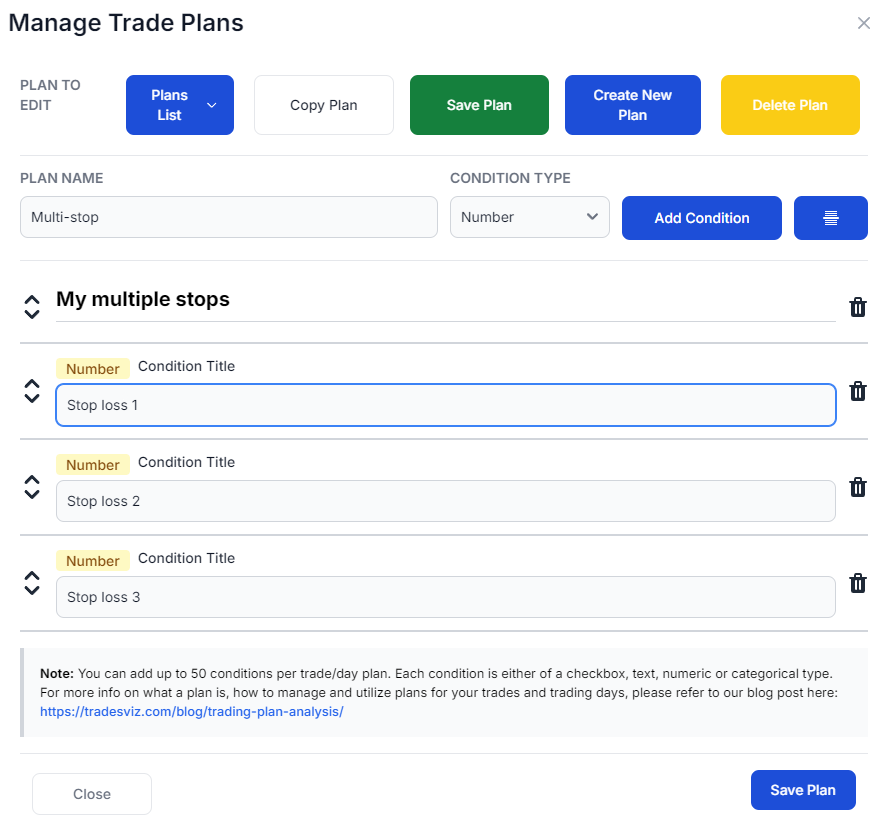
After the plan is created, we will add this to a few trades.
Now we will check the trade plans table tab, which will have the trades table that has all the stats of the trade + the trade plans conditions as separate columns.
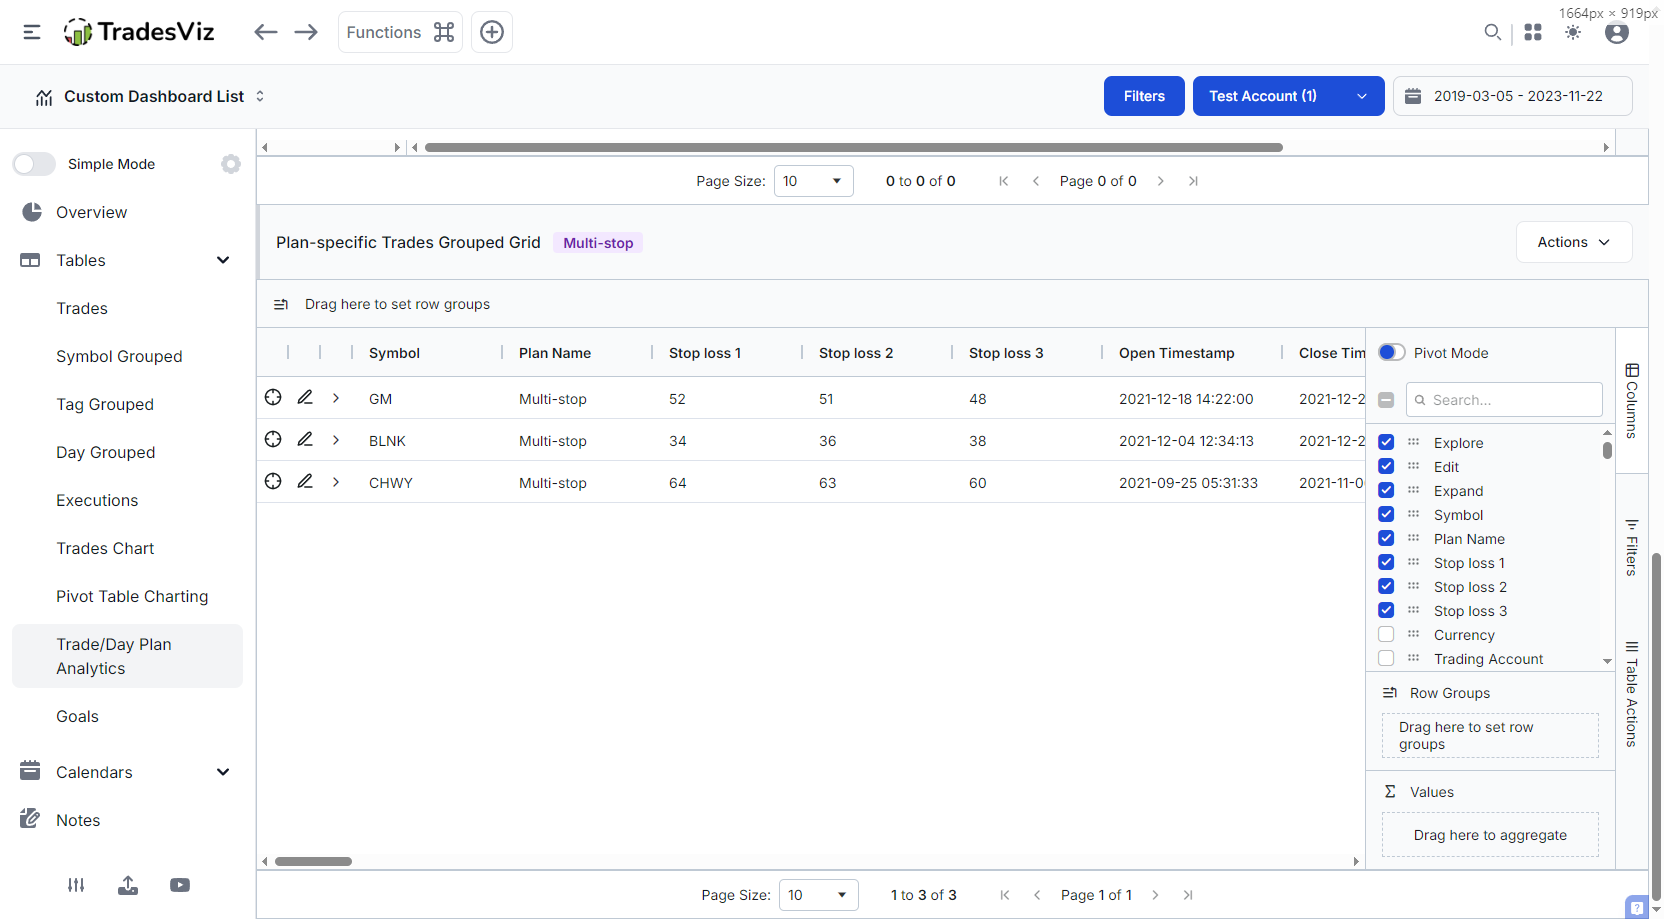
We can see the 3 stop losses for each trade that were added as a numeric condition to each trade. Remember that this is just an example of the application of numeric columns of plans + custom columns of pivot grid - you can enter ANY number (strategy, trade stats, etc.) as a numeric value.
In our case, the goal was to calculate the R-value for each stop loss. What's the formula for R-value?
We calculate the R-value as the ratio of profit (PnL) divided by total risk taken in the trade.
For example, if your PnL is $100 and you risked $50, the R-value is 100/50 = 2.0
If your PnL is $62 and you risked $120, the R-value is 62/120 = 0.516
In our case, we have entered the stop loss values as price (Note: TradesViz lets you enter stop loss as absolute values (total $-amount risked) or as $-/price- values - this can be configured in account settings) in the numeric conditions of the plans we added to the trade.
Let's take the example of the GM trade shown above. The 3 stop loss values we entered were 52, 51, and 48.
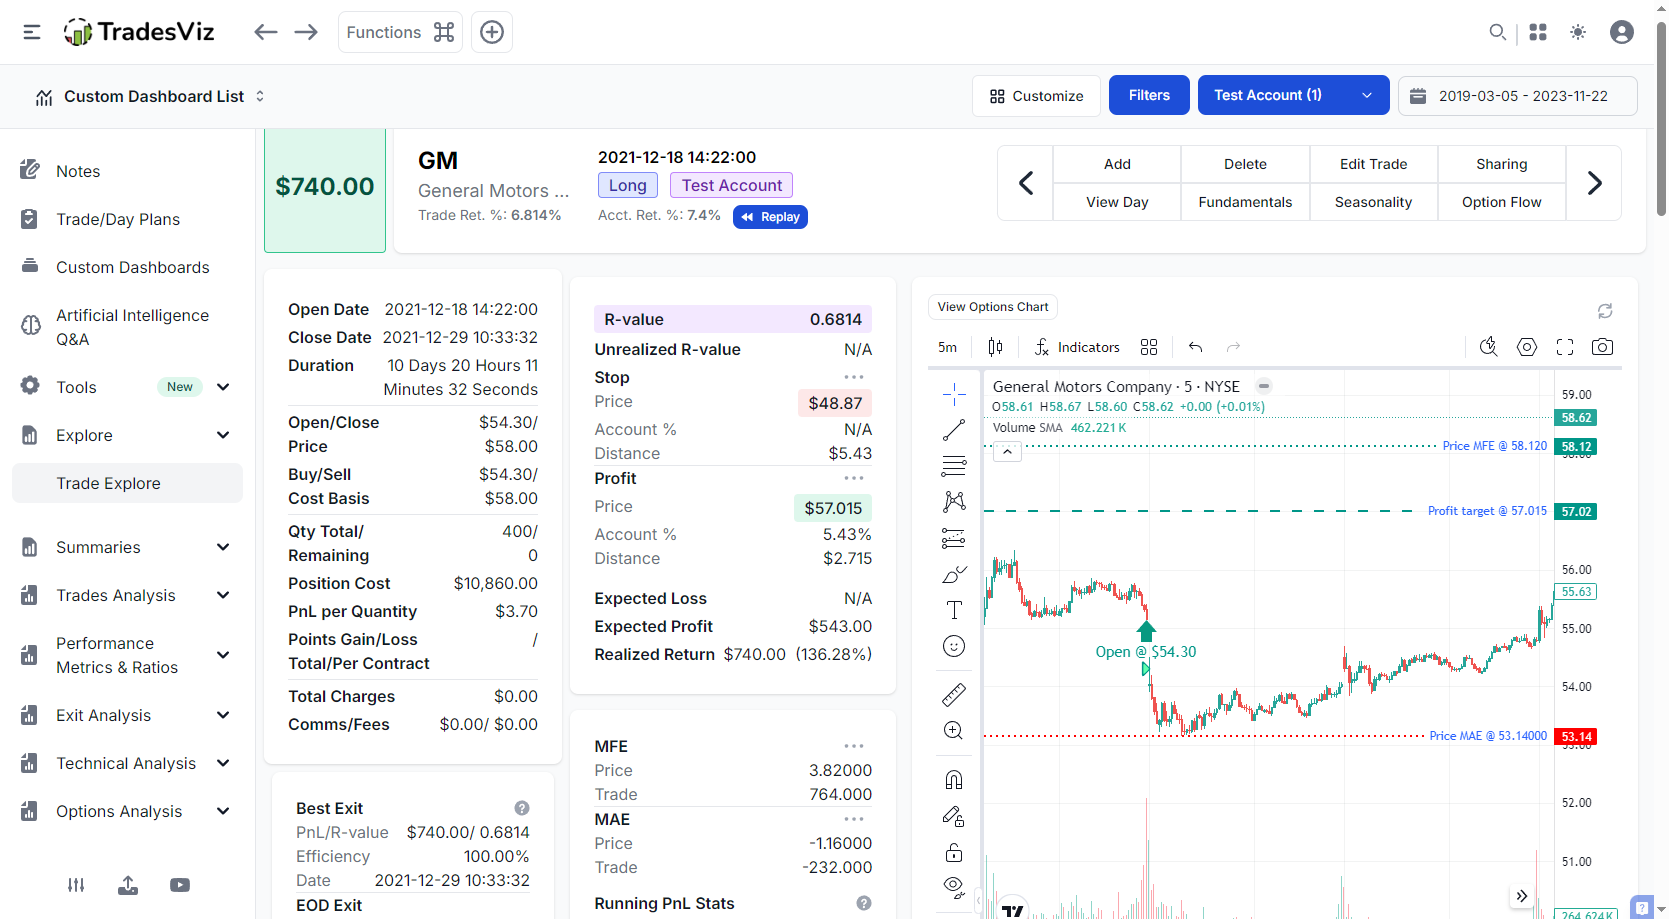
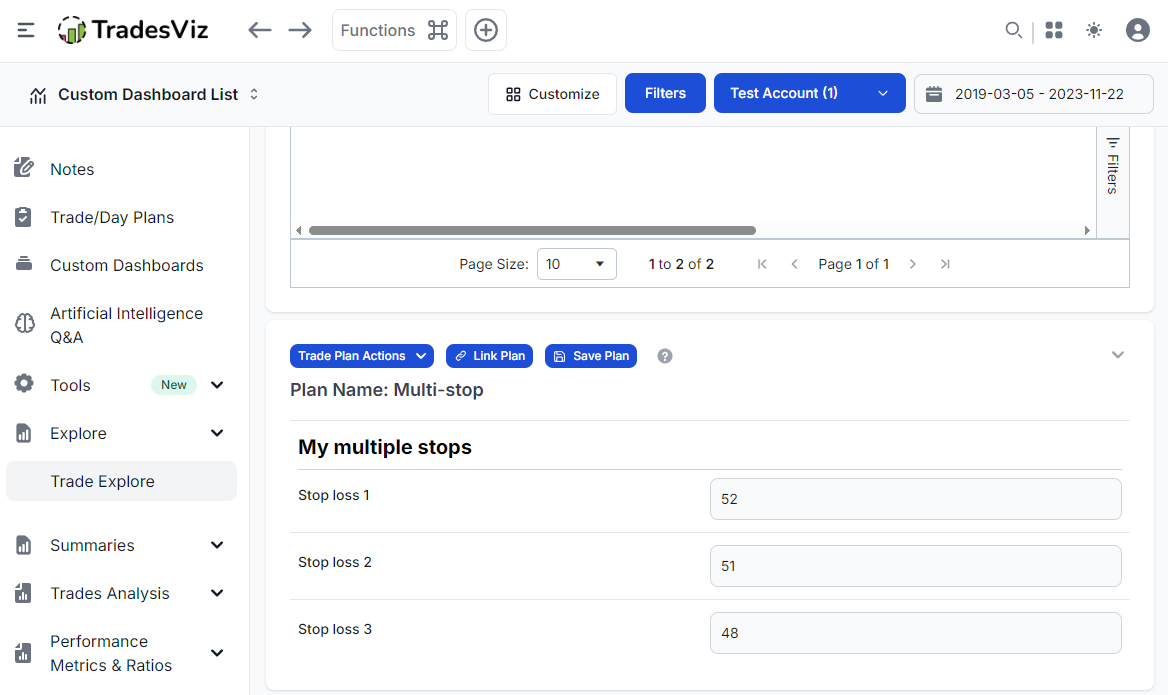
This is how the GM example trade looks on the trade explore page. We already have a filled-in stop loss value, but remember our goal - we want to define many stops and get R-values for all.
Now, it's time to create the custom column via the pivot grid. Click on Table actions > "Add custom column" and enter the formula for calculating R-value using price.
Remember, R-value is calculated by dividing PnL by total risk. We already know and have access to Pnl via the PnL stat of the trade. But what of the total risk?
We can get it by finding the difference between the stop and entry price multiplied by the total buy quantity.
(Entry price - stop) = Total risk per share
(Entry price - stop) * (Total buy quantity) = Total risk for the trade
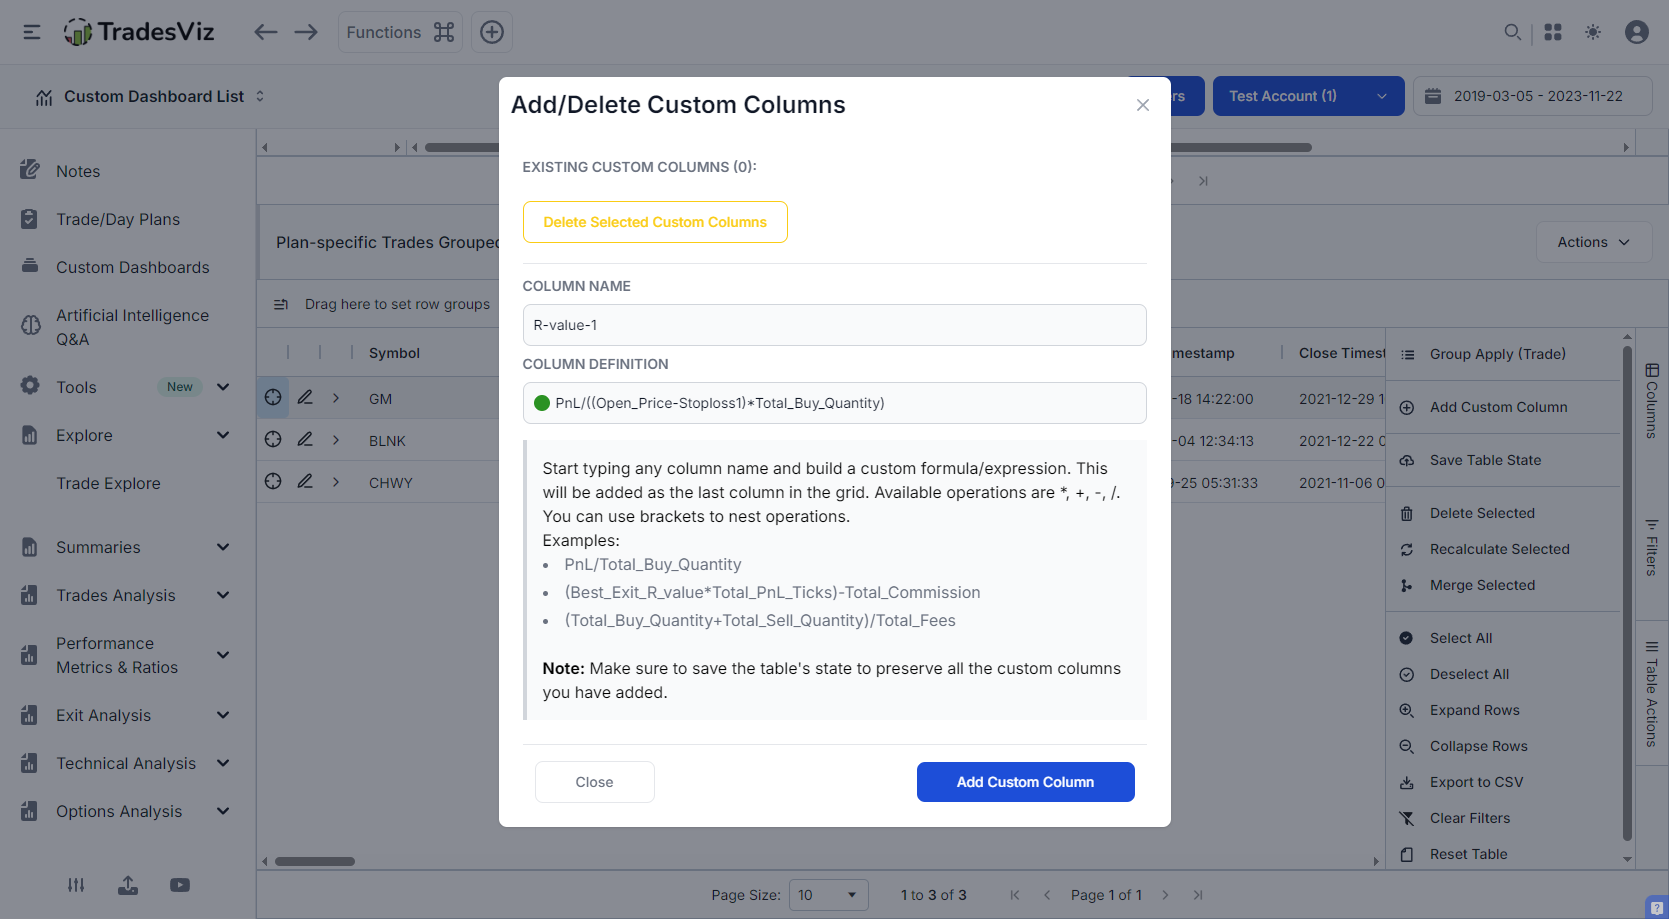
This is precisely what we are going to enter in the custom column definition. The NEW feature here is that you can now use ANY of the numeric columns alongside the trade stats for creating 100% custom here - this was not possible before!
Now check the results after adding the custom column - the new column will be at the right end of the trades table (the last column). To show the values together, we've rearranged the columns to show the new R-value based on the custom numeric condition Stop loss 1, near the actual stop loss and PnL value.
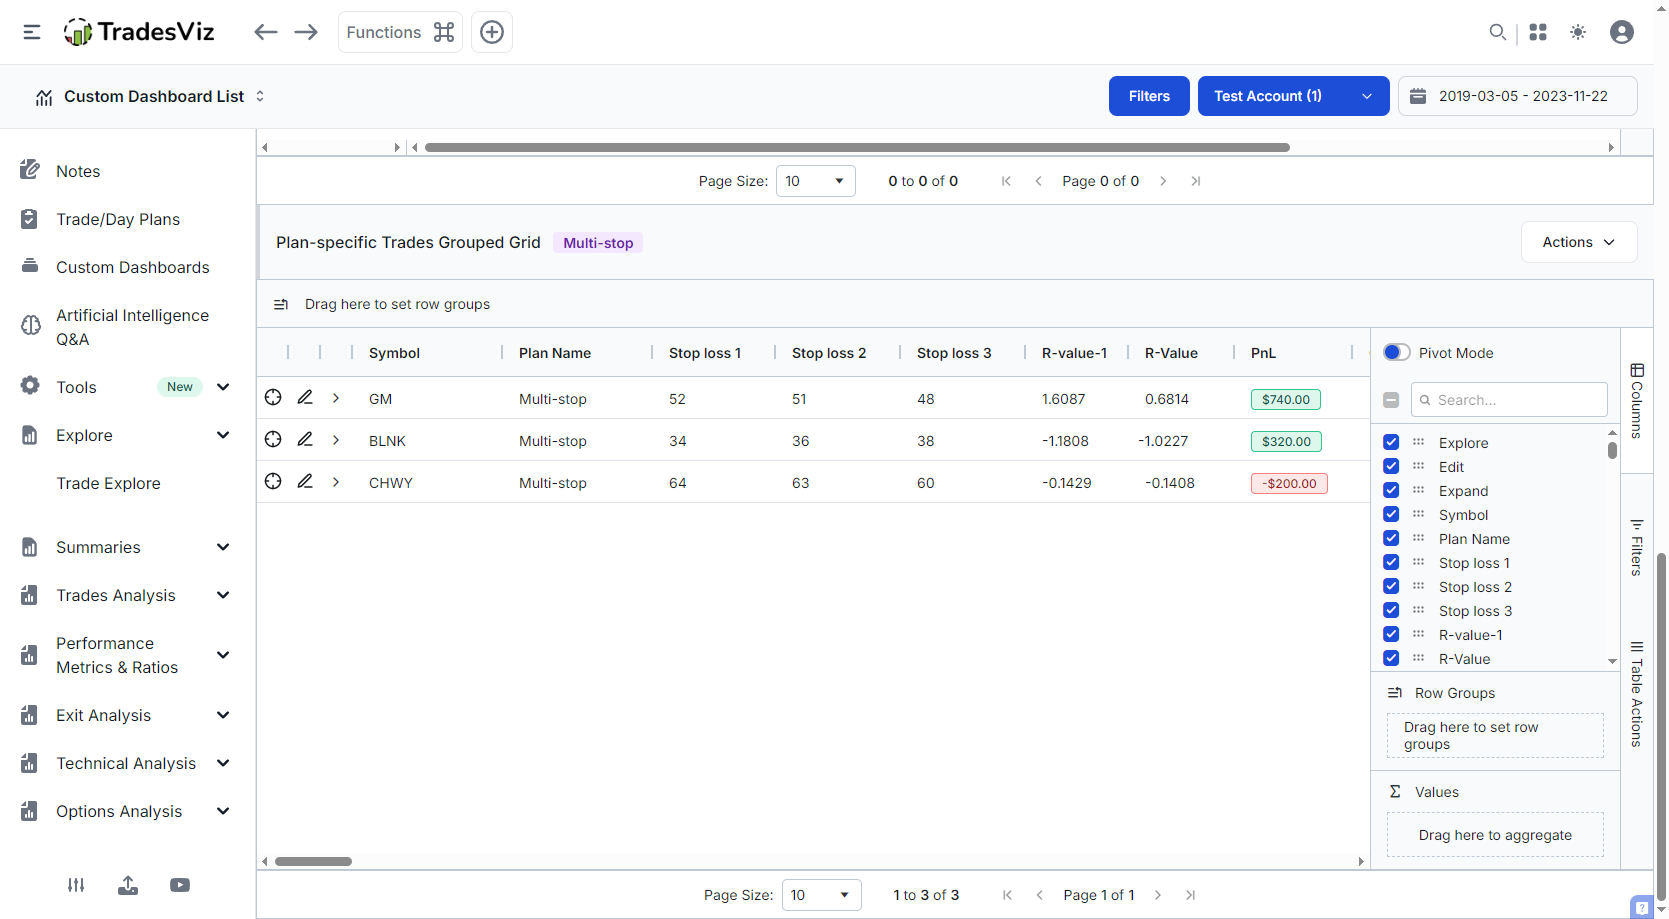
You can now see the calculated values.
We had just the raw stop loss values as numeric fields in plans.
Like this, you can calculate/create custom R-values for the other stop losses also.
(Note: Remember to save the table's state to retain your custom column! Click on table actions or actions > save table state!)
Hope you have now realized how valuable your data in your journal is, and with TradesViz, how much you can utilize that data :)
We started looking into ways to generate custom/user-defined metrics, and one of the solutions was AI Q&A - although non-deterministic, it has worked extremely well. But we wanted users to have 100% control over the full process, such as defining the value and the formula, etc., which is why we made these improvements to the pivot grid and the custom column features.
Our goal at TradesViz is to solve problems in journaling and trading analysis. Every feature has a meaning and is created by talking to users to get feedback and doing a lot of internal testing - this feature is no exception. It was born out of a necessity to be able to define metrics that each user needs at each phase of their trading.
Now it's time for you to add all your custom stats that you've wanted to add so far :) Ditch your extra Excel sheets or outdated, overpriced journals and start journaling with a clear goal on TradesViz using trade plans.
We have a lot of great new features coming out this year! So if you are new to TradesViz, do sign up, read our getting started guide, and enter into the world of real trading anlaysis!