With the number of trading accounts per trader continually growing, it is worth revisiting this feature with v2.0 upgrades. Introduced in the second half of 2022, the account statistics tab is a way to view trading account performance metrics and visualize the overall pnl over time for many trading accounts at once.
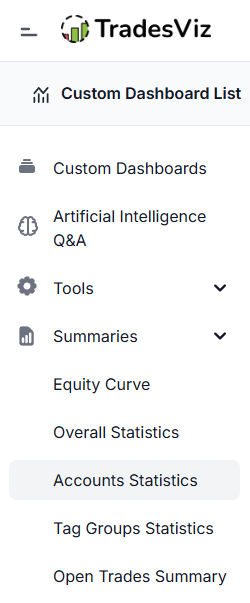
Since the v2.0 version of TradesViz introduced grids, this greatly improved the utility of the account statistics tab. You can find the account statistics tab under the "Summaries" section in your TradesViz dashboard. If you have turned on simple mode, uncheck it to see the full summaries section.
The overall tab's layout is straightforward: you will see a chart with multiple cumulative pnl lines (one for each account) and a detailed grid at the bottom organized by sections or categories of the metrics.
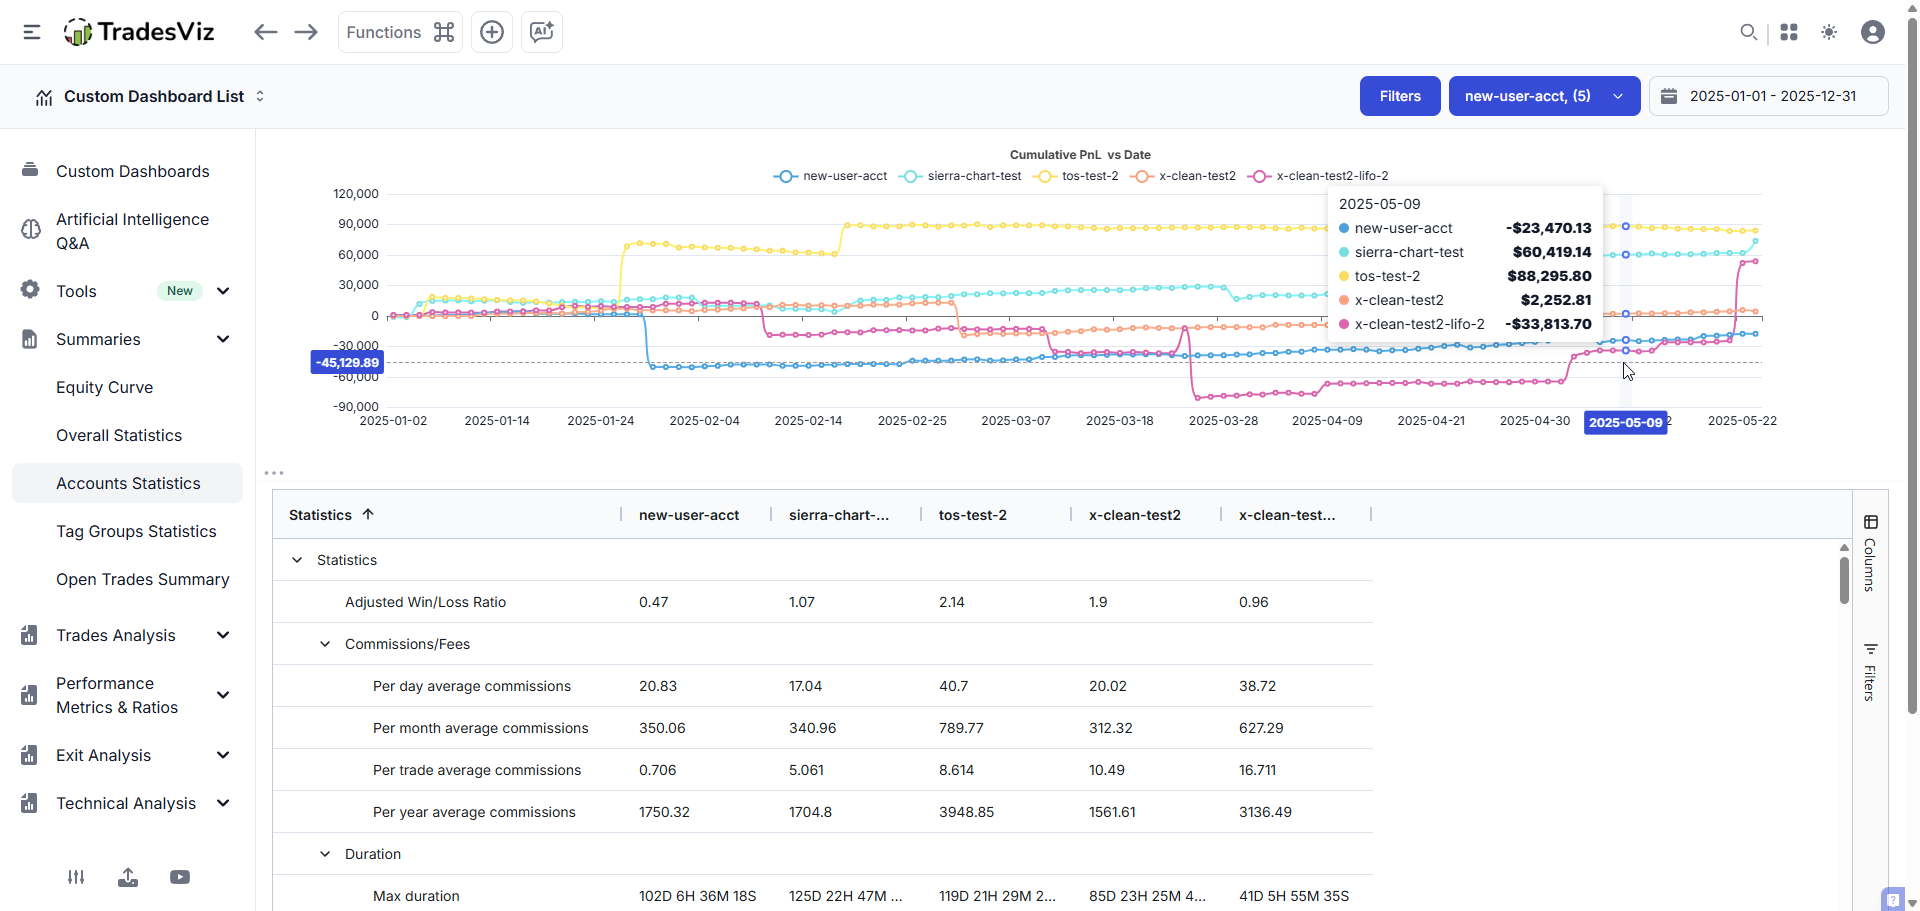
This is the easiest way to view the performance of all of your trading accounts on one page on TradesViz. You'd think such a basic feature would be available on other journals also? Think again. This was introduced in 2022 in TradesViz - none of the current journals still have anything close to this.
What's even better is the improved grid compared to the original version of the account statistics tab - every stat can be filtered, visualized, and exported. See the example video below showing how charts can be created simply by clicking and dragging the cells:
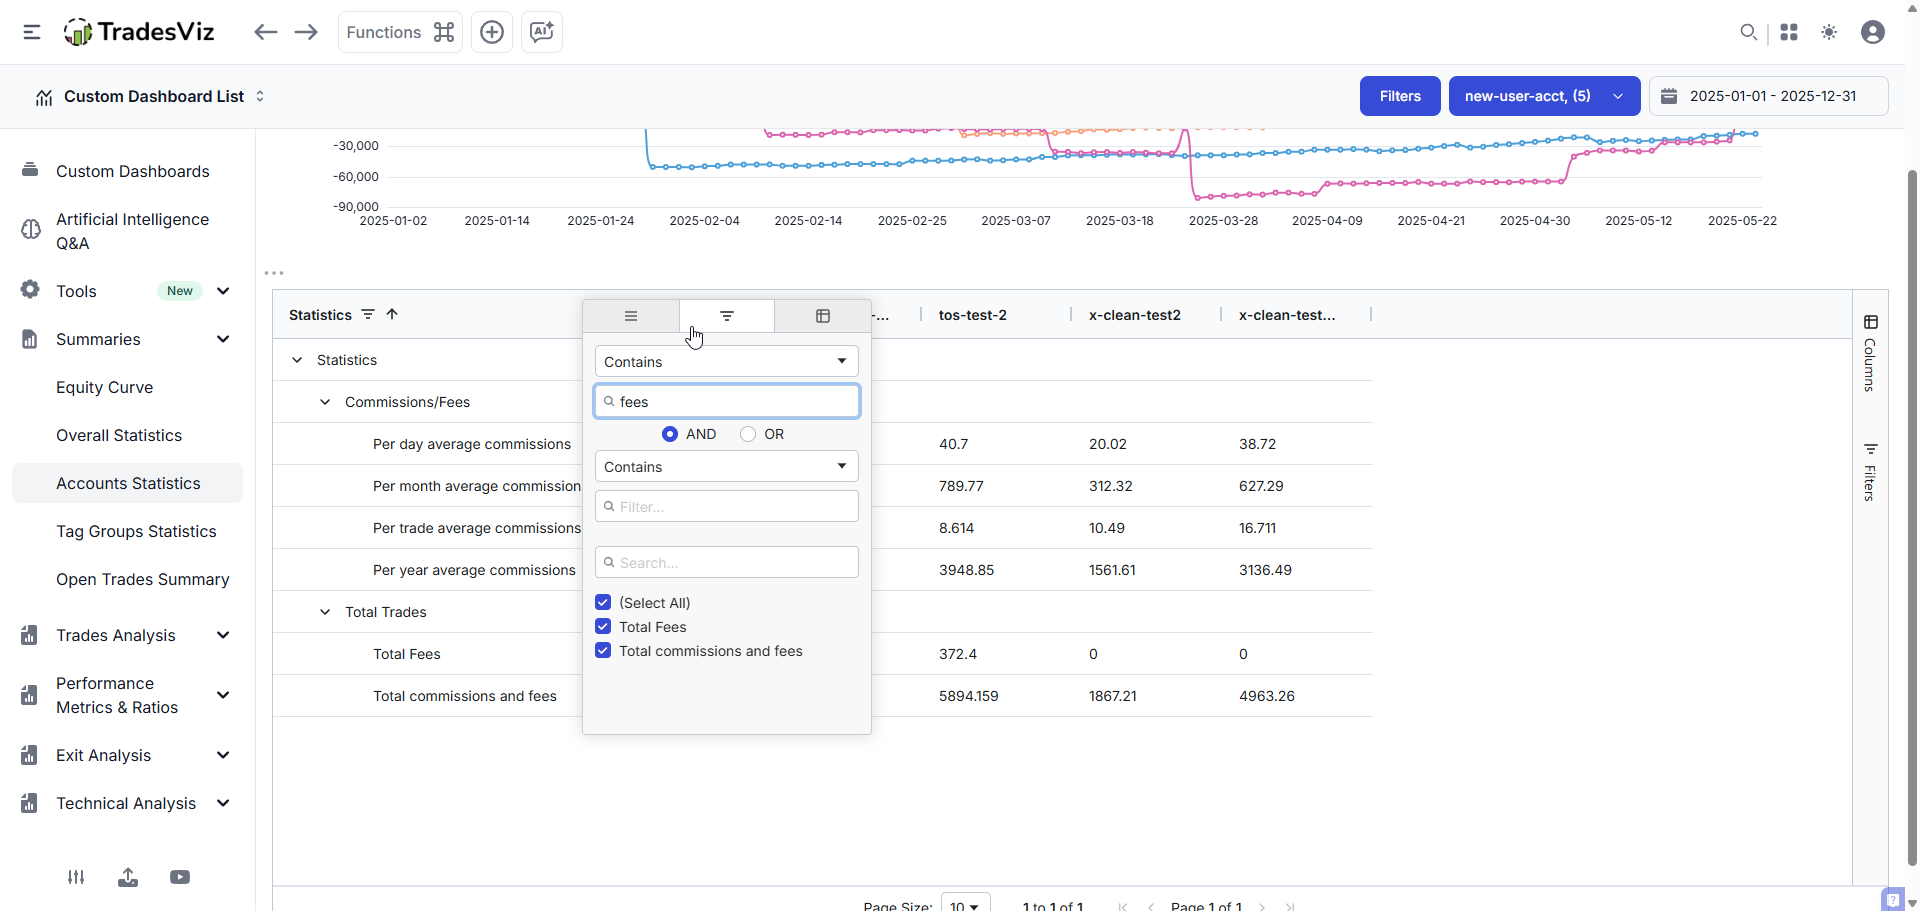
Filtering is also possible. For example, if you wish to filter for only certain pnl metrics out of the dozens available, you can hover over the statistics column and filter for the specific columns you need.
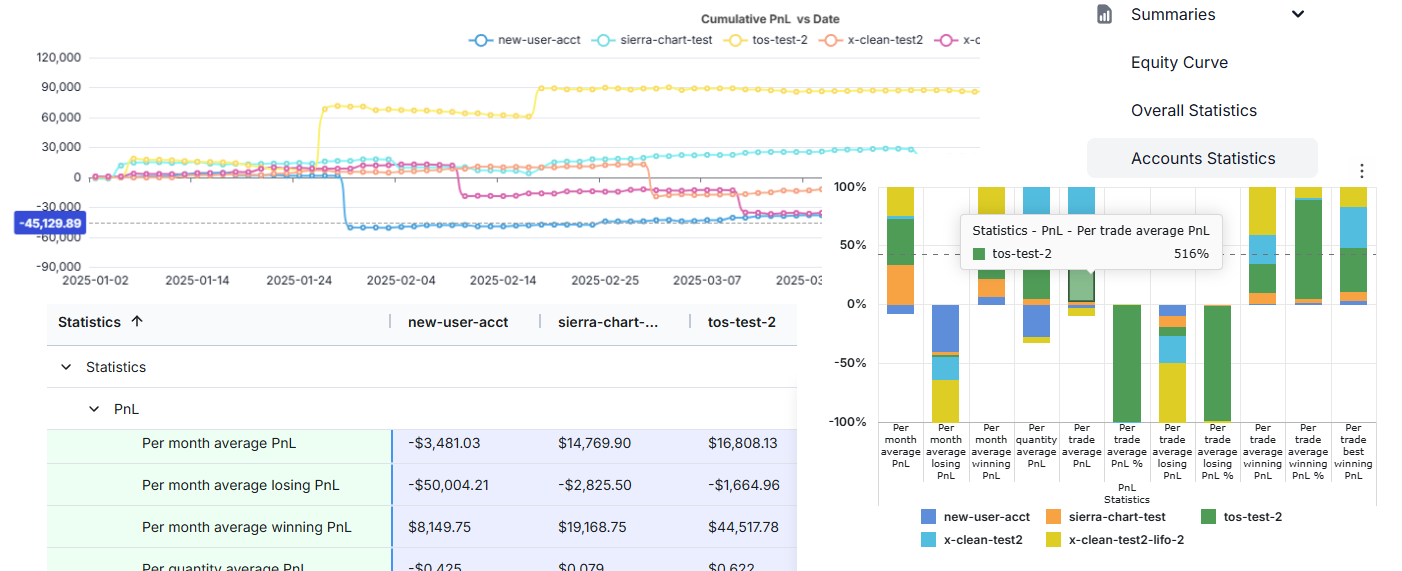
Another interesting feature is related to the charts (also part of the v2 upgrade). In case you have not yet noticed, you can click on the chart to zoom and switch the data type. Here's an example with data type switched to bar + stacked (the controls are at the top right corner of the zoomed chart)
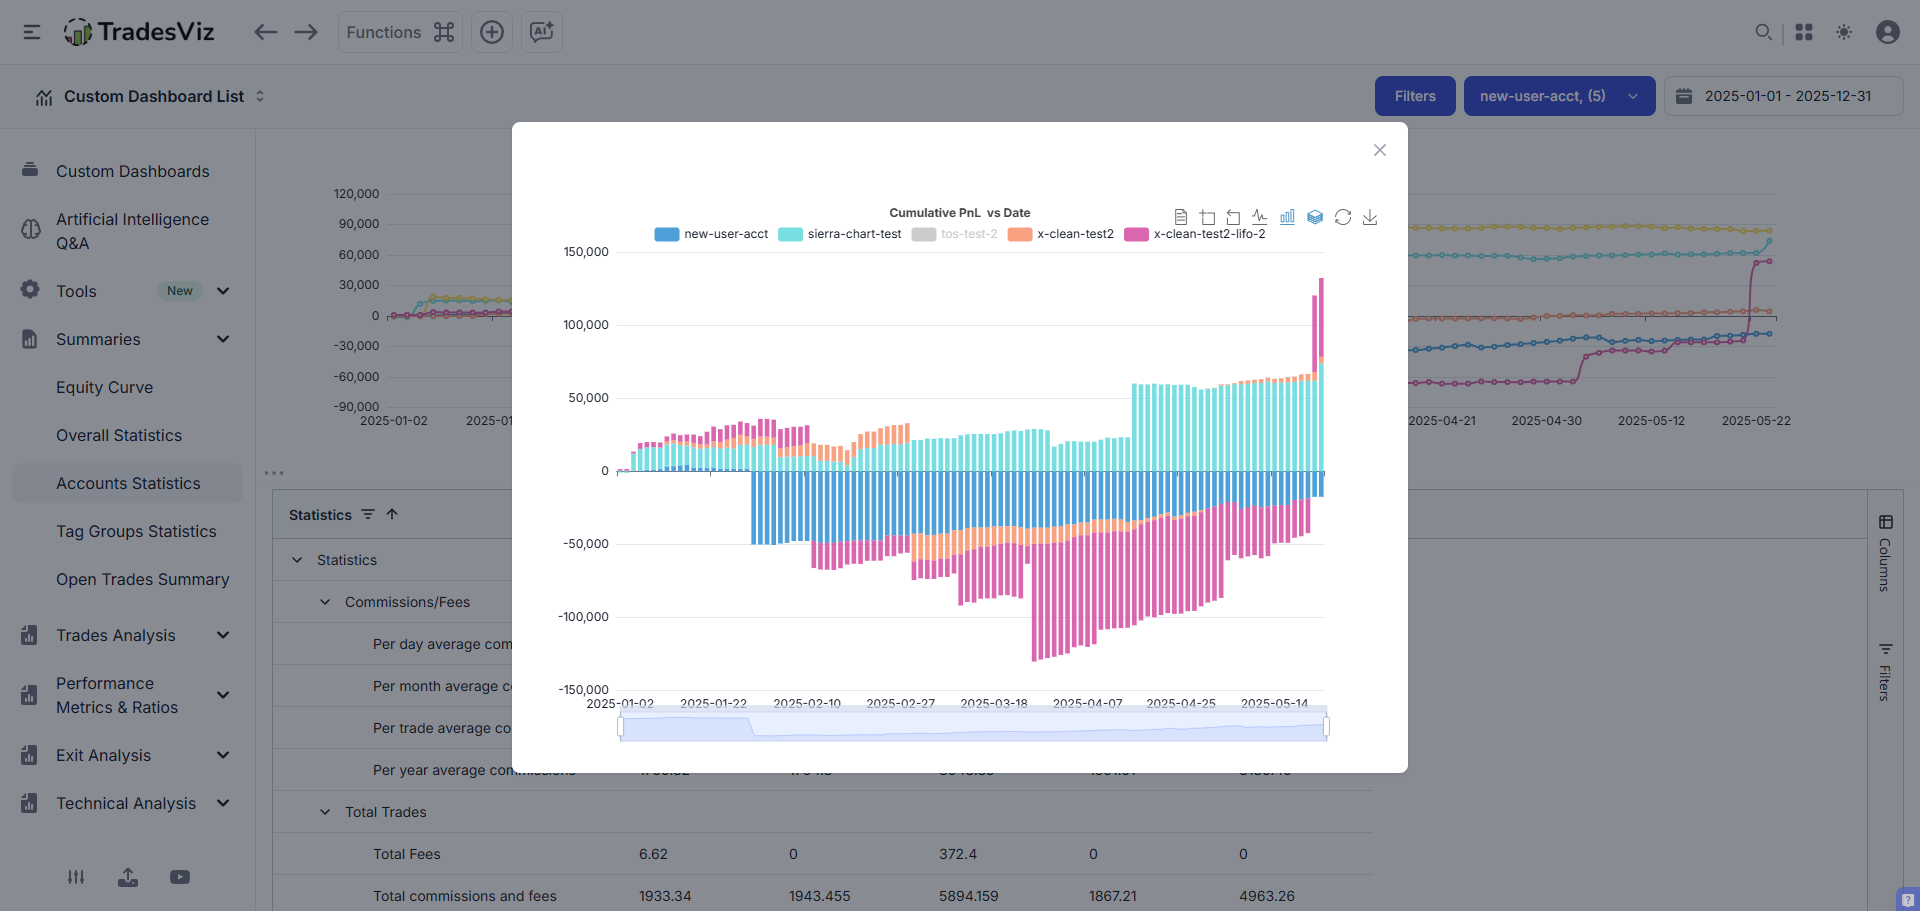
It is also possible to hide/show certain data series (or, in this case, trading accounts) by clicking on the respective trading account in the legend section at the top of the chart.
The grid has ALL the data that you'd see in the Overall statistics tab, so this covers most traders' requirements, but if you need more specific stats, you can make use of the AI Q&A to generate charts that are highly specific to your use case.
Do you want to see more additions to this tab? Or do you see something that could be improved? Let us know at [email protected].