![[Updated] New feature: Chart Trades View in TradesViz v2.0](/media/blog/chart_trades/chart_trades.png)
Last Update: Aug 2024
When we launched TradesViz in late 2019/early 2020, it was only possible to view individual trades via interactive or static charts in the trade or day views. But over time, we became the first trading journal to have custom interactive charts (pre-integration of TradingView charts) and now, we have full support for TradingView charts across TradesViz in TradesViz v2.0.
Here are some of the TradingView features/customizations available on TradesViz:
- About TradingView charts: https://www.tradesviz.com/blog/technical-analysis-charts/
- Chart trades view: https://www.tradesviz.com/blog/chart-trades-view/
- Global chart templates (indicators): https://www.tradesviz.com/blog/global-tradingview-templates/
Chart trades view - the feature in this blog post was first launched in Aug of 2020 and has been continually revamped over time. It still remains the only feature online where you can view ALL your trades in a single Tradingview chart for any symbol.
This tab's name is "Trades chart" and available under the "Tables" view.
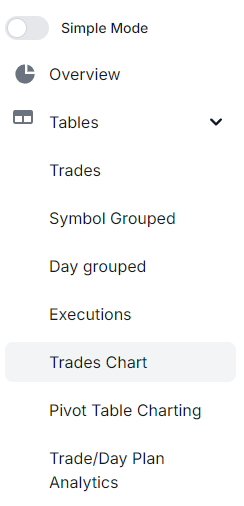
In the Trades Chart view, you just have to type and select the symbol you want to view.
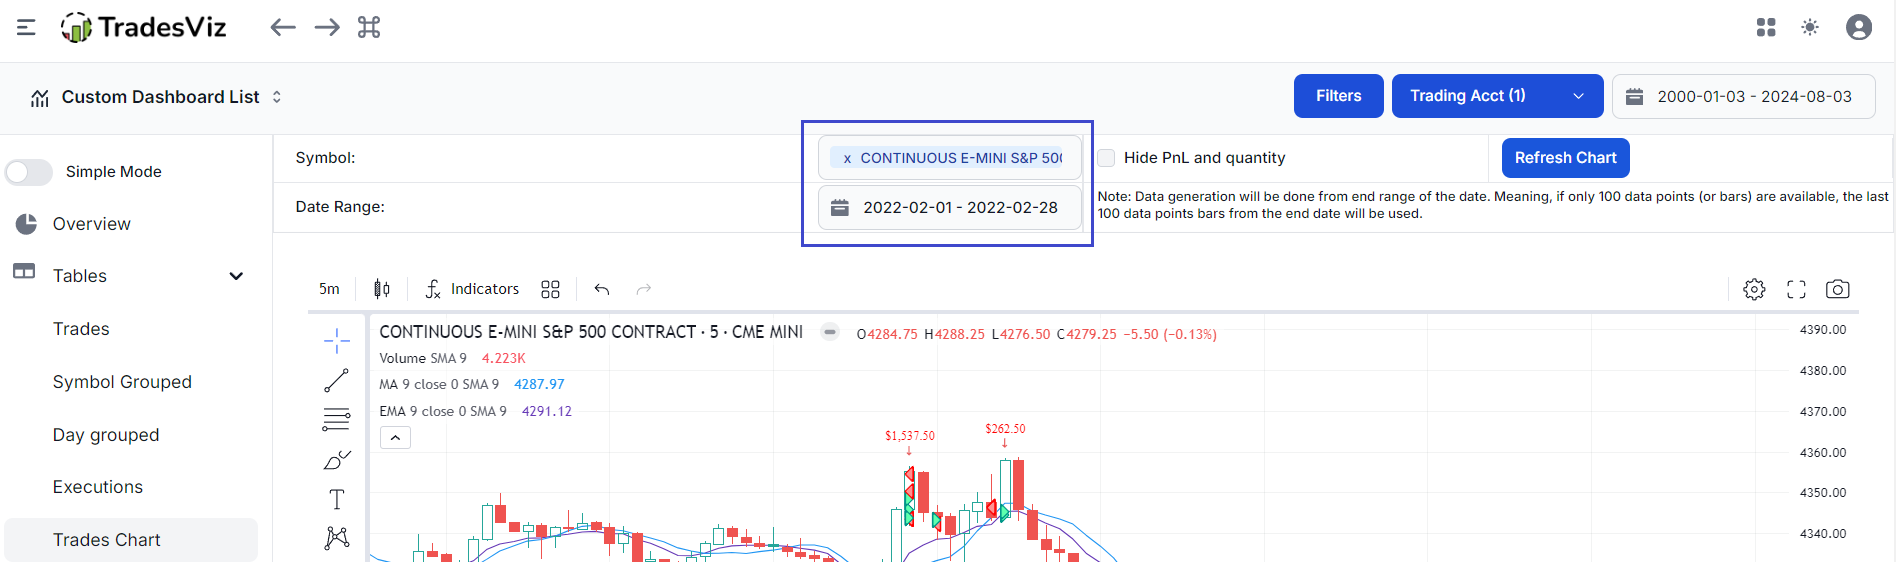
All your trades along with the chart markings will appear after clicking on "Refresh chart"
A fully interactive chart will now appear in the empty area in the tab with all your trades plotted. Note that, the trades shown depend on the date range you select at the top of the page. The global parameters and filters are also applied! Here's an example chart showing ES trades with candlesticks and MACD, and MAs as indicators.
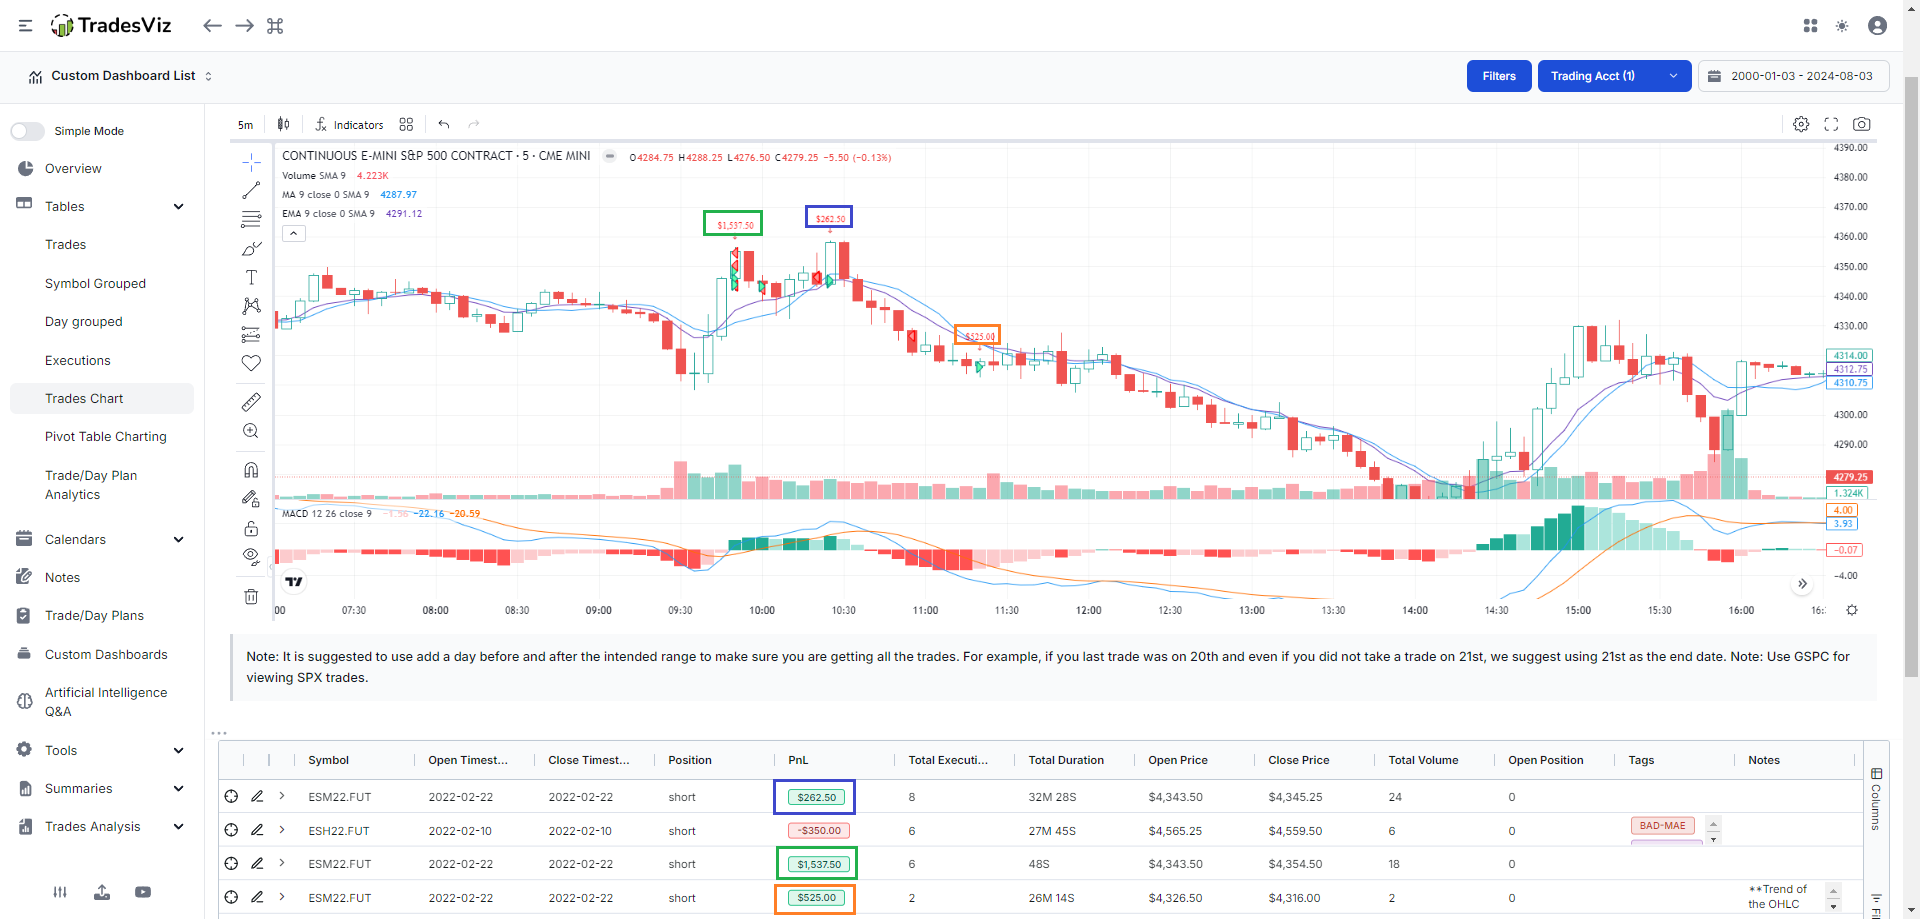
You can change the settings anytime by going to the chart settings again and setting your preferences. Functions like zoom, pan, scroll are all available in this chart. We not only show you the chart - you can scroll down to also see the actual trades!
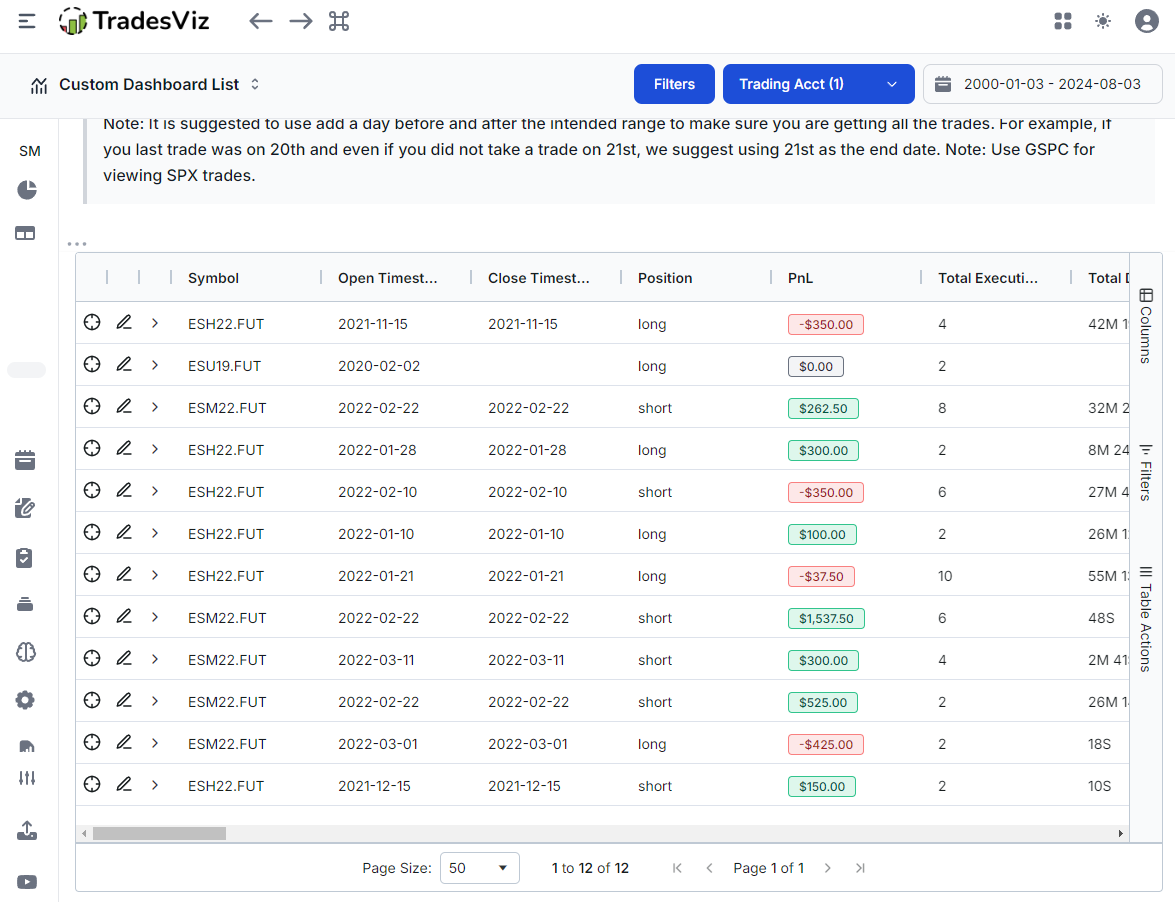
This way, you can not only look at the trades on the chart but also see the exact statistics and details about the trade right below it! Note that this table is exactly the same as the main trades table - meaning, you can go straight to the trade itself by clicking on the target icon and also view the executions all in one place!
Over the years, we have added many QoL features that have made this to be one of the most used and loved features among traders.
- You can choose any timeframe - from 1W to even 1 minute to view all your trades. There's no limit on no. of trades that can be viewed meaning, you can review all your trades for a symbol over an entire month/year in a single chart!
- It's possible to hide your PnL in case you want to share a screenshot on social media whilst protecting your privacy of account size.
- This feature works for ALL symbols: stock, futures, forex, crypto, CFDs, etc., across the 4 exchanges we support: US, CA, AU & IN, and also all global indices!
- [NEW] Our newest update makes sure that you are now able to save your drawings as well so that you can come back and view your charts at any time with your technical analysis
Demo of auto-saving drawings on chart (Click to play):
We hope this feature serves as a good solution for traders who trade with multiple brokers but still want to visualize and look at all their trades in one single place!
This is a feature request by one of our users so, if you have any ideas or want anything implemented, be sure to let us know by emailing us at [email protected]! TradesViz is shaping up to be a perfect all-in-one tool for trading performance analysis, journaling, and more - all of this would not be possible without the help of our user's feedback and feature requests!