
TradesViz
🗓️Next tab to be updated on TradesViz: You will now see a cleaner calendar, with proper highlights and a simpler toggle UI. Soon: High-impact events and more useful calendar features. What do you want to see next?...

TradesViz
🗓️Next tab to be updated on TradesViz: You will now see a cleaner calendar, with proper highlights and a simpler toggle UI. Soon: High-impact events and more useful calendar features. What do you want to see next?...
TradesViz
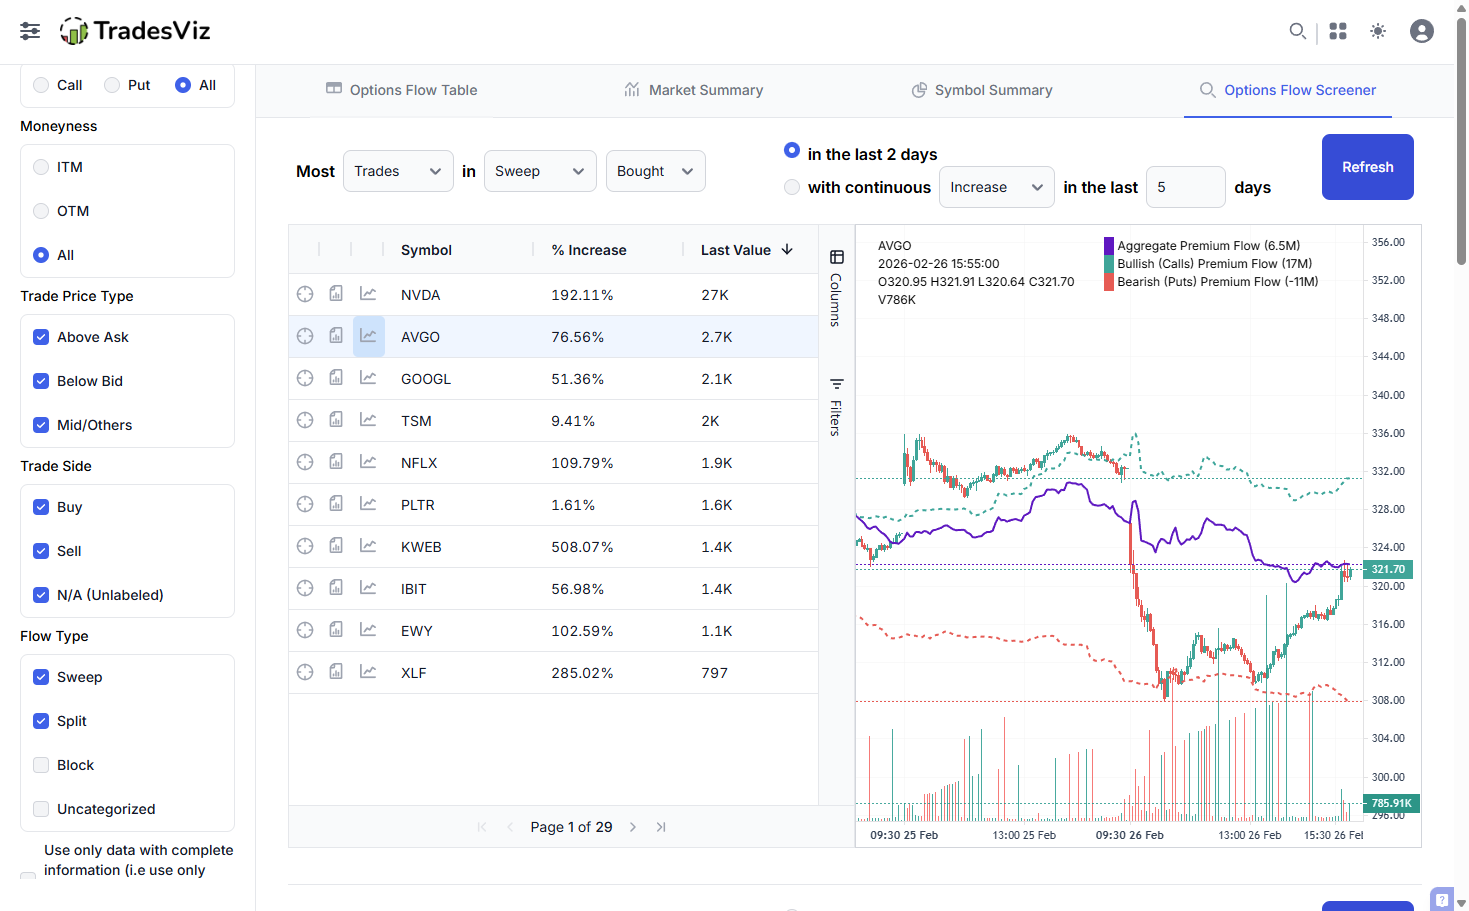
Interesting options flow from TradesViz screener: 1: Most trades in sweep bought in last 2 days: $AVGO 2: Divergence + Split buying: $ENPH For more interesting screens, check the options flow tool in your TradesViz dashboard!
TradesViz
Top options flow prints from yesterday: $NVDA $MU $ORCL $MDB $PLUG We have the usual list 🥱 BUT... be sure to check the market summary and flow screener 🔎 on TradesViz Options flow dashboard - that's where the gems are... 🤫

TradesViz
"Try this for 30 days." A basic journal is just a diary of your mistakes. A professional Command Center like TradesViz actually helps you fix them. The path to profitability is a loop: Journal ➡️ Explore ➡️ Plan ➡️ Execute ➡️ Evaluate. As we close out the month, find ONE anomaly in your data and make a plan to kill it. Stop repeating the same errors. Build your business. 🏗️

TradesViz
A green PnL often masks poor execution. Look at the Running PnL Drawdown View. It maps the exact path of your positioning from entry to exit. The tape shows a $ESH22 long trade closing for a $100 profit. A retail trader celebrates the win. A desk analyst looks at the underlying data. This specific execution spent 84.4 percent of its duration in negative territory. The maximum adverse excursion reached a negative $262.50 before the recovery. You did not have an edge here. You just survived the variance. This notable activity is exactly why you track running drawdowns on TradesViz. Measure your true conviction. Stop letting the final result hide your actual risk.

TradesViz
Stop looking at individual trades. You need the macro view of your positioning. The Trend Analysis isolates the aggregate sum of your PnL grouped by day. The tape shows a slow recovery followed by a massive outlier on April 4th. Amateurs stop analyzing there. A professional looks at the subsequent data. Following that peak, the daily variance expands drastically. The aggregate trend loses all structural consistency. This is how you measure true conviction. Is your execution scalable, or are you just surviving the chop?

TradesViz
A raw execution blotter is just an accounting tool. To find true conviction, you need to visualize the tape. Pull the Range Chart overlay to instantly map your daily PnL against your open prices. This isolates your notable activity and shows you exactly where your positioning is actually working. Stop exporting endless rows of data. Let the visual overlay dictate the strategy.

TradesViz
⏫ TradesViz Dashboard Upgrade: - All UI fonts have been improved (esp. numbers) - Tables now show details for options - You can toggle between tables in a single tab now - Sidebar is much cleaner and simpler Also: Calendar, account settings clean up, and more!

TradesViz
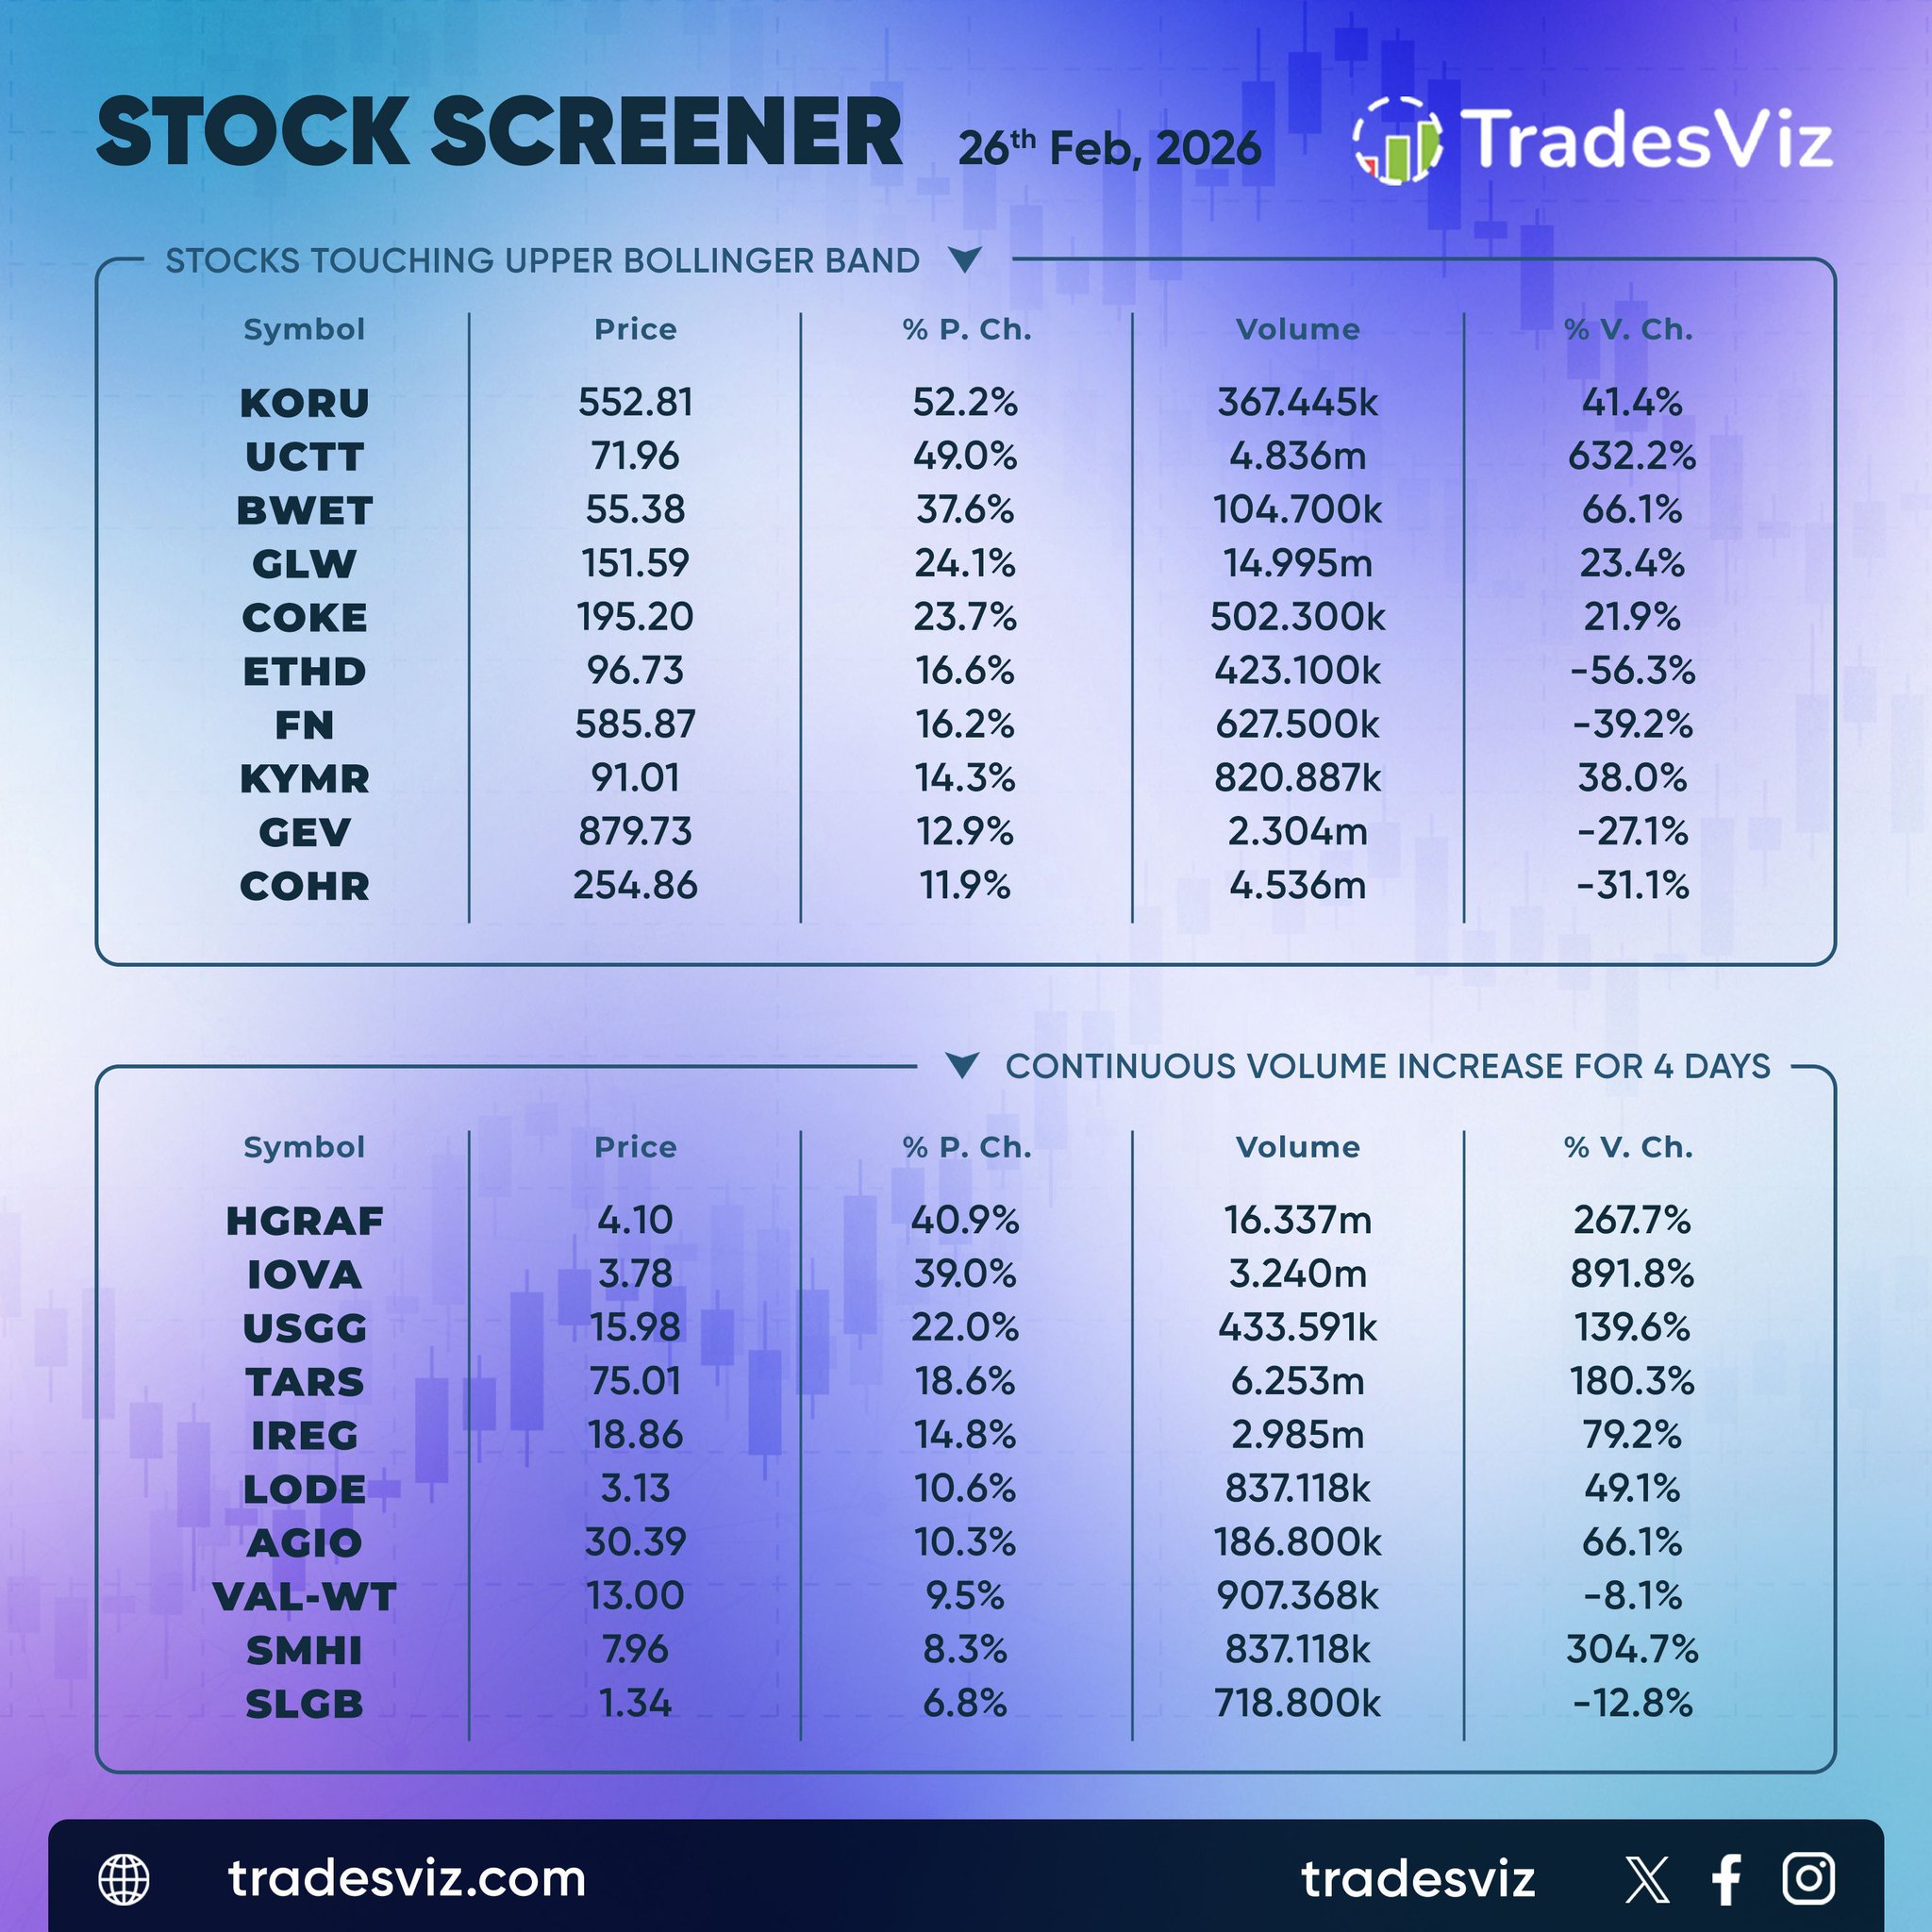
Momentum stayed firmly on the tape for February 26 as multiple names pressed into upper Bollinger levels and sustained multi‑day volume surges. $KORU led the breakout list with a 52 percent move as volume spiked more than 40 percent, followed by $UCTT up 49 percent on a 632 percent volume jump. $BWET and $GLW each showed clean continuation, their price and volume confirming active accumulation. The second group highlighted durable interest, with $HGRAF and $IOVA showing four straight sessions of expanding turnover, up 267 and 891 percent respectively. $USCG and $TARS added consistent strength with elevated liquidity. When price tracks higher in step with multi‑session volume expansion, it often signals conviction rather than speculation. The market remains selective but clearly risk‑on across trend‑confirmed names.
TradesViz
The tape on February 26 showed concentrated sweep‑side selling over the past three sessions, with tech and crypto names drawing the bulk of the action. $NVDA led with sweep trades up 101 percent, signaling aggressive premium turnover following its recent volatility spikes. $AMD and $TSM followed closely, each showing strong sequential increases as option volume clustered around near‑term strikes, hinting at active profit‑taking. On the speculative side, $COIN and $CRCL posted triple‑digit jumps of 256 and 271 percent, evidence of fast money rotating out of high‑beta exposure after an extended run. $IBIT’s chart confirmed steady selling pressure, yet price resilience suggests controlled repositioning rather than panic. Overall, the flow points to disciplined de‑risking within large‑cap semis and crypto‑linked names while maintaining structure, a sign of institutions fine‑tuning risk into month end.
