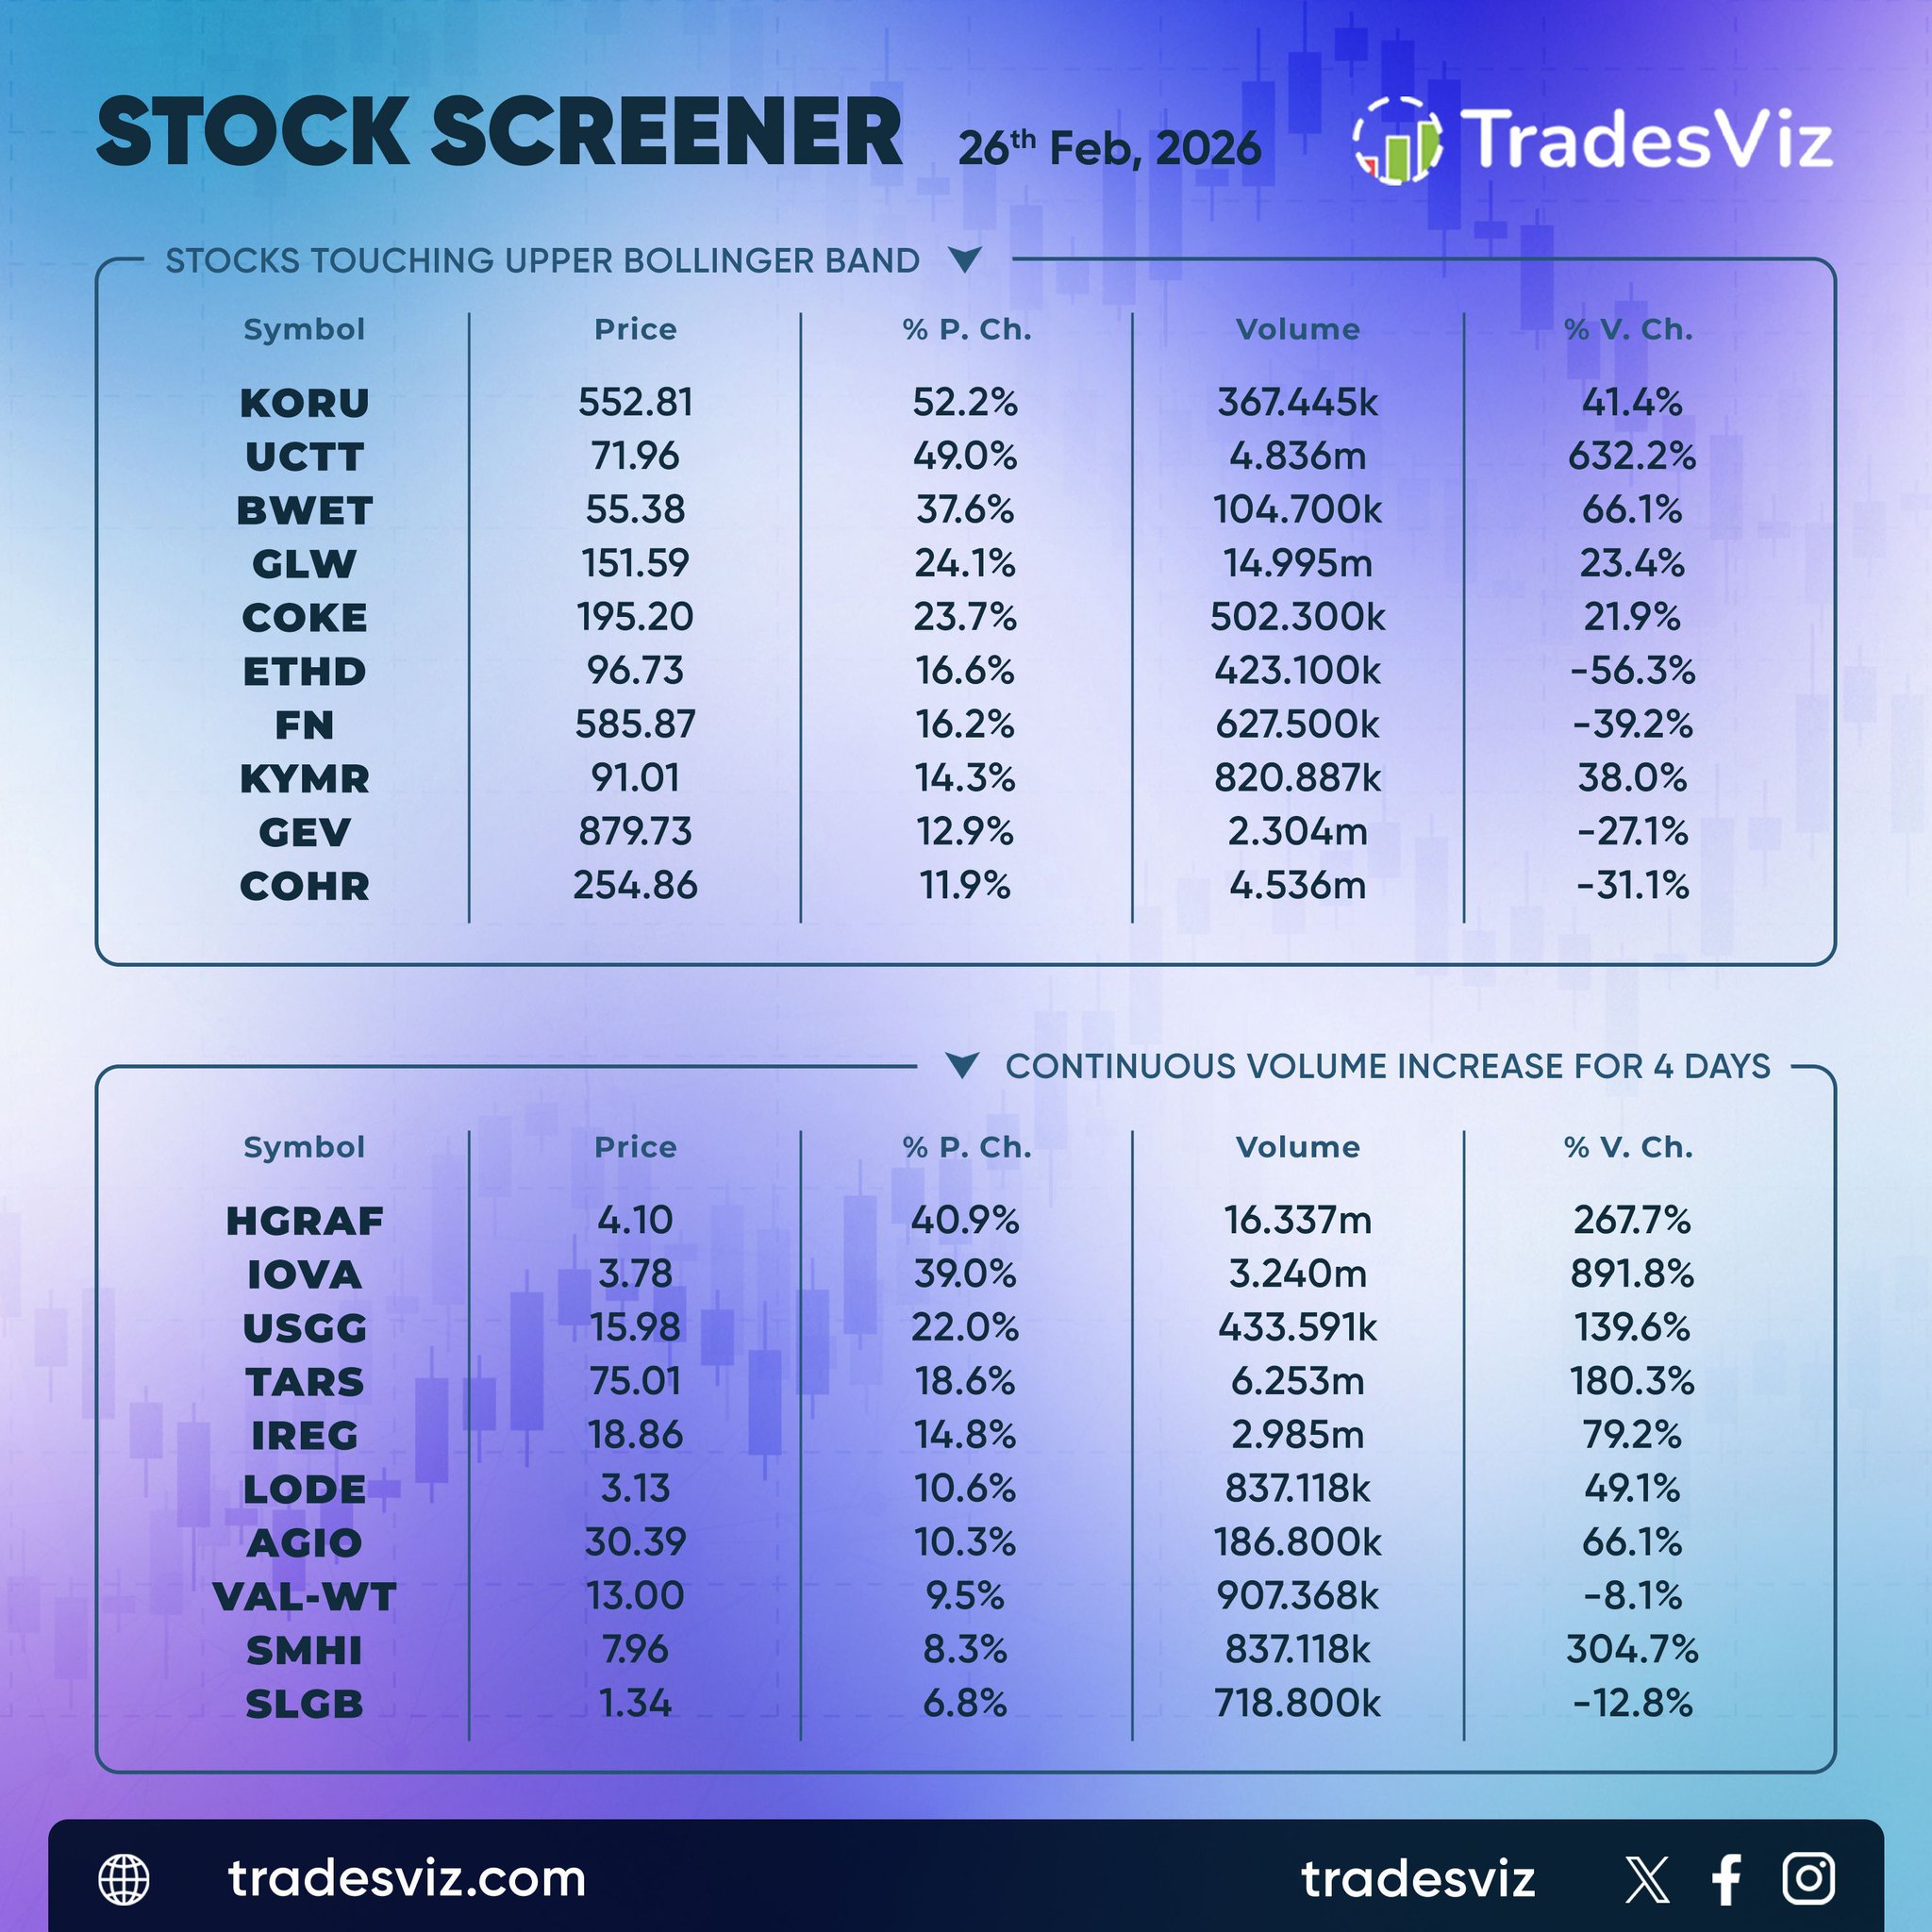
Momentum stayed firmly on the tape for February 26 as multiple names pressed into upper Bollinger levels and sustained multi‑day volume surges.
$KORU led the breakout list with a 52 percent move as volume spiked more than 40 percent, followed by $UCTT up 49 percent on a 632 percent volume jump. $BWET and $GLW each showed clean continuation, their price and volume confirming active accumulation.
The second group highlighted durable interest, with $HGRAF and $IOVA showing four straight sessions of expanding turnover, up 267 and 891 percent respectively. $USCG and $TARS added consistent strength with elevated liquidity.
When price tracks higher in step with multi‑session volume expansion, it often signals conviction rather than speculation. The market remains selective but clearly risk‑on across trend‑confirmed names.
The tape on February 26 showed concentrated sweep‑side selling over the past three sessions, with tech and crypto names drawing the bulk of the action.
$NVDA led with sweep trades up 101 percent, signaling aggressive premium turnover following its recent volatility spikes. $AMD and $TSM followed closely, each showing strong sequential increases as option volume clustered around near‑term strikes, hinting at active profit‑taking.
On the speculative side, $COIN and $CRCL posted triple‑digit jumps of 256 and 271 percent, evidence of fast money rotating out of high‑beta exposure after an extended run. $IBIT’s chart confirmed steady selling pressure, yet price resilience suggests controlled repositioning rather than panic.
Overall, the flow points to disciplined de‑risking within large‑cap semis and crypto‑linked names while maintaining structure, a sign of institutions fine‑tuning risk into month end.
The options tape on February 26 lit up with multi‑million sweeps across metals, semiconductors, and tech leaders, marking a session defined by concentrated premium rotation and disciplined accumulation.
$GLD led early with a $39M call‑buy sweep at $495 followed by offsetting $19M and $18M call‑sells near $510 and $475, showing large two‑way interest in gold exposure ahead of month‑end. $GLW printed twin $71M sweeps, one buy and one sell, signaling heavy institutional repositioning within industrial tech.
$MSFT and $NVDA saw balanced but assertive action, including a $12M put‑buy and $10M split call flow, confirming tactical hedging amid sustained demand. Smaller names such as $NFLX, $MU, and $CVNA added $6–9M trades, expanding participation across growth and discretionary sectors.
The flow shows conviction on both sides, yet remains controlled. Premium remains concentrated in core large caps, implying steady institutional calibration rather than speculative reach.
Earnings on February 26 bring cross‑sector weight with a strong focus on Canadian banks and post‑close tech.
$RY headlines the pre‑market with a $239B market cap and $2.81 EPS estimate, joined by $TD at $162B and $CM at $90B, setting the tone for the financials. $SRE, $VST, and $ARGX fill the pre‑market docket, broadening exposure to utilities and biotech.
After hours, $INTU, $DELL, and $MNST light up the tech and consumer tape with $INTU posting a $99B valuation and $2.23 EPS projection, while $DELL’s $3.32 estimate anchors hardware sentiment.
Economic catalysts include Unemployment Claims at 07:30, FOMC Member Bowman at 09:00, and Natural Gas Storage at 09:30. The setup points to a data‑driven session blending heavy financial guidance with key policy signals.
Standard performance reviews often limit your perspective to pre-defined metrics.
If you want to uncover the true drivers behind your positioning, you need the ability to build your own visualizations 📊
The Pivot Table Charting tool allows you to instantly generate custom data models directly from your trade log
By manually assigning variables to the X and Y axes, you can cross-reference any two metrics to see exactly where volume is piling in or where your edge is fundamentally degrading.
You are never restricted to basic layouts.
Stop relying on default views to understand your market activity. Customize your analytical infrastructure and approach the tape with absolute conviction ⚙️📈
Stop forcing a strategy that doesn't match your execution.
Are you born a swing trader, but constantly trying to scalp? 🤔 or.. the opposite?...
The Multi-Timeframe Exit chart on TradesViz ends the debate 👇
It shows your exact PnL if you had held your trades to EOD, tomorrow, or 3 days from now.
Stop leaving money on the table because you are playing the wrong game. Find your true timeframe at TradesViz ⏳
A $500 win is a win, right? Not necessarily.
The final PnL tells you what happened, but the drawdown tells you how it happened.
✔️ Trade A: Clean, controlled, and repeatable.
❌️ Trade B: A stressful recovery fueled by relief, not strategy.
One trade is a display of discipline; the other is a lucky escape from a blown account.
Profit isn't always a stamp of approval.
Your PnL shows the outcome, but it doesn't show how long you stayed in the red.
If you only look at the final green number, you're missing the data that actually improves your trading.
Stop judging trades by the ending when you can see the entire journey. 👀✨
You closed the trade in the green. You’re feeling good. 🙂
But have you looked under the hood? 🤔
If your profit "hid" a drawdown that would have liquidated you on a slightly worse day, you aren't winning-you're borrowing time.
Stop ignoring the "how." Start mastering the "why." 🔎