
Export and Import files management
Learn how to manage your trading file imports and what are the different ways to export and download your own trades.
Guides, changelogs, deep dives and everything trade journaling.
Learn how to manage your trading file imports and what are the different ways to export and download your own trades.
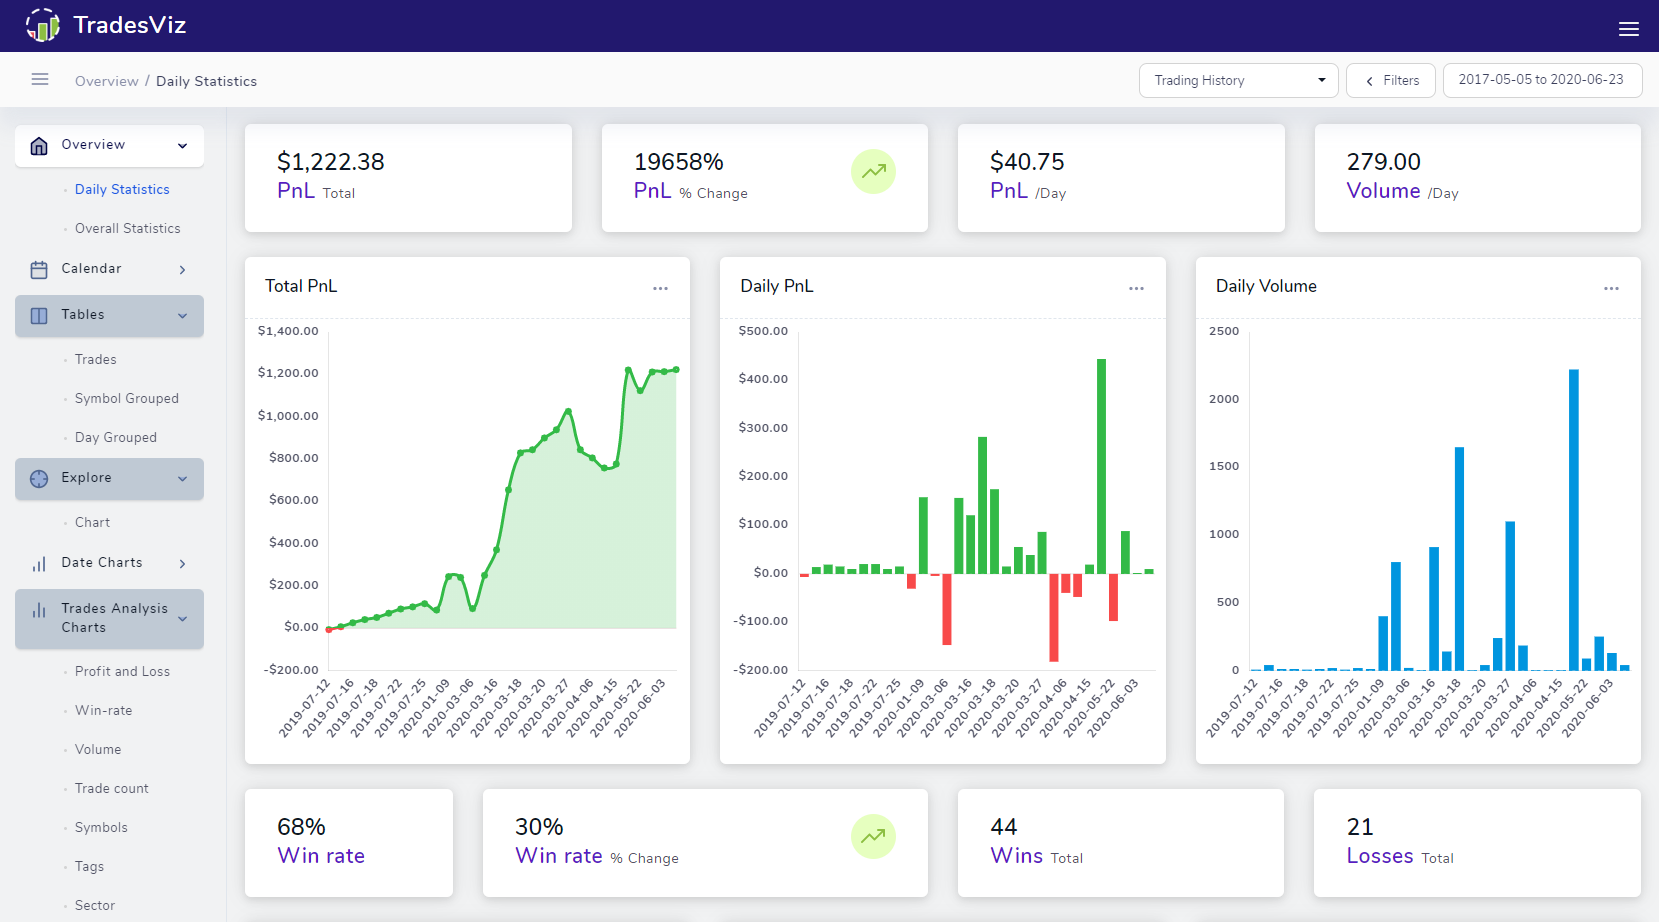
Simple and intuitive UI - but very flexible and limitless customizability. Learn how to navigate and effectively use the TradesViz dashboard.