All about interactive charts
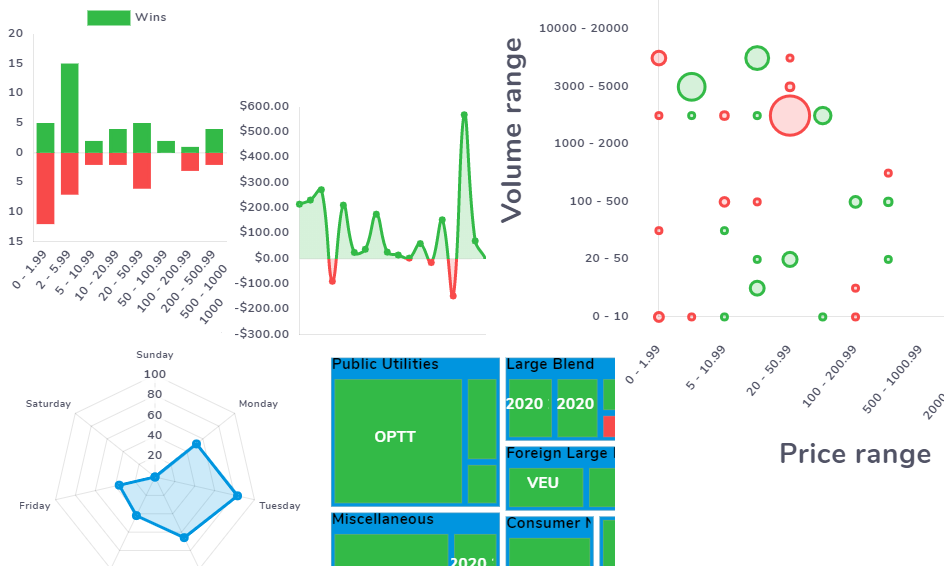
Charts dominate most of the tabs in TradesViz and they are the central element of interactivity. Learn how to navigate through the 70+ charts and also how to use features like click to explore and filter.
Guides, changelogs, deep dives and everything trade journaling.
Charts dominate most of the tabs in TradesViz and they are the central element of interactivity. Learn how to navigate through the 70+ charts and also how to use features like click to explore and filter.
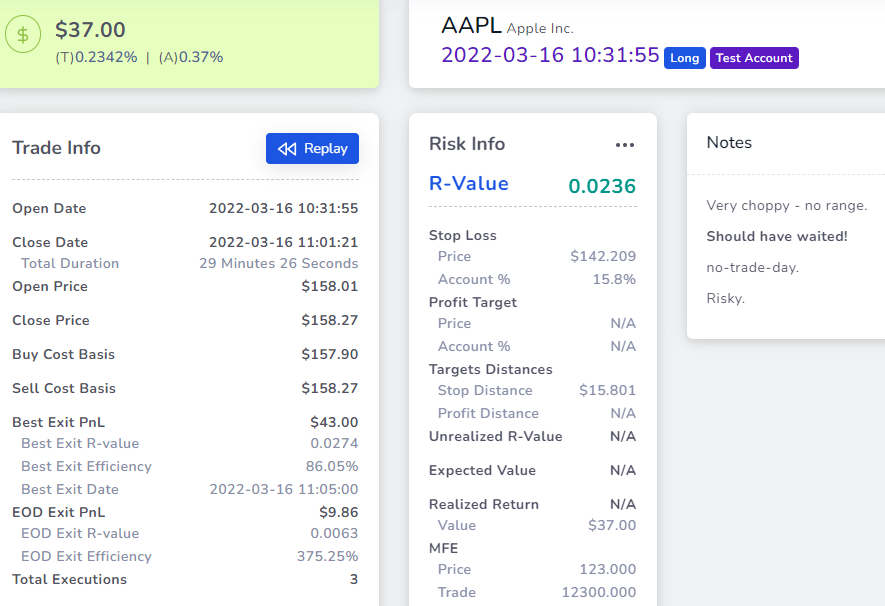
One of the 3 main tabs of TradesViz. View everything - charts, executions, risk info, trade statistics about a trade in this tab. Learn how to customize and add tags, images, charts in this blog post.
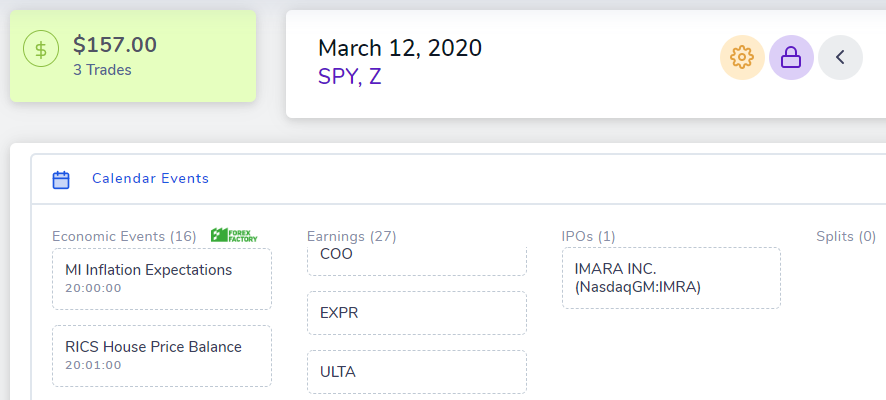
Get an overview of your full trading day with info about all market events such as earnings, IPOs, and also a list of global economic events happening on that day. Learn more about how you can even add charts, share your trading day, etc., in this post.
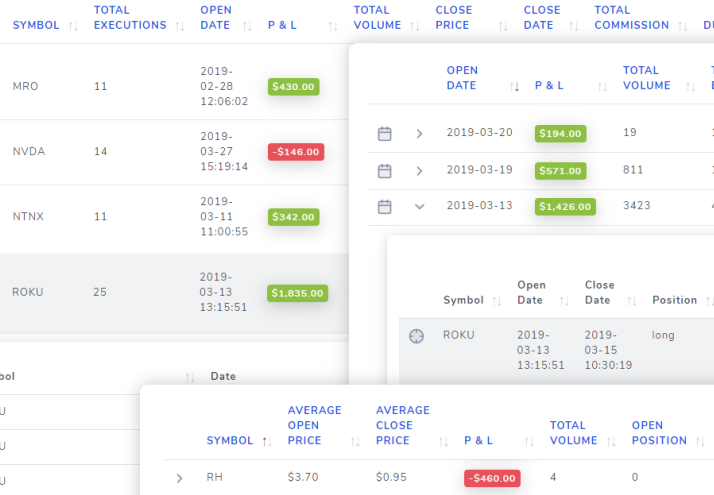
Sort, search, delete, bulk apply notes, tags, and do much more with the 3 different trading table views in TradesViz. Learn how to manage and logically search from 1000s of trades.
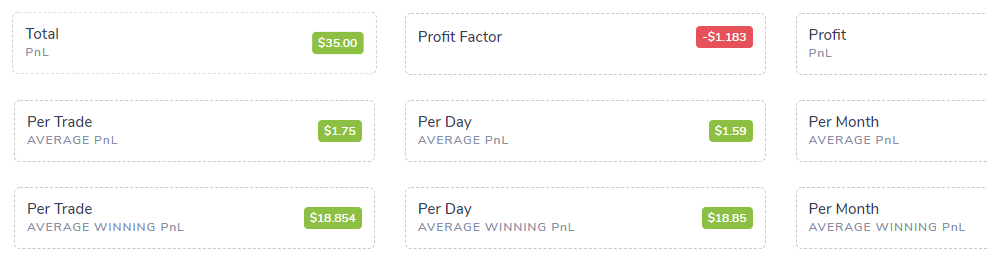
Summary of your entire trading history, the most looked-at statistics, and more.
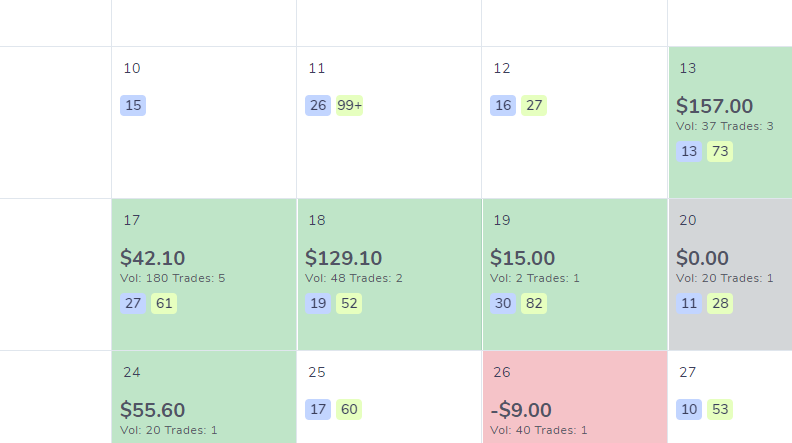
Learn about the calendar views on TradesViz - IPOs, earnings, economic events, PnL - The complete trader's calendar!
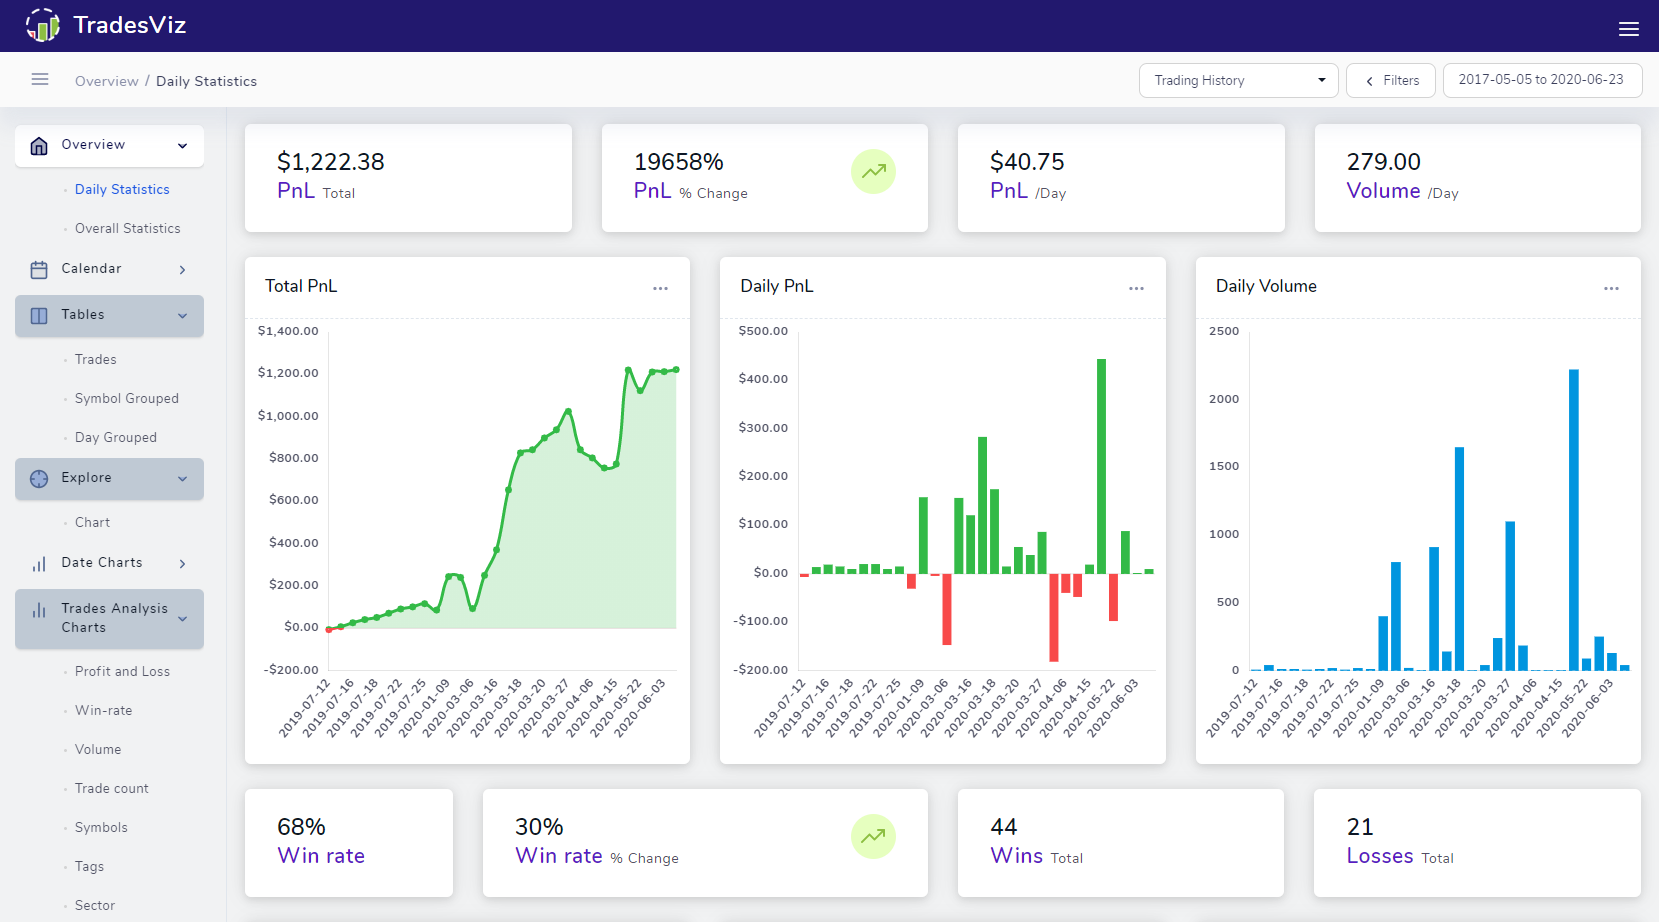
Simple and intuitive UI - but very flexible and limitless customizability. Learn how to navigate and effectively use the TradesViz dashboard.