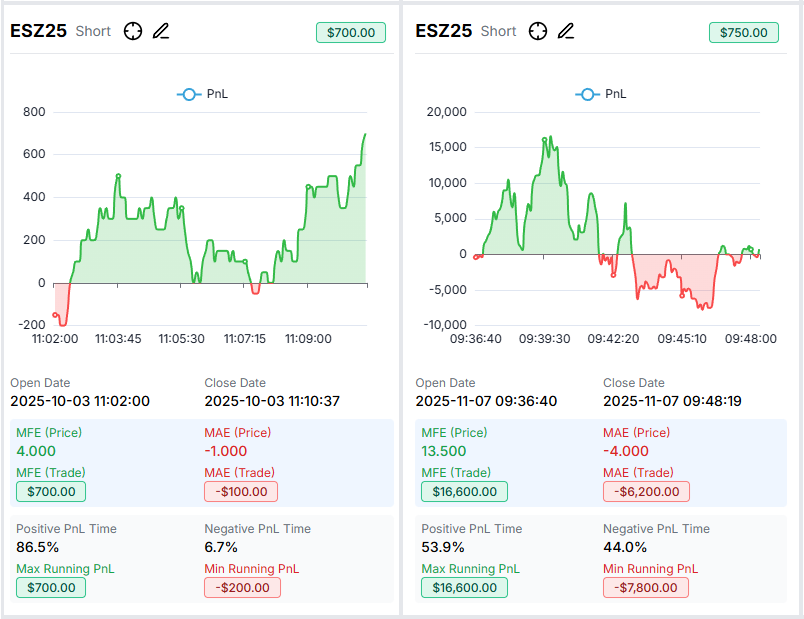
Drawdown View: Analyze Running PnL Across Multiple Trades
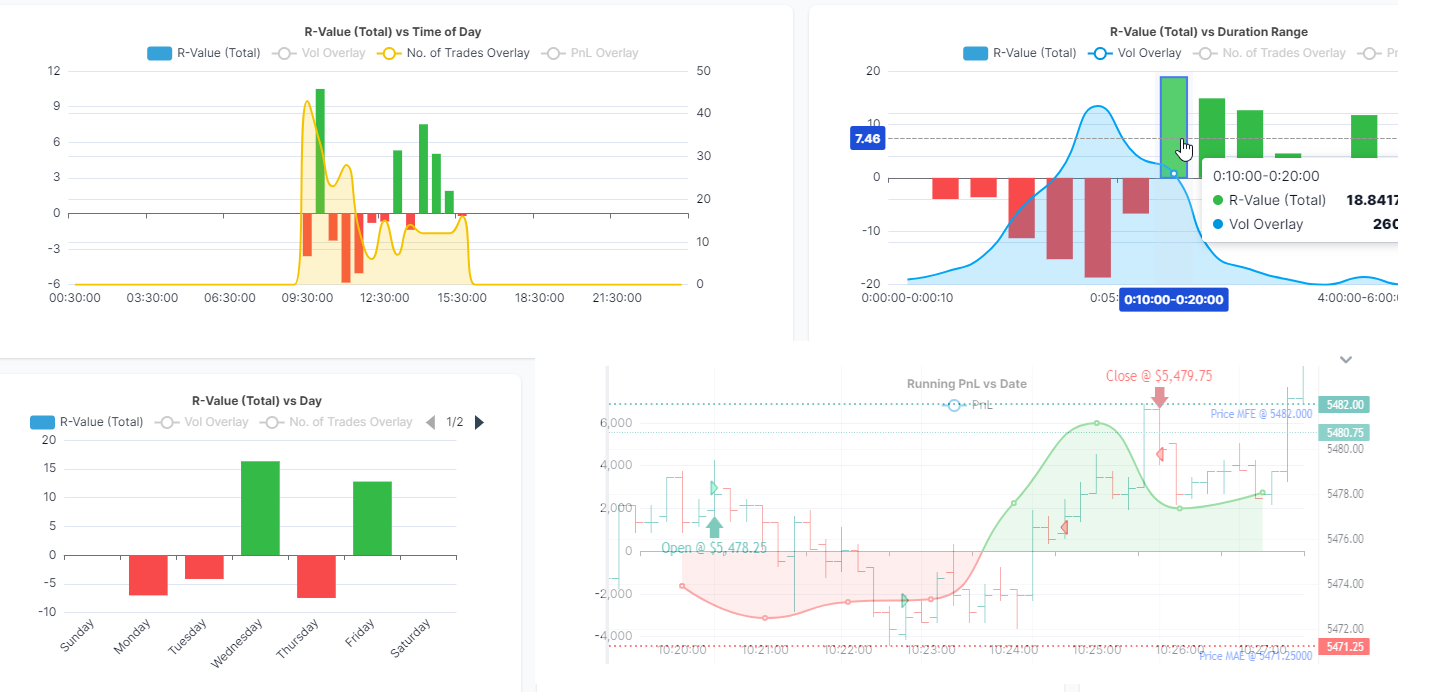
Introducing the Drawdown View - a new way to visualize running PnL charts for multiple trades at once. Quickly scan through your trades to spot drawdown patterns, compare MFE/MAE stats, and see how long you spent in profit vs loss across your positions. Perfect for identifying risk management patterns and exit timing issues without clicking into each trade individually.
![[Updated] Chart View in TradesViz v2.0: Fastest way to review trades visually](/media/blog/chart_trades_view_new/chart_trades_view.png)