Risk management is #1 in trading.
A simplified example of thinking about risk:
Are you in a red trade and unsure what to do?
The objective truth: You were wrong.
However, you *hope* things turn around.
Probabilities vs Possibilities...
It's right there, but we don't see it..
There are many factors in your trading that could be preventing you from earning more from your trades.
With TradesViz, you can now visualize & plot how much more you could have earned in a trade visualized against almost every stat.
Find your edge 👉 https://t.co/gnY7J21ec6
How do you figure out how your performance correlates to the market conditions? 🤔
It's not just "bull market -> everything goes up" and vice-versa for YOU.
The assets your trade, the sectors you trade, and the markets you trade in - are all different.
https://t.co/gnY7J21ec6
🚨 New platform support
You can now import your trades directly from Quantover to analyze your trading performance on https://t.co/2blWUckDu9!
Want us to add your broker? Send us an email to [email protected]!
#tradingjournal #futures #trading
Learning how to use filters can potentially 10x the speed of your trade journaling analysis.
There is nothing that can beat TradesViz when it comes to comparison & analysis.
Watch this short video on how to effectively utilize filters in TradesViz 👇
We talked a lot about how you can dig into your data to get more insights.
However, that's not the end of it.
A holistic analysis involves more than numbers.
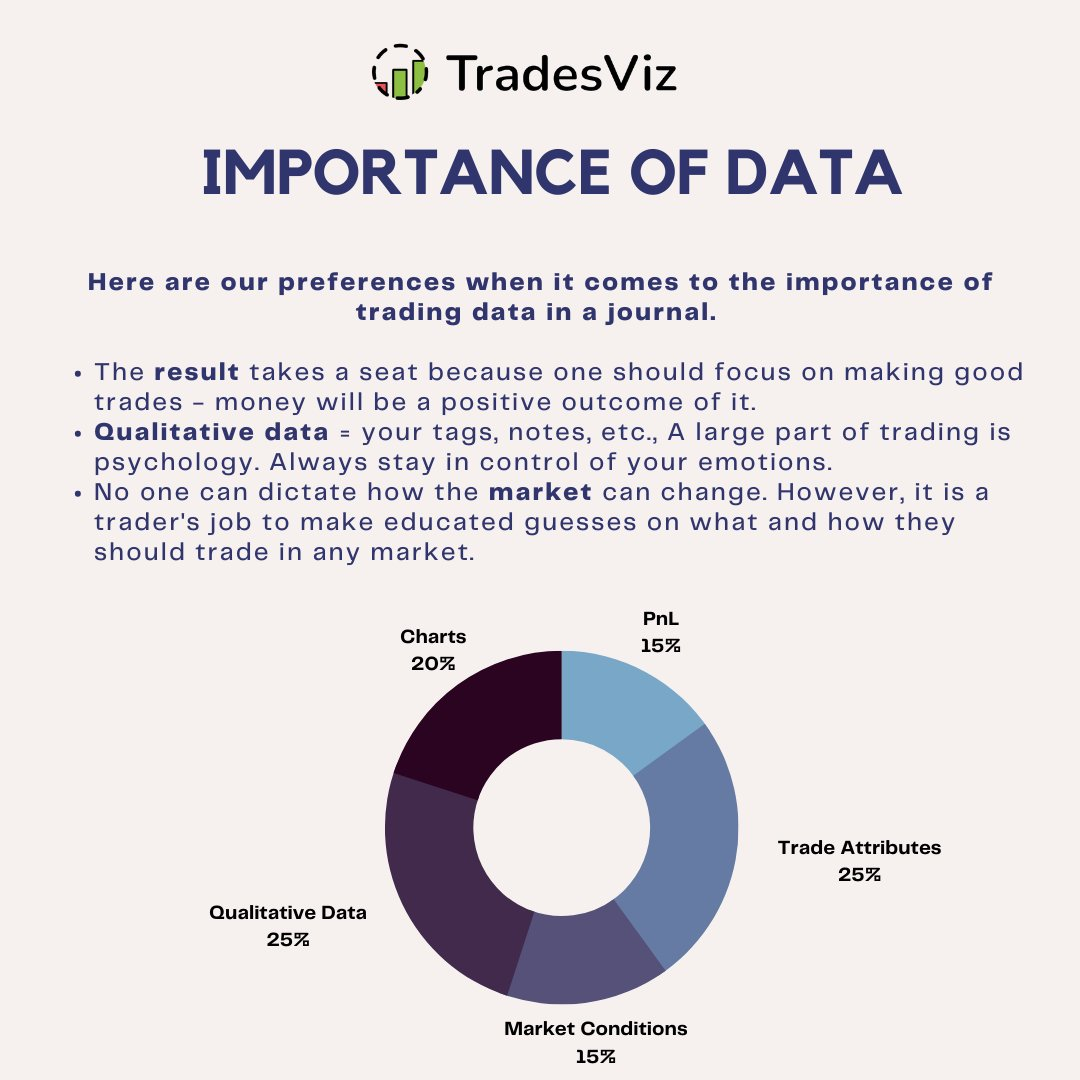
Comments, Notes, Charts, PnL, Trade Attributes, Market conditions-All of these are part of your journal in TradesViz.
How skewed is your PnL distribution?
Check this out with TradesViz and learn about why the distribution of your PnL is important 👉 https://t.co/UaDbiu4aWu
It's not always red/green numbers and simple price analysis that help you.
Dig into the numbers. You will find gold.
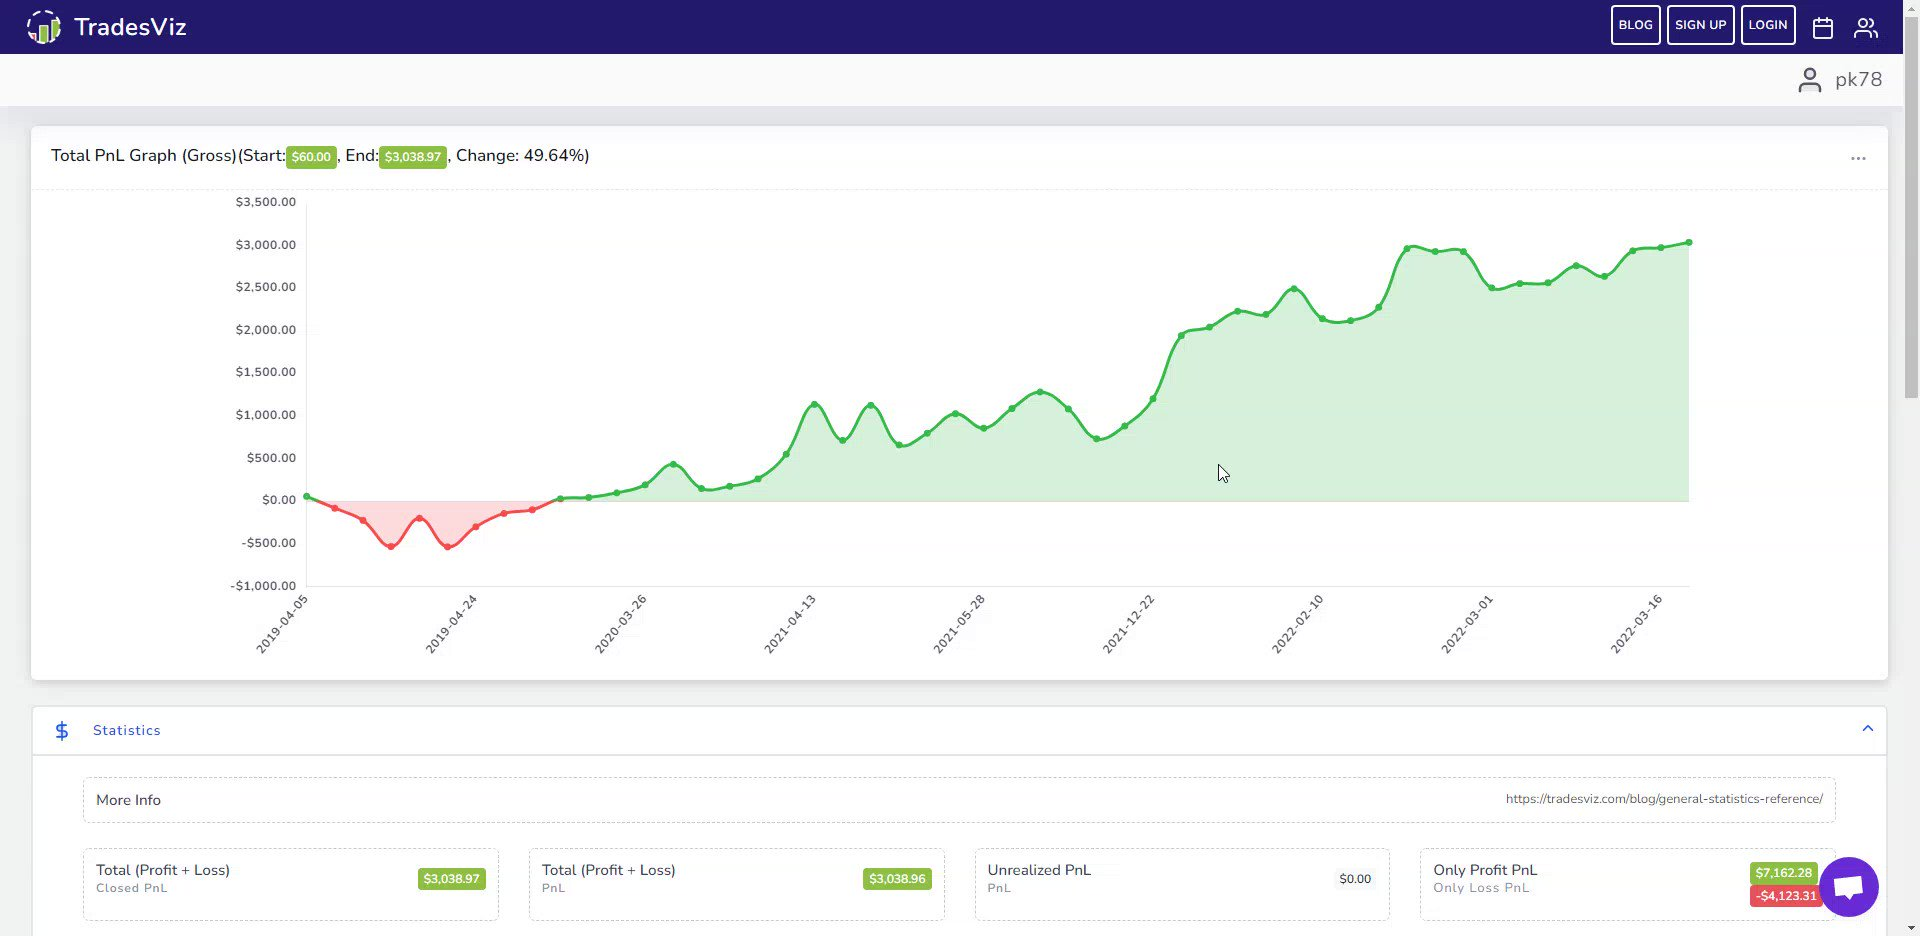
Do you want to explore what TradesViz looks like without signing up?
Take a look here 👉 https://t.co/aRy4BdtMT1
* View table, PnL curve, statistics
* Explore all trades
You too can share your dashboard!
But this is just 10% of the TradesViz dashboard 😃
Sign up to explore!
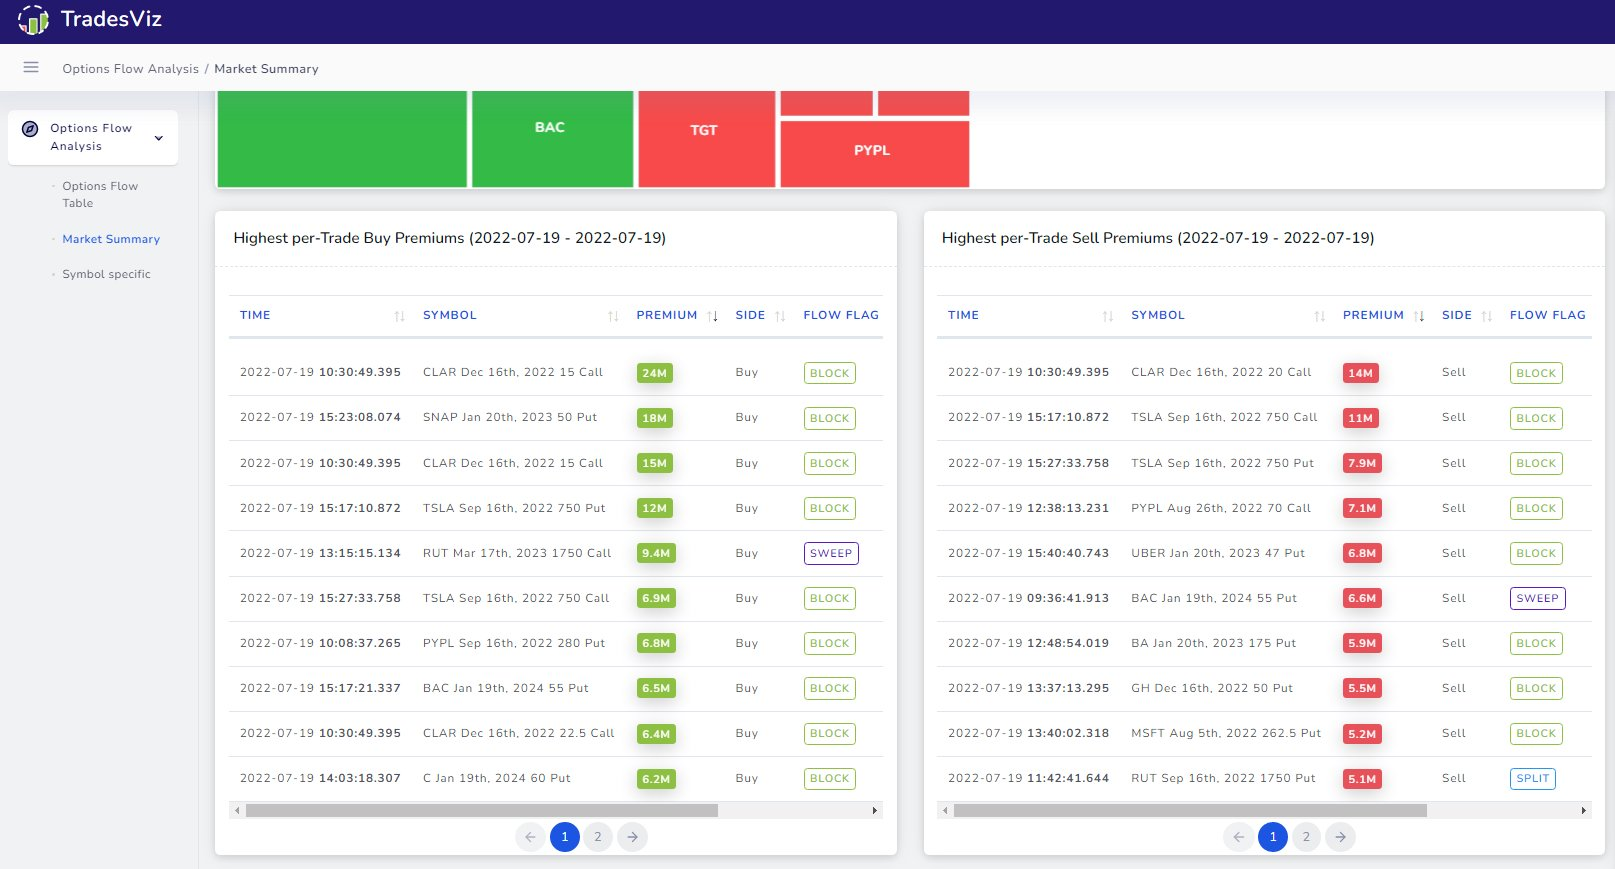
Some interesting options flow scan results:
Multi timeframe divergences:
Moderate divergence, 5m tf, last 1 day:
$GE
$BITO
$BBY
High divergence, 15m tf, last 2 days:
$MRVL
Moderate divergence, 30m tf, last 5 days:
$PYPL
$IWM
$AMZN
Streaming flow is not enough. Analyze it.