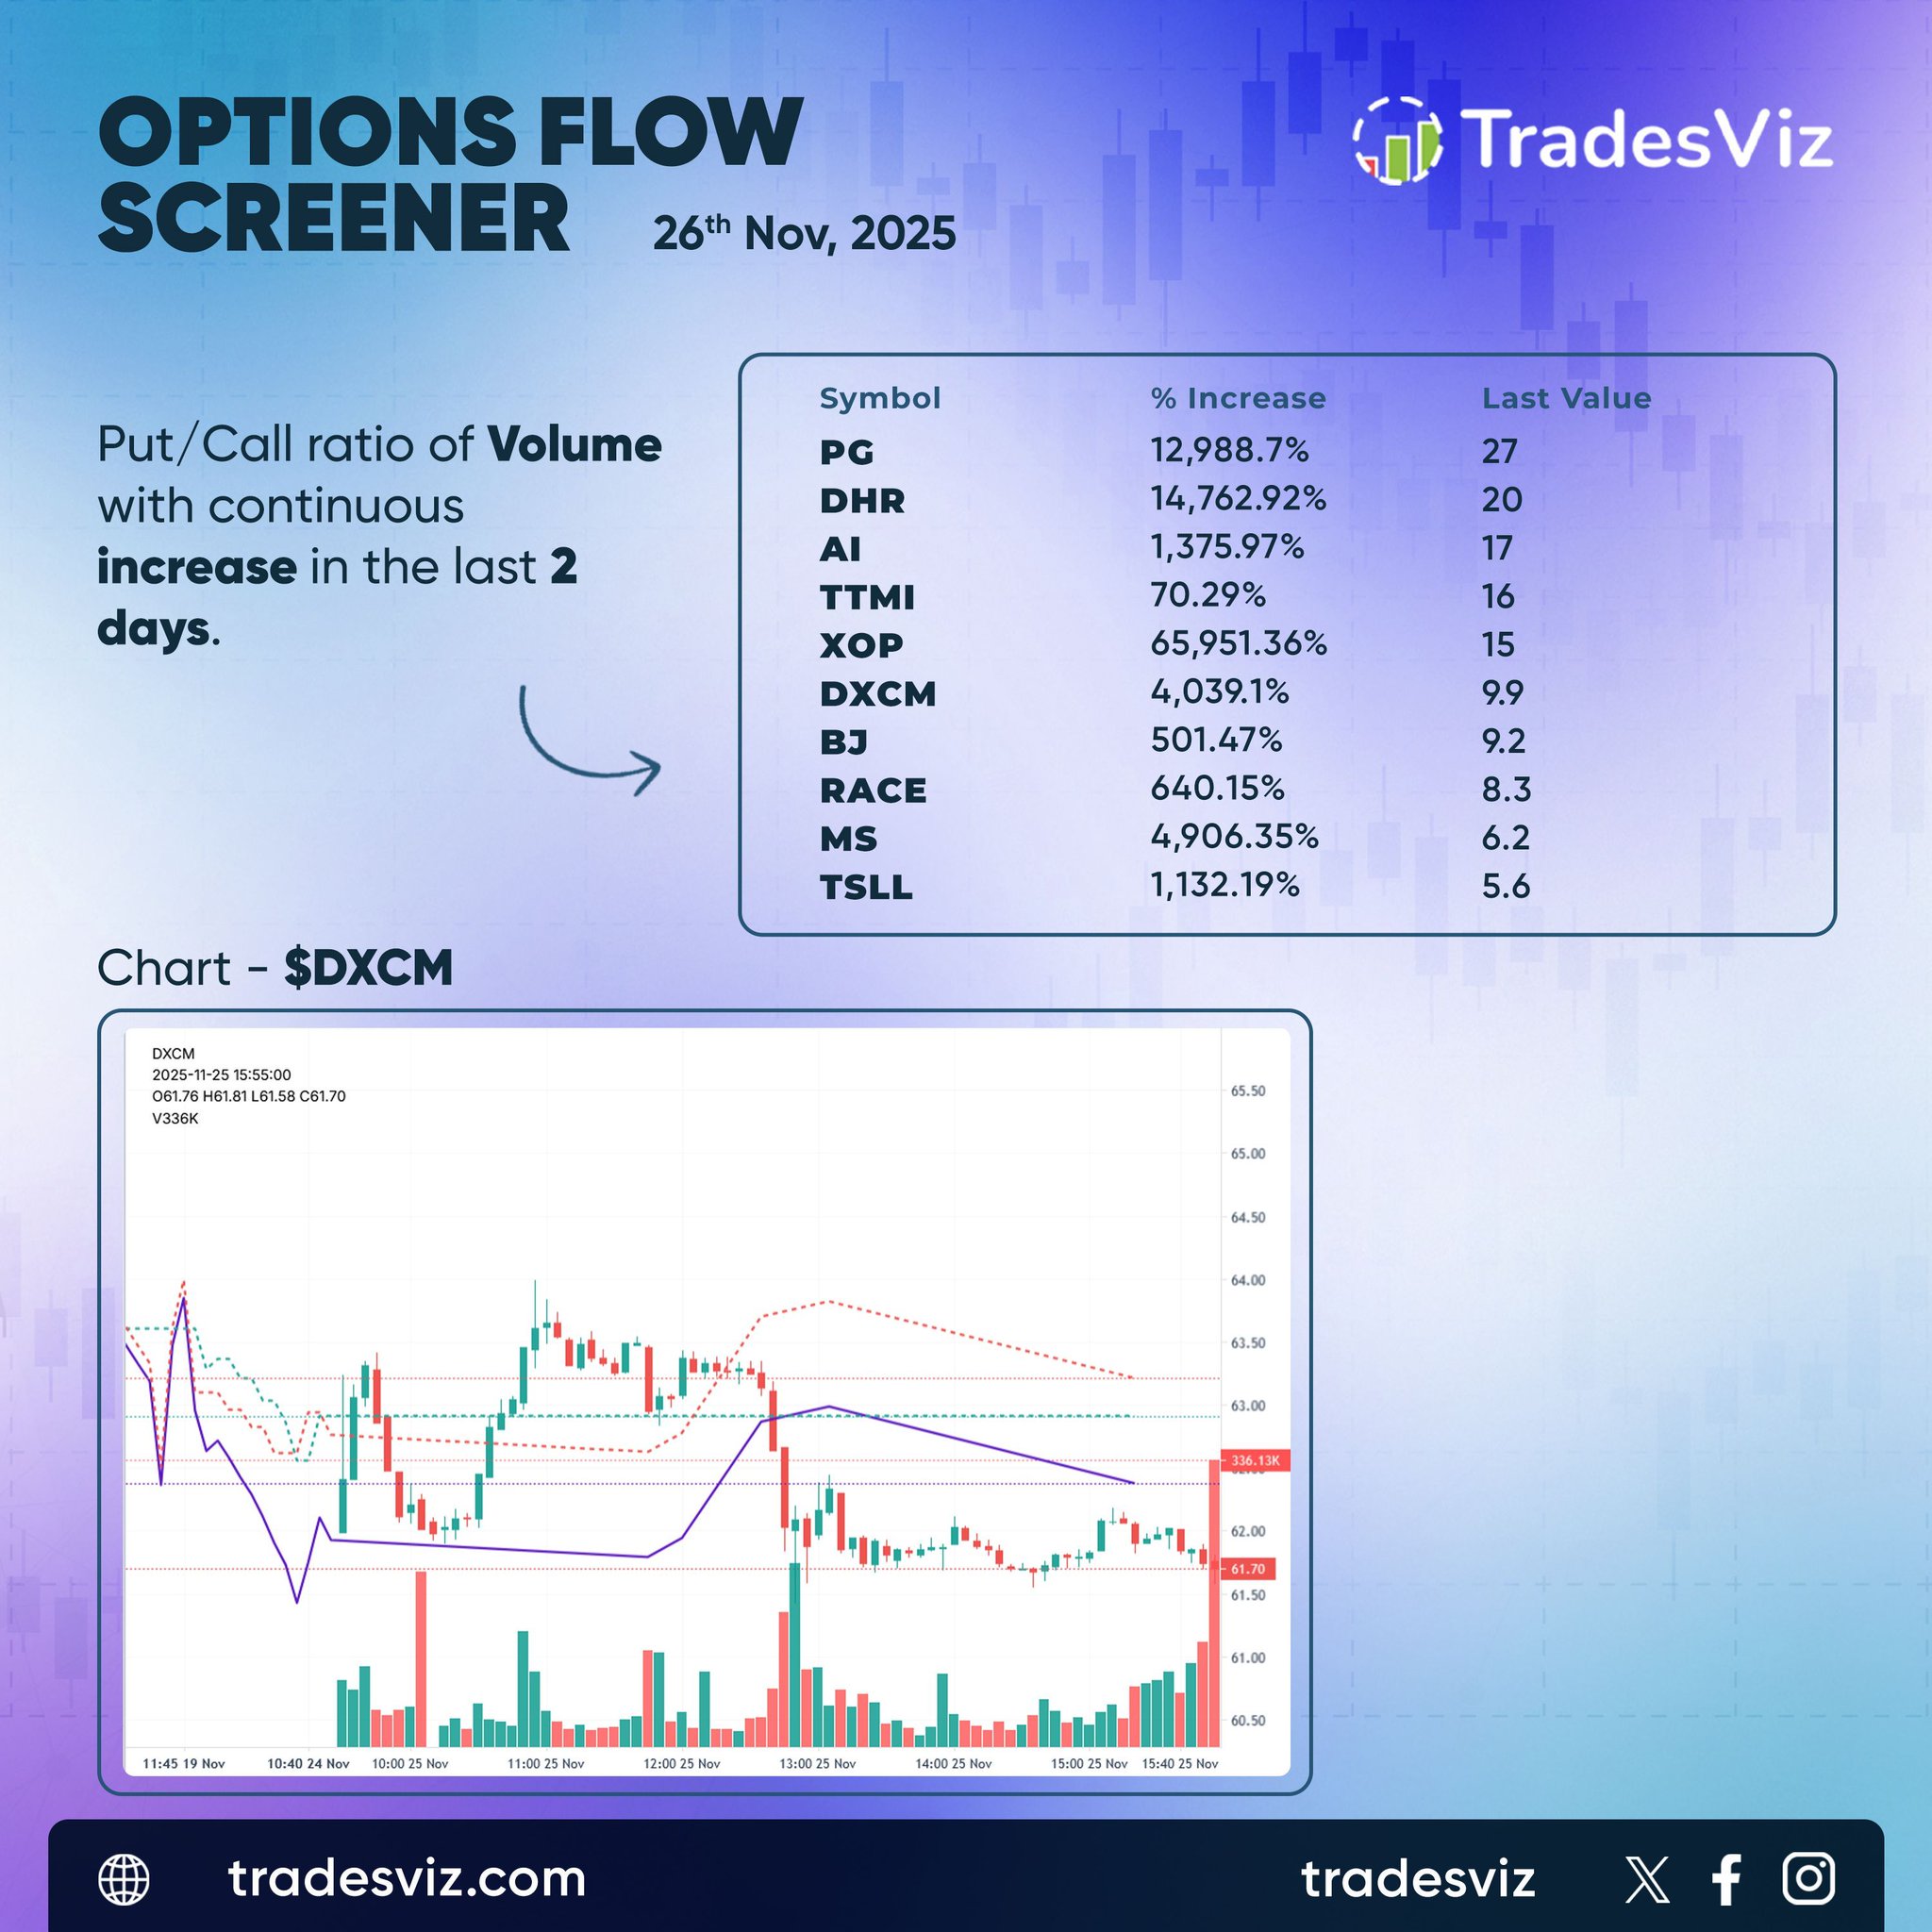
The options flow screener for November 26, 2025, highlights a strong buildup in the put/call ratio of volume for several large-cap names, showing defensive positioning and hedging interest continuing for the second straight day.
$DHR led with a 14,762.92% increase, reaching a last value of 20, followed closely by $PG, which climbed 12,988.7% to 27, indicating substantial upticks in put-side activity in the consumer and healthcare sectors. $DXCM posted a 4,039.1% increase to 9.9, reflecting rising downside hedges in the biotech space. Financial giant $MS saw a 4,906.35% rise to 6.2, while $TSLL jumped 1,132.19% to 5.6, suggesting caution around leveraged tech exposure.
Energy name $XOP recorded a striking 65,951.36% increase to 15, showing major inflows of protective trades amid sector volatility. $BJ rose 501.47% to 9.2, $RACE gained 640.15% to 8.3, and $AI and $TTMI also saw notable increases of 1,375.97% and 70.29%, respectively, indicating broader participation across retail, AI, and industrials.
The chart for $DXCM shows steady volume accumulation and modest price movement, hinting at traders layering in protective puts while maintaining open long positions.
Overall, the November 26 data signals an uptick in market-wide defensive hedging, with $PG, $DHR, and $DXCM standing out as key names in this shift.
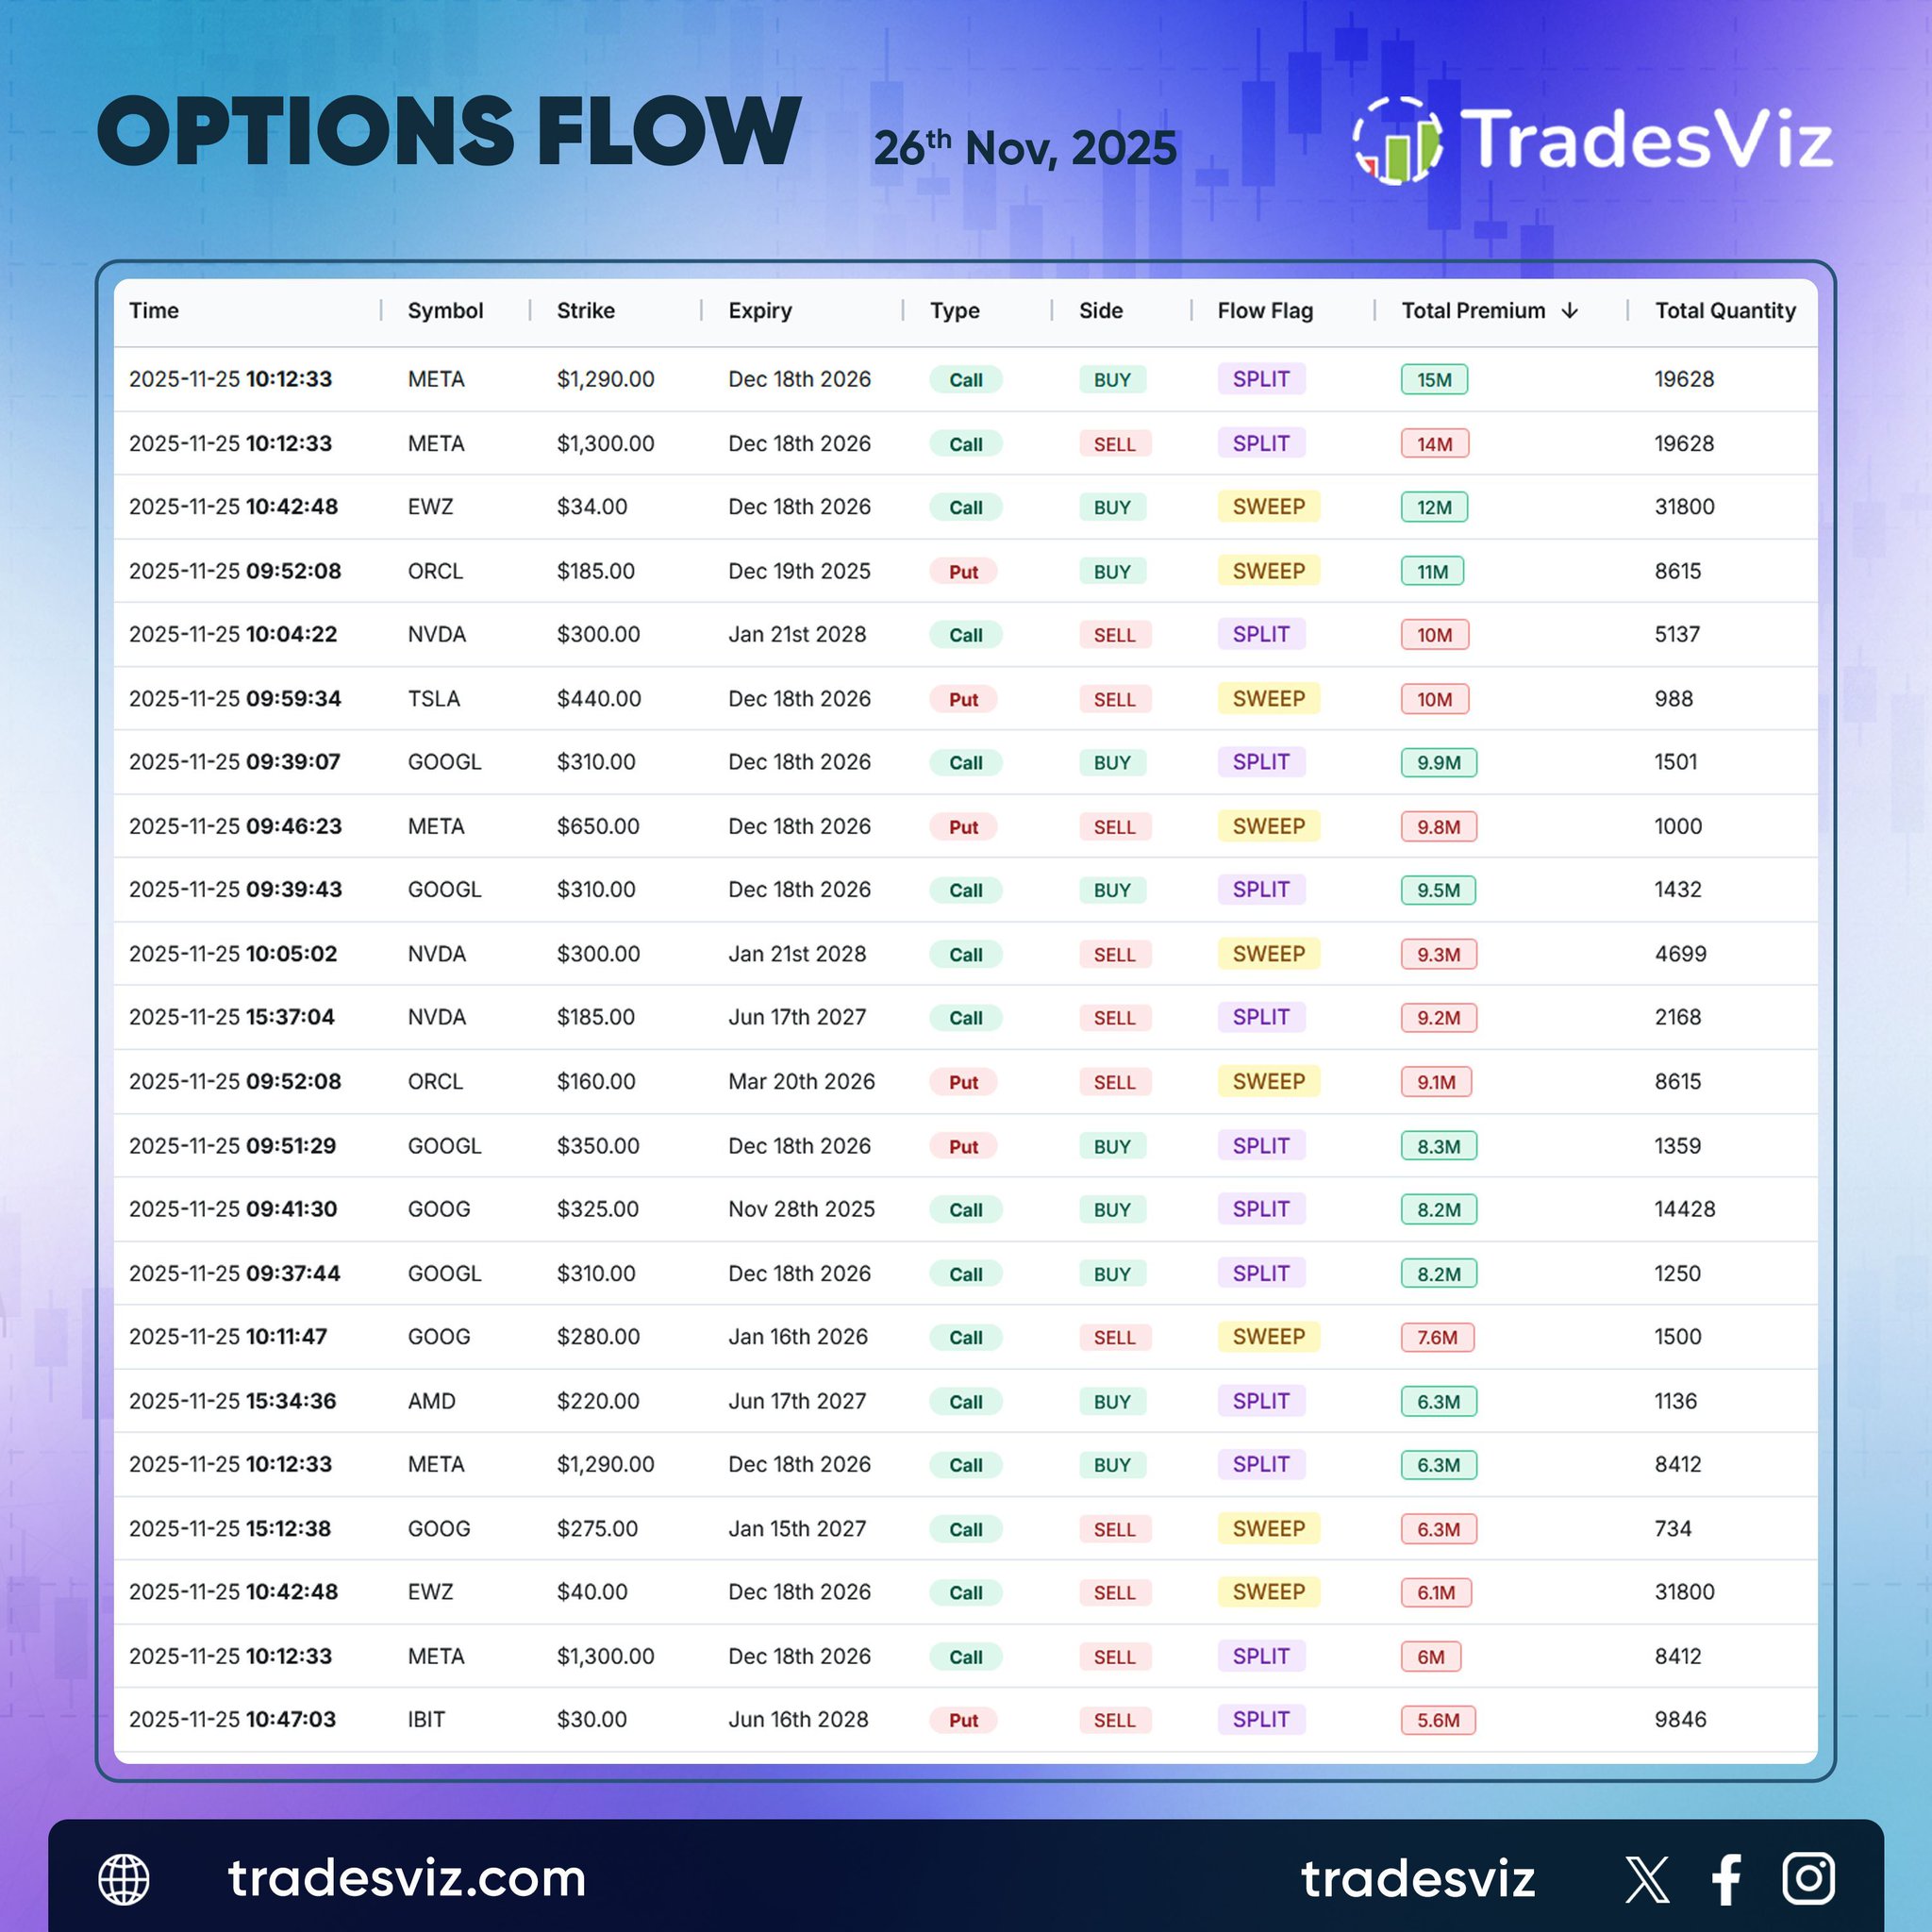
The options flow for November 26, 2025, shows heavy institutional activity across major tech names and select global ETFs, dominated by high-value split and sweep trades in $META, $GOOGL, $NVDA, and $ORCL.
$META led the flow with multiple large trades, including a $15M call buy at the $1,290 strike and a $14M call sell at the $1,300 strike, both expiring December 18, 2026. Additional flows included a $9.8M put sell sweep at $650, reflecting balanced long and hedge positioning within the stock.
$EWZ saw a $12M call buy sweep at the $34 strike expiring December 18, 2026, showing strong emerging market exposure. $NVDA recorded several key trades, including a $10M call sell split for January 2028 and a $9.2M call sell split for June 2027, signaling steady profit-taking in long-dated positions.
$ORCL registered two major put buy sweeps worth $11M and $9.5M at $185 and $160 strikes, while $GOOGL continued to draw attention with multiple $8M–$9M split trades across call and put sides, highlighting active two-way speculation.
$TSLA and $AMD also appeared with mid-range sweeps between $6M and $10M, maintaining high turnover in tech and semiconductor flows.
Overall, the November 26 options flow underscored strong liquidity and mixed sentiment, with traders managing longer-term exposure in $META and $NVDA while rotating into ETF and value sector opportunities.
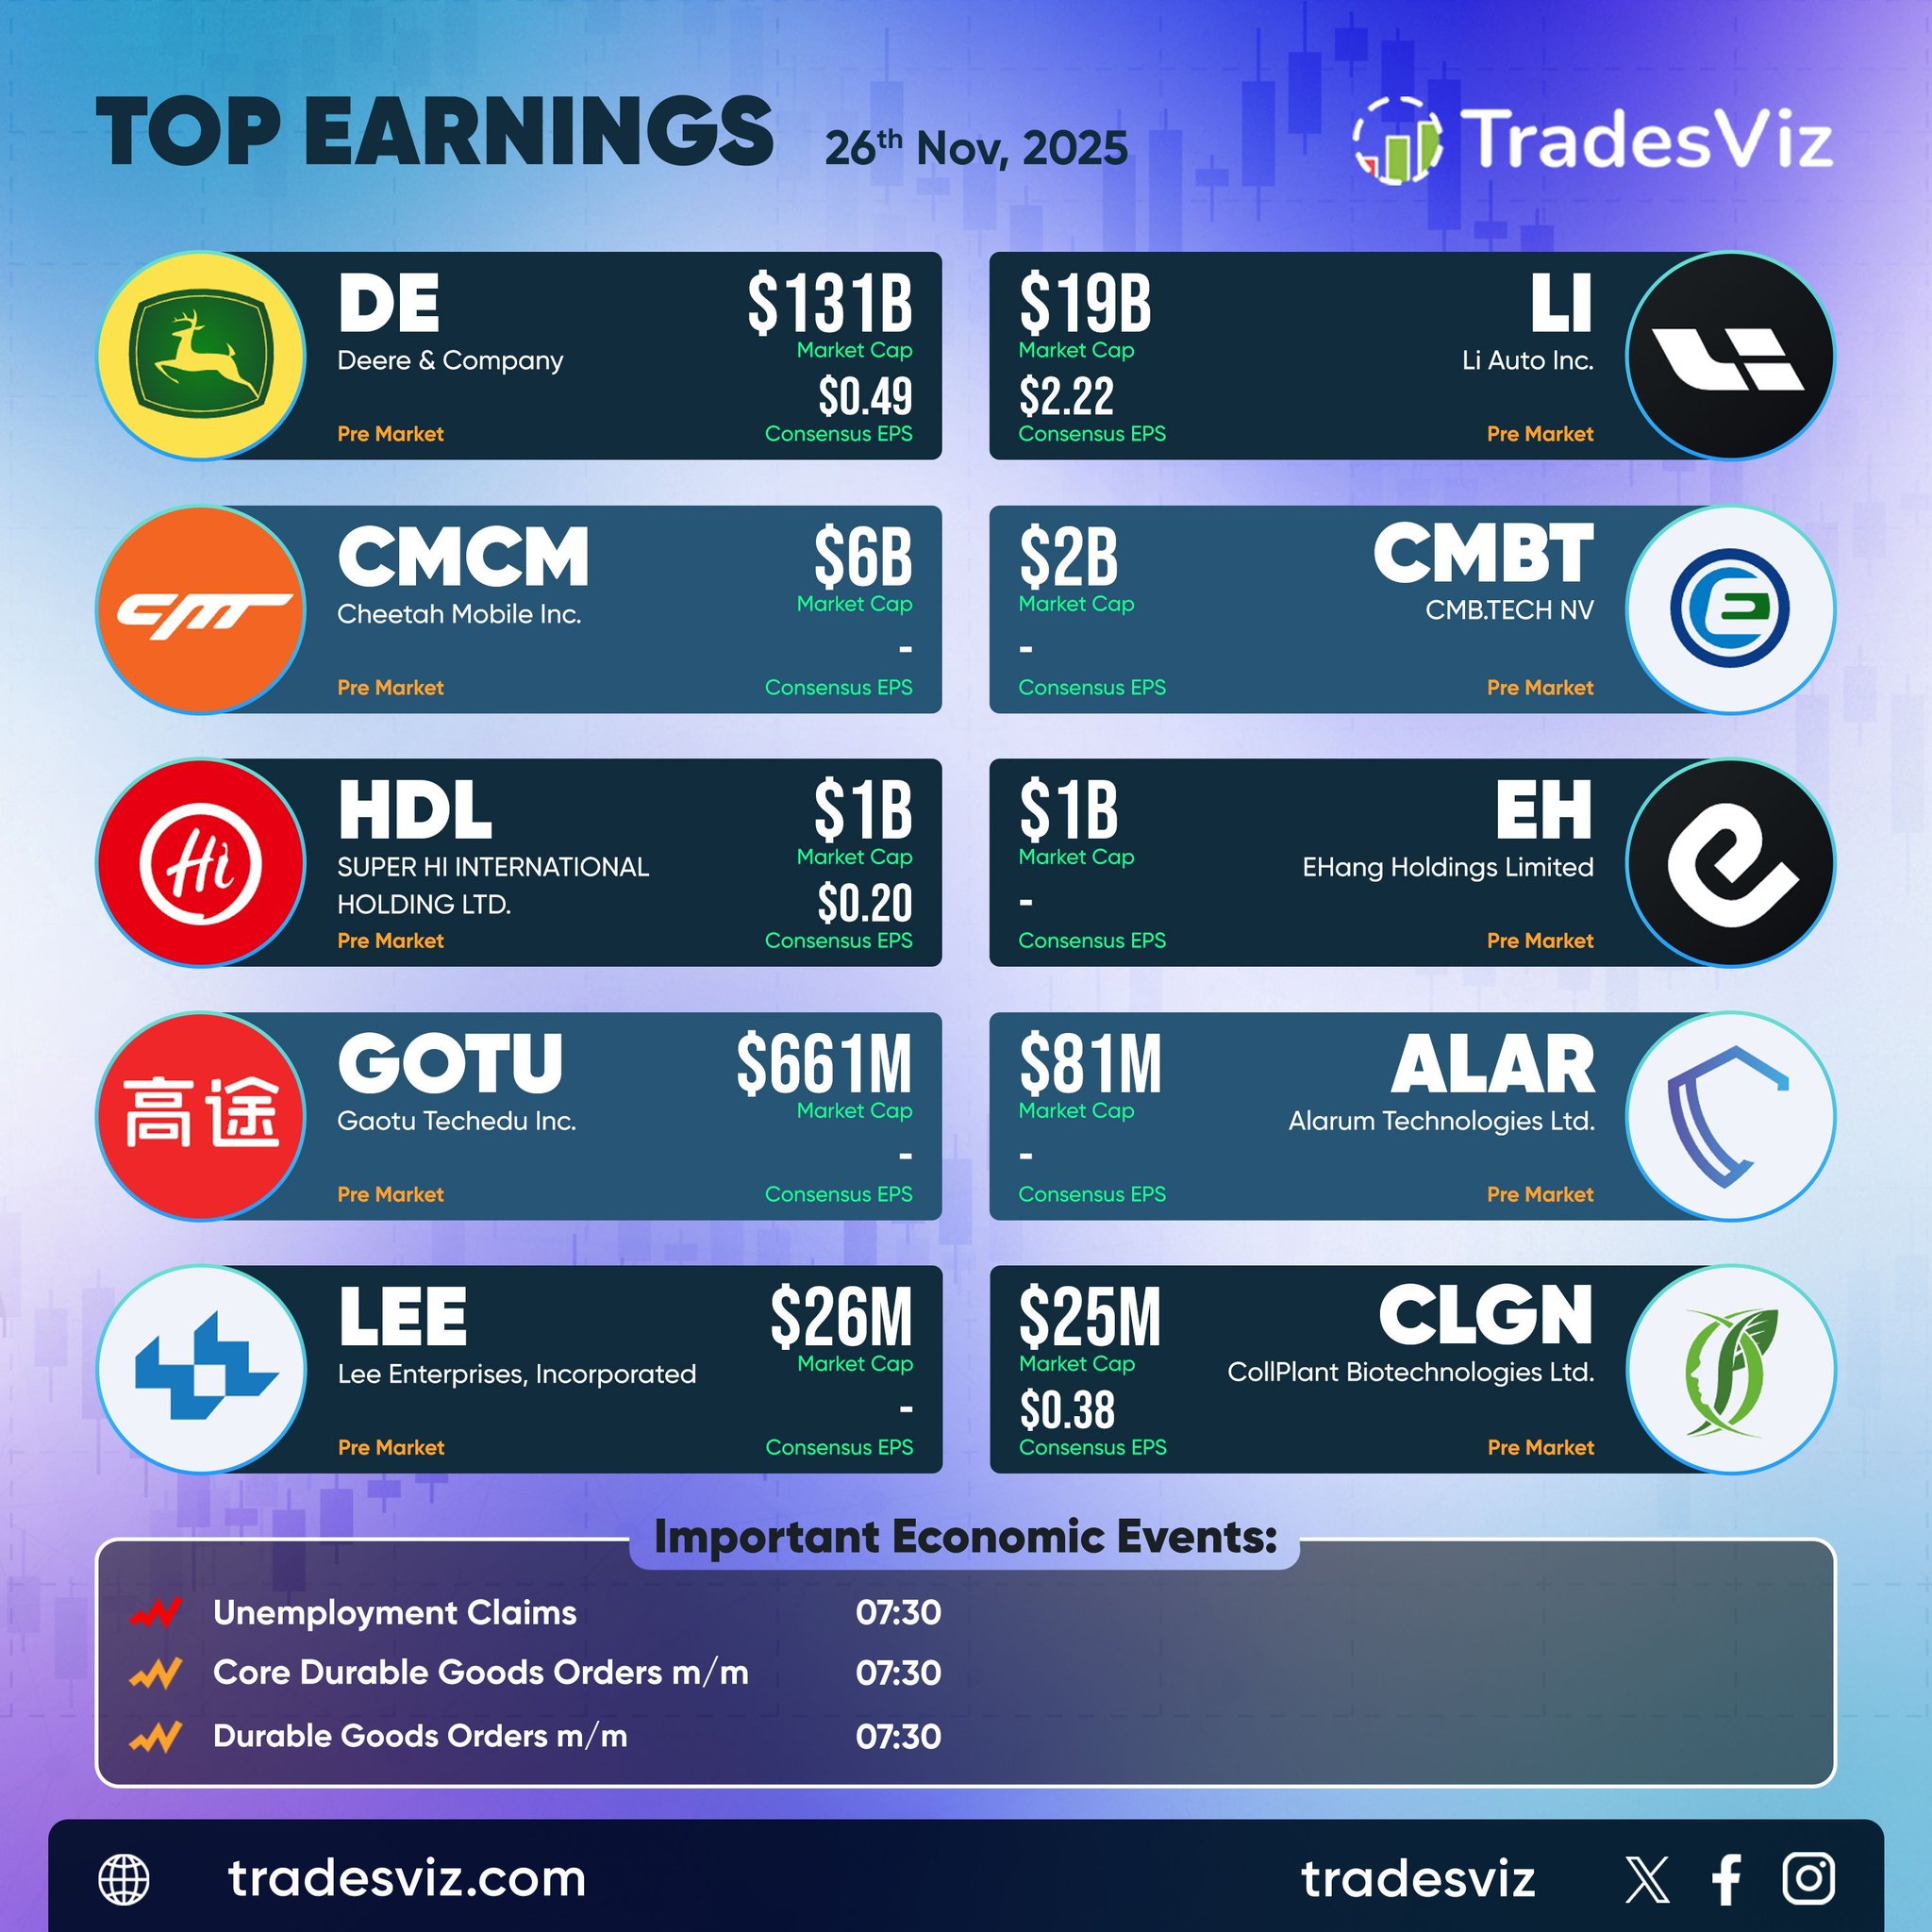
The top earnings schedule for November 26, 2025, features key reports from companies across industrial, EV, tech, and biotech sectors, all set for pre-market release, along with important U.S. economic data.
Leading the day, $DE (Deere & Company) reports with a $131B market cap and $0.49 EPS estimate, offering crucial insight into the agriculture and machinery sector. $LI (Li Auto Inc.) follows with a $19B cap and $2.22 EPS estimate, highlighting trends in the Chinese EV market.
Tech and software updates come from $CMCM (Cheetah Mobile) at $6B market cap and $CMBT ( CMB.Tech NV) at $2B. $HDL (Super Hi International Holding Ltd.) with a $1B cap and $0.20 EPS, and $EH (EHang Holdings Limited) with a $1B cap, provide additional outlook across restaurant and autonomous aviation industries.
Education platform $GOTU (Gaotu Techedu Inc.) at $661M and cybersecurity name $ALAR (Alarum Technologies Ltd.) at $81M also report pre-market, adding variety with growth and tech exposure. $LEE (Lee Enterprises) at $26M and $CLGN (CollPlant Biotechnologies Ltd.) at $25M round out the day with smaller-cap updates in media and biotech.
Key U.S. economic events include Unemployment Claims, Core Durable Goods Orders m/m, and Durable Goods Orders m/m, all at 07:30, providing additional drivers for early market sentiment.
Overall, November 26 features a diversified mix of earnings across major global sectors combined with key macro data, setting the tone ahead of the holiday period.
We're bringing the best this holiday season.
🎟️TVBF25 -> Journal + Charting + Simulator + Analysis + Pivot Grids + AI + More!
No BS. No Fluff. Expert Support for ALL users.
✅Always improving.
This is the TradesViz trading journal.
Keep your dashboard the way you want it. ⚙️📊
Whether you prefer a clean, minimal layout or a detailed analytics hub, the Custom Dashboard in TradesViz adapts to your style.
Add, remove, resize, or rearrange widgets - from PnL trees to trade tables — and build a workspace that fits your trading process perfectly.
Focus on what matters most, your way.
Customize freely with the TradesViz Custom Dashboard. 👇
The SECONDARY goal of a journal is to show pnl.
The Primary is to let you record and analyze.
Look at any sport. The training will consist of SO MANY elements that are NOT related to the actual event itself.
MFE, MAE, R-value, time to best exit, drawdowns, distribution of trades over and under certain $/% amount etc.,
These are just some metrics that help more compared to just looking at the pnl calendar.
TradesViz's traders understand this.
Black Friday offer ⭐ = use code TVBF25 for upto 50% off! 🎉
See how your performance evolves - week by week. 📅📈
The Week View Calendar in TradesViz breaks down your trading activity into clear weekly insights.
Total PnL, percentage change, volume, and executions, all visualized through detailed charts.
Quickly spot high‑performance weeks, identify consistency patterns, and track recovery phases with data that speaks clearly.
Every week tells a story - uncover yours with the Week View Calendar on TradesViz. 👇
Do you check your Open Trade Summaries? 👀
Get a complete picture of your active positions - PnL, exposure, and risk - all in one clean, interactive view on TradesViz.
Identify which trades are performing, where risk is building, and how unrealized profits stack up across your portfolio.
Stay proactive, not reactive.
Review your Open Trades Summary on TradesViz and manage your positions with clarity and control. 👇
journal. visualize. improve. 📊
Everything you need to master your trades - all in one platform.
From AI‑powered insights and custom dashboards to 600+ charts, trade simulators, and auto‑sync for 45+ brokers, TradesViz delivers performance analytics built for serious traders.
🏷️ Get up to 50% off with code TVBF25 + 1‑year EZ Stock Screener subscription.
Level up your analysis, refine your edge, and make every trade count. 👇
TradesViz - where trading meets intelligence.
The stock screener for November 25, 2025, highlights a clear split between strong bullish breakouts and notable breakdowns, reflecting continued volatility and mixed sentiment across sectors.
In the stocks touching upper Bollinger Band group, $CORD led with a massive 167.7% price surge on 547.7K volume, up 582.9%, signaling strong breakout momentum. $RGTZ followed with a 121.3% gain, while $MSDD and $SMST advanced 115.2% and 114.4% respectively, both supported by sharp volume spikes. $CONI climbed 70.5%, and $ABVX added 20.5%. Larger caps such as $REGN and $EXPD gained 17.7% and 16.9%, though $EXPD showed a 42.4% drop in volume. $NTRA rose 16.3%, while $DY gained 14.1% with a healthy 104.9% jump in trading volume, confirming sustained buying action.
In the stocks breaking down with volume increase category, $NFE led with a 15.2% drop on 37.2M shares traded, a 354.2% increase in volume. $PLAG fell 10.2% with a staggering 74,968% volume spike, hinting at panic selling. $MCRB slipped 6.3%, $CTNM dipped 2.7%, and $MGTE dropped 5%. $STG slid 10.4% and $FATBB plunged 20.2% on strong volume, while $ORCX dropped 21.5%, marking the deepest decline in this section.
Overall, the November 25 screener shows aggressive divergence, with high-momentum moves on both sides of the market—growth-focused breakouts led by $CORD and $MSDD, and steep pullbacks in smaller-cap names like $PLAG and $ORCX—underscoring heightened volatility heading into the week’s close.