TradesViz

TradesViz

Layer by layer, Step by Step: More useful insights & planning ahead Let's start getting real. Most useful insights don't come from just pnl - they come from a combination of your inputs, advanced stats, and all of it together. Toggle off the "Simple mode" and start checking the tabs under Performance Metrics and Ratios. You may see a bunch of stats you've probably not heard of if you are a new trader. Don't fret. Don't worry. These are easy to understand, common metrics. Trade expectancy: (Average winning amount x Win ratio) - (Average losing amount x Loss ratio) R-value: Total PnL/Total risk taken (based on stop loss that you have for a trade). Hit Ratio: (No. of wins)/(No. of wins + No. of losses) Profit Factor: Total profit/absolute value of total loss

View original post
TradesViz

TradesViz

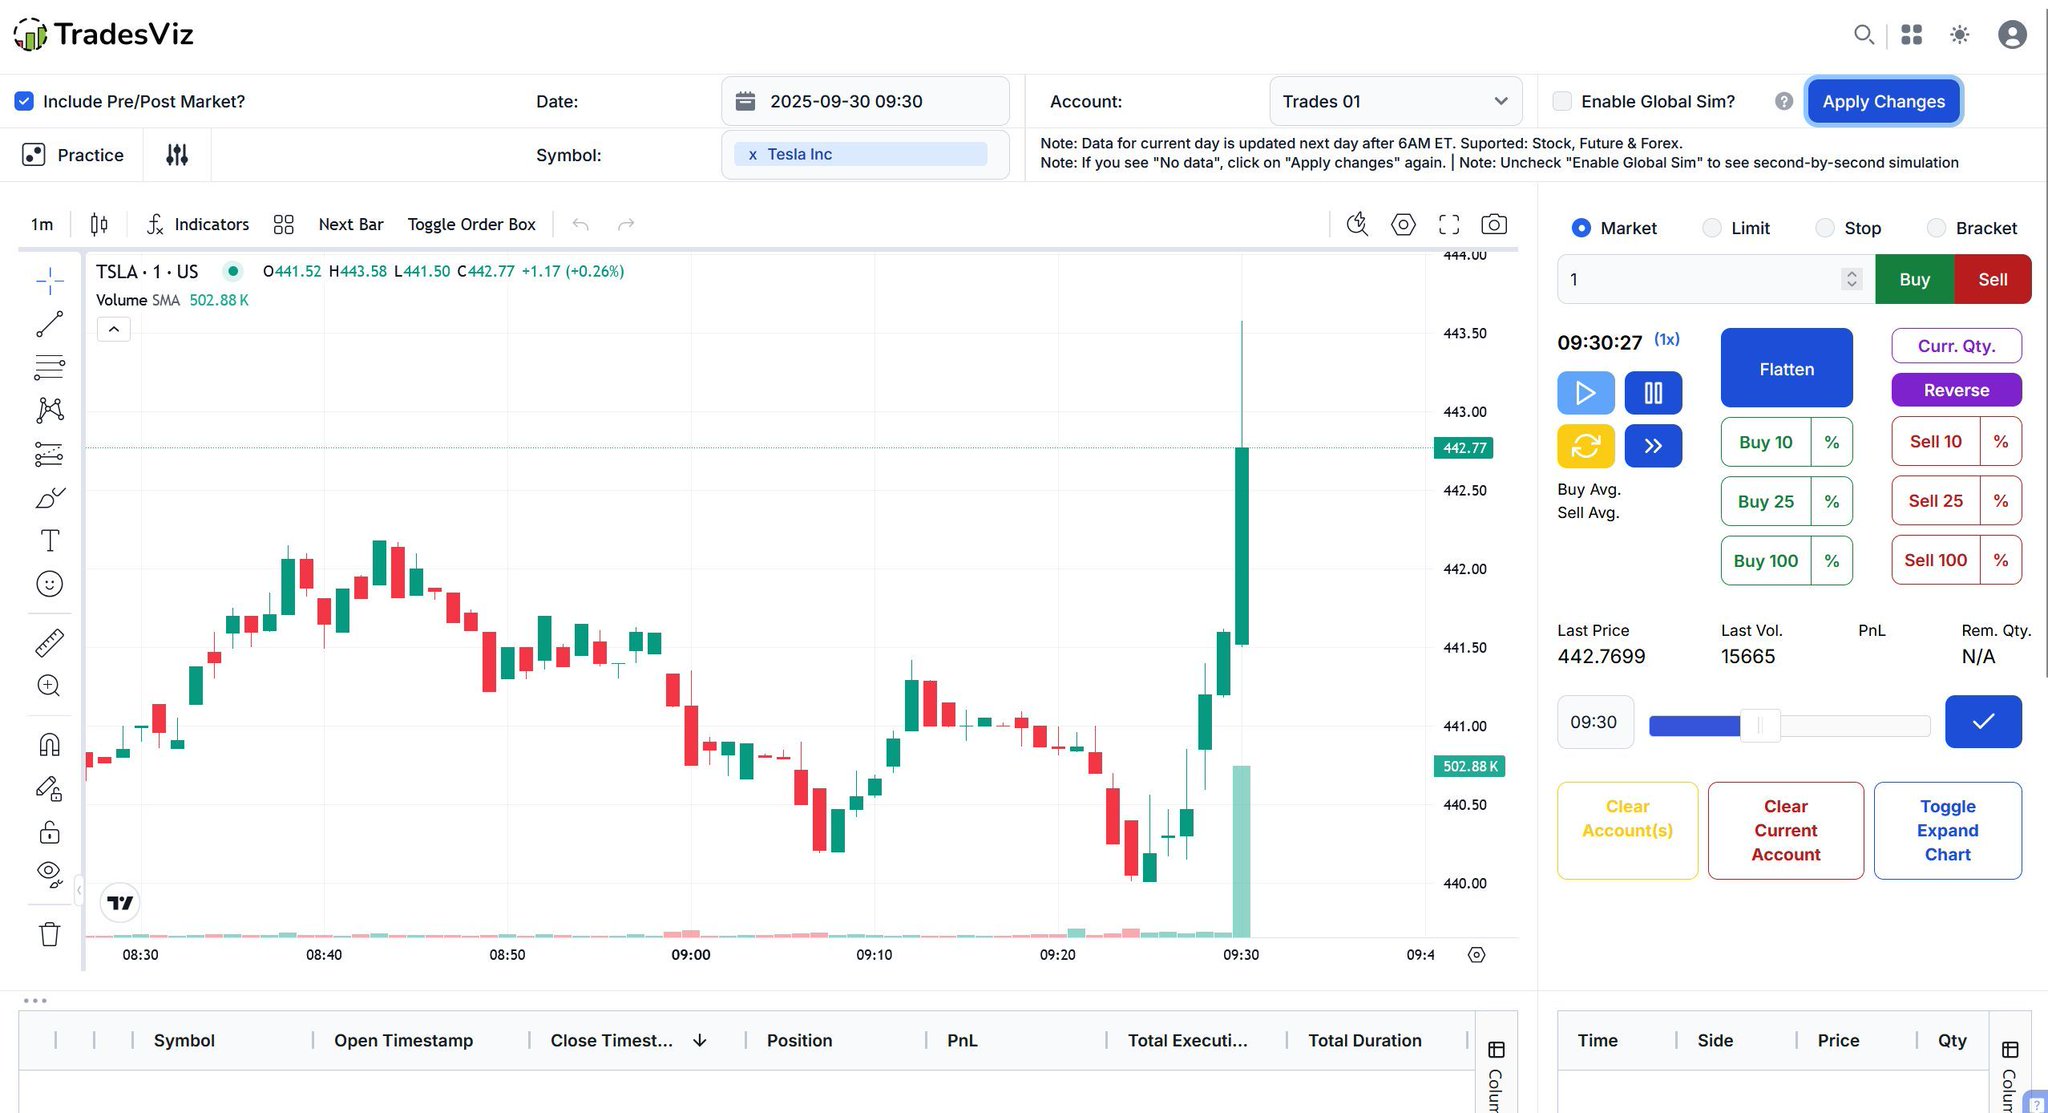
Practice your setups. Test your reactions. Build real confidence — risk-free. The Trading Simulator in TradesViz lets you replay real market data second-by-second and execute trades like it's live. Simulate order types, adjust position sizing, and refine your timing across any symbol you choose. Perfect for weekend drills or sharpening before market open. Train like a pro. Trade like one too.

User-posted image
View original post
TradesViz

TradesViz

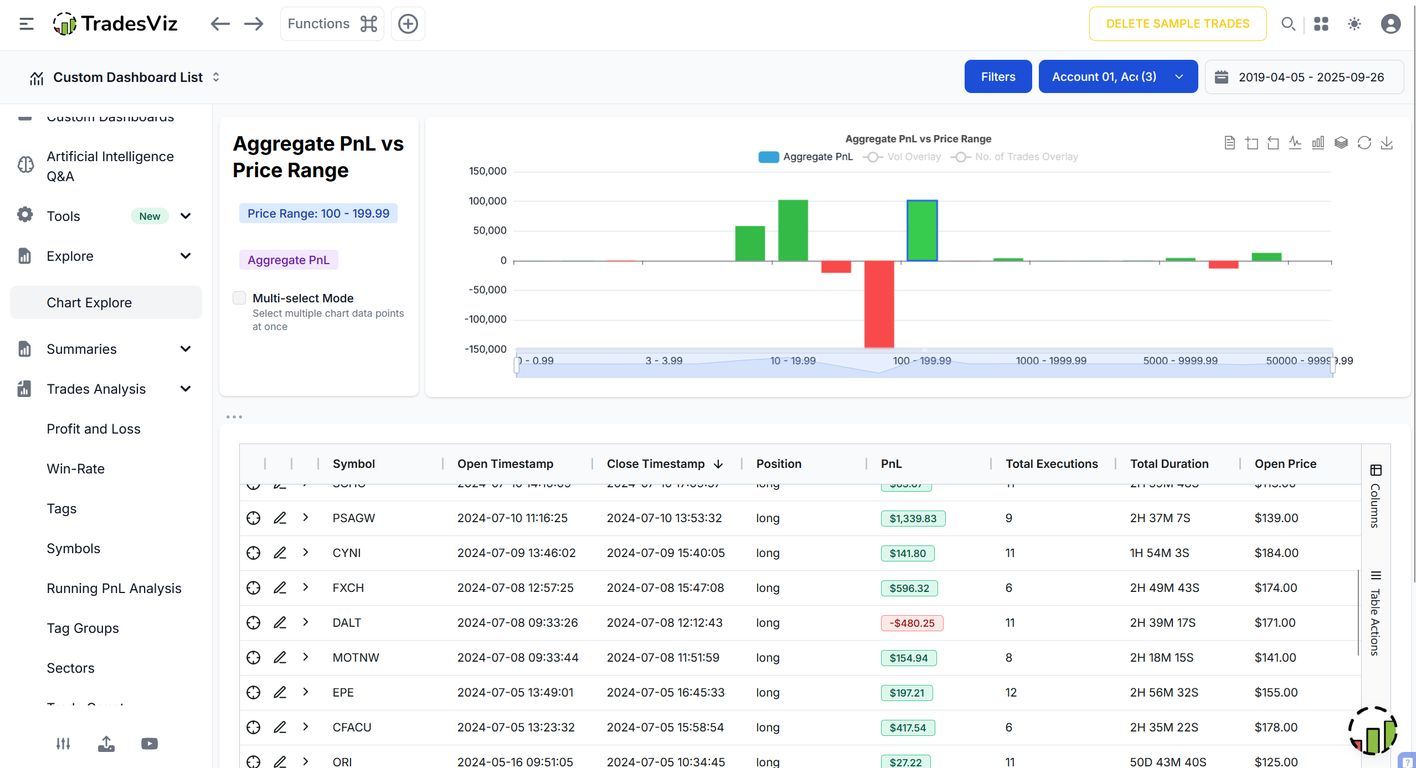
Your data is more than just numbers — it’s an entry point to insight. With Chart Explore in TradesViz, you can click on any chart bar to instantly drill into the trades behind it. Go from macro to micro in one click — filter by price, volume, time, and dig deeper into what’s really driving your PnL. No more switching tabs. Just click, explore, learn. Because the answers are always behind the bars — literally.

User-posted image
View original post
TradesViz

TradesViz

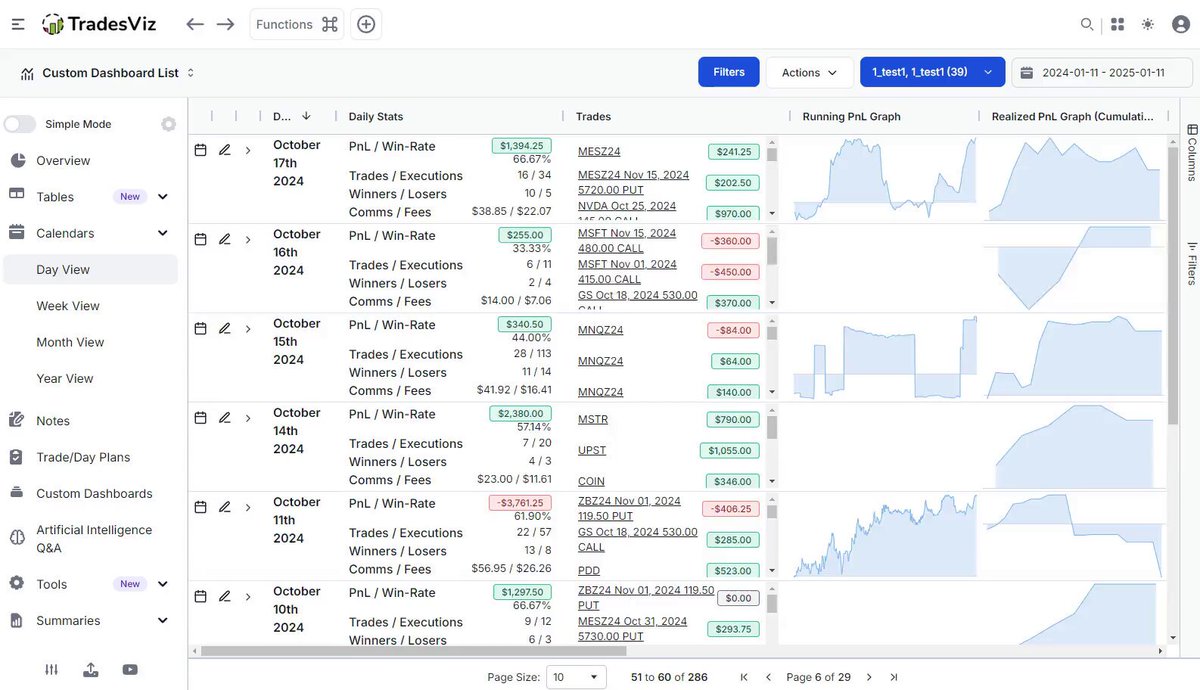
Sep 2025 wrapped up! 👏 ✅ Make sure to review your trades using the day view on TradesViz trading journal - it takes a few minutes, and you get to learn: - Max drawdowns - PnL metrics - Best/worst trades - Daily summary + More! Check the example below 👇🔖

User-posted image
View original post
TradesViz

TradesViz

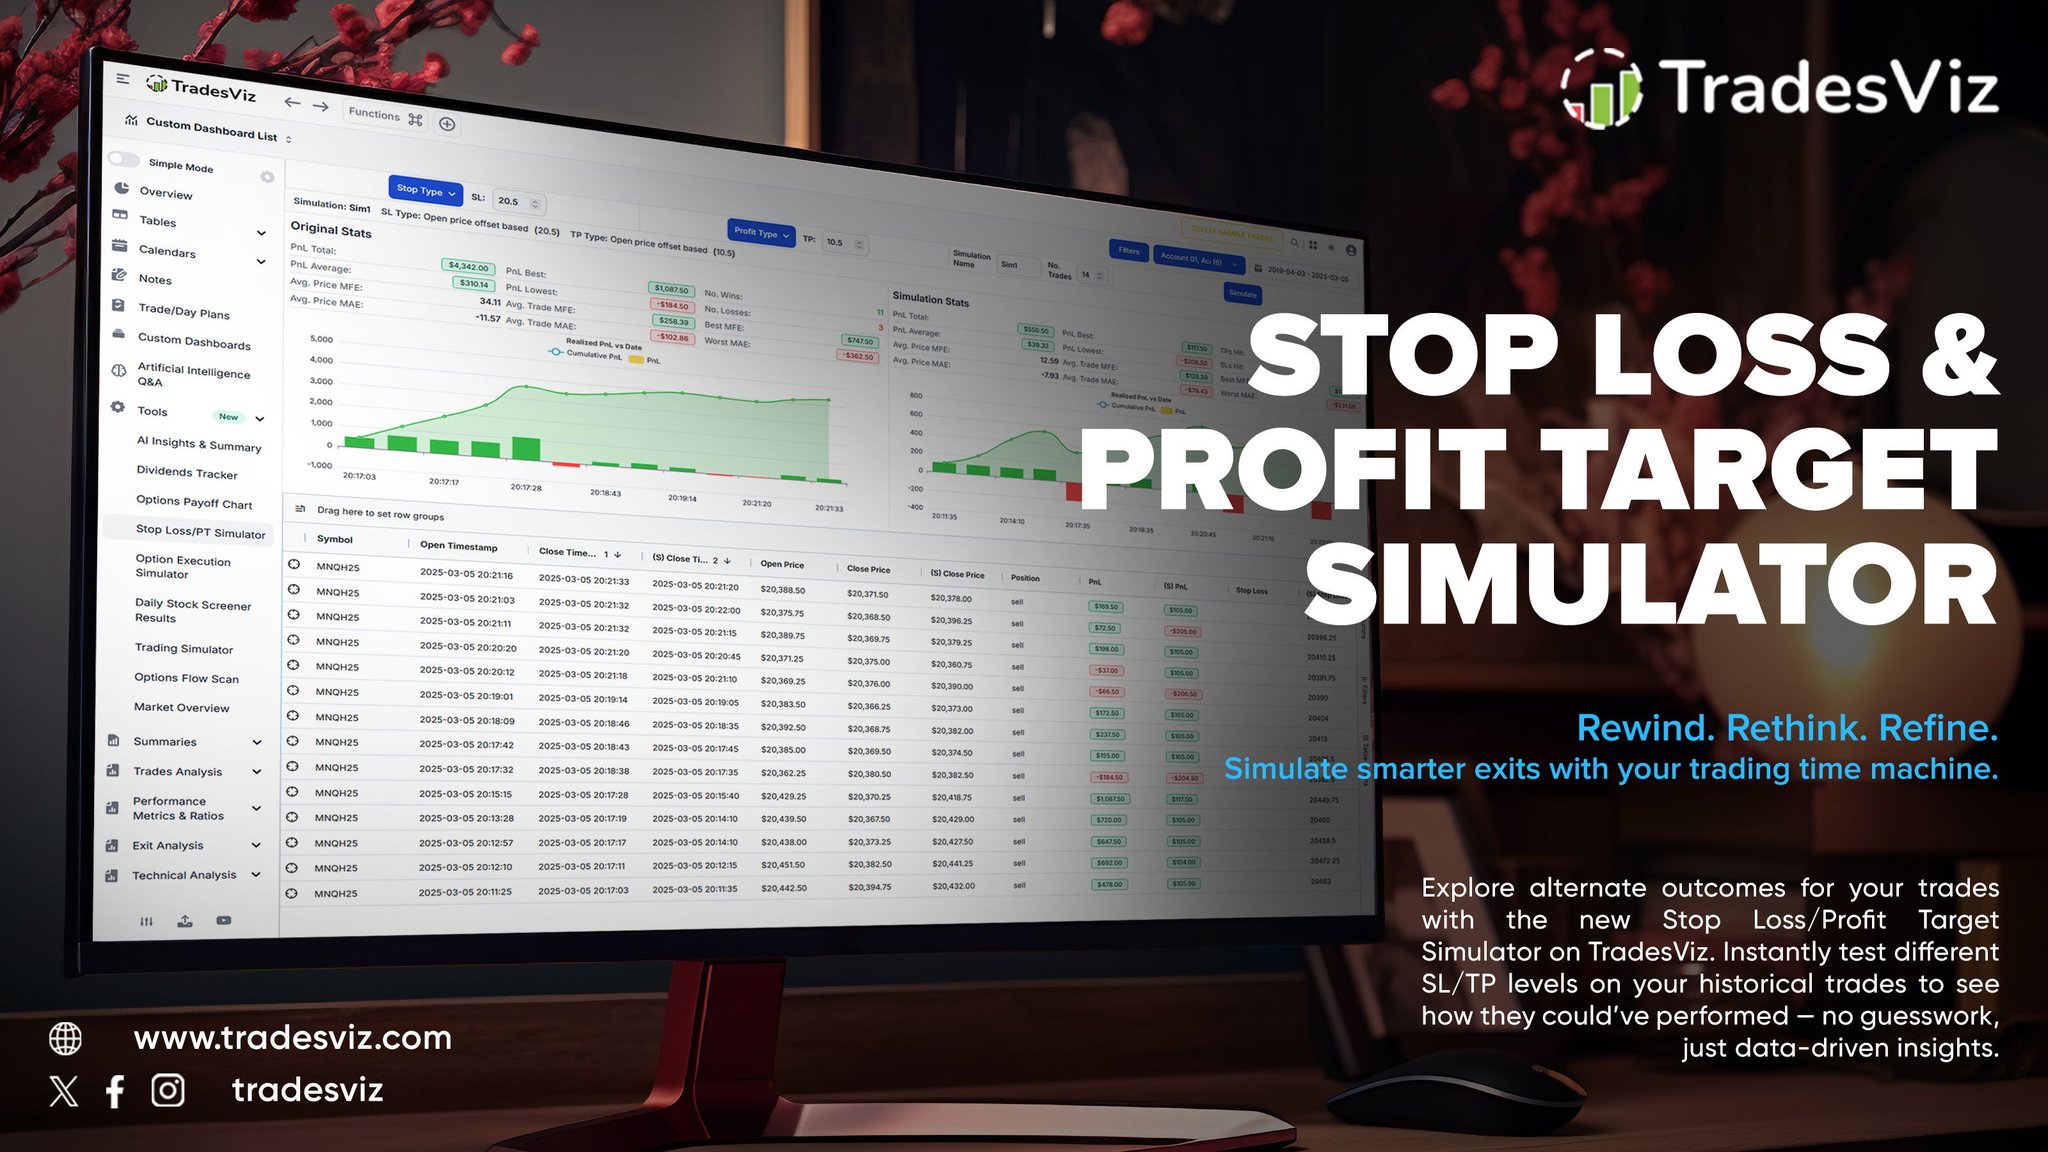
Rewind. Rethink. Refine. The Stop Loss & Profit Target Simulator on TradesViz lets you simulate different exit strategies on your past trades — instantly. Test hundreds of SL/TP variations and see how your performance could’ve improved. No what-ifs, just real, data-backed insights to sharpen your edge. Smarter exits start with smarter simulations.

User-posted image
View original post
TradesViz

TradesViz

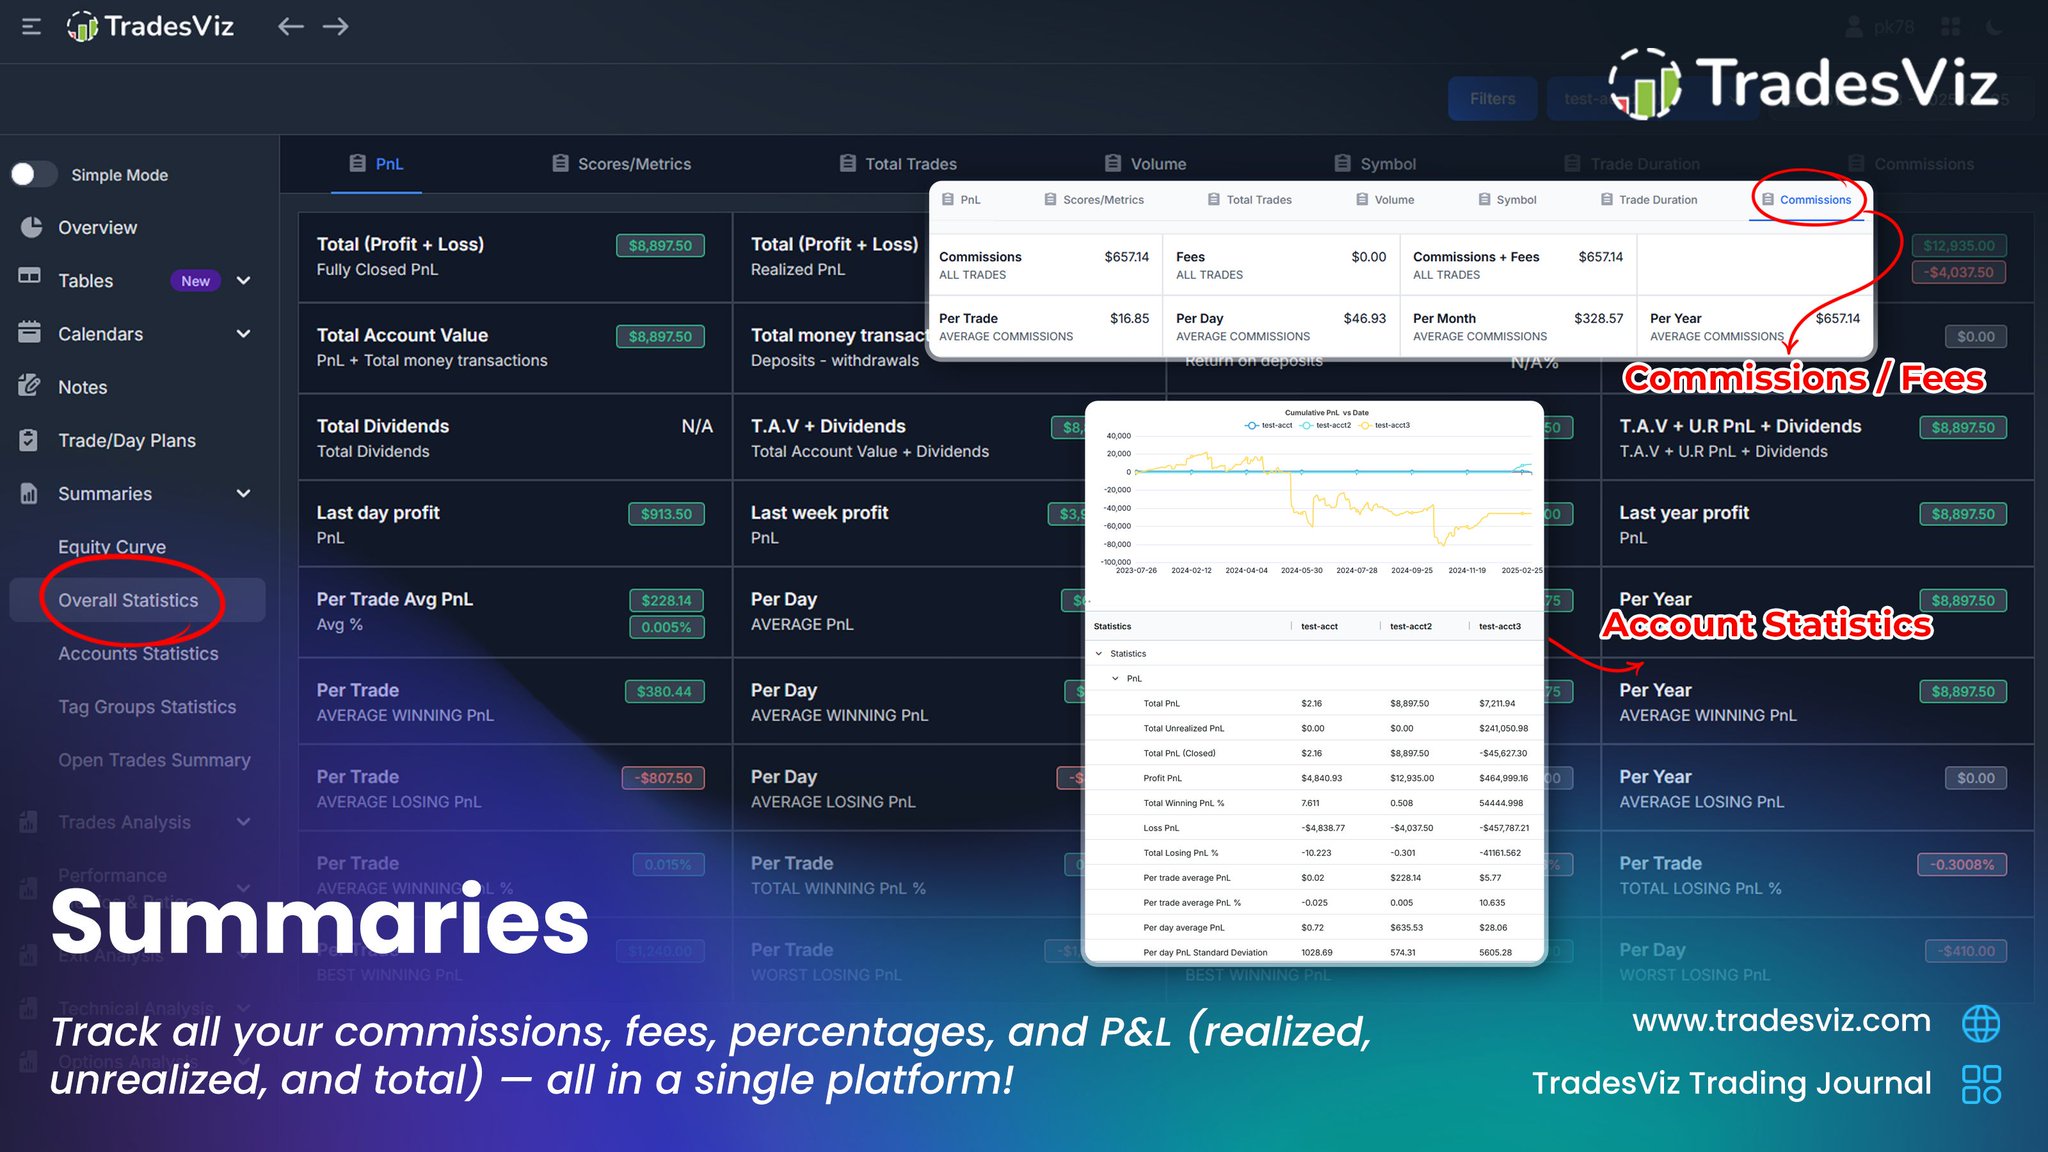
Your entire trading performance — summarized in one powerful view. The Summaries tab in TradesViz gives you a complete breakdown of P&L, commissions, fees, averages, and account growth. Track realized/unrealized gains, review trade efficiency, and see how costs impact your edge. No spreadsheets, no guesses — just clean, actionable data. Because mastering your stats is how you master your strategy.

User-posted image
View original post
TradesViz

TradesViz

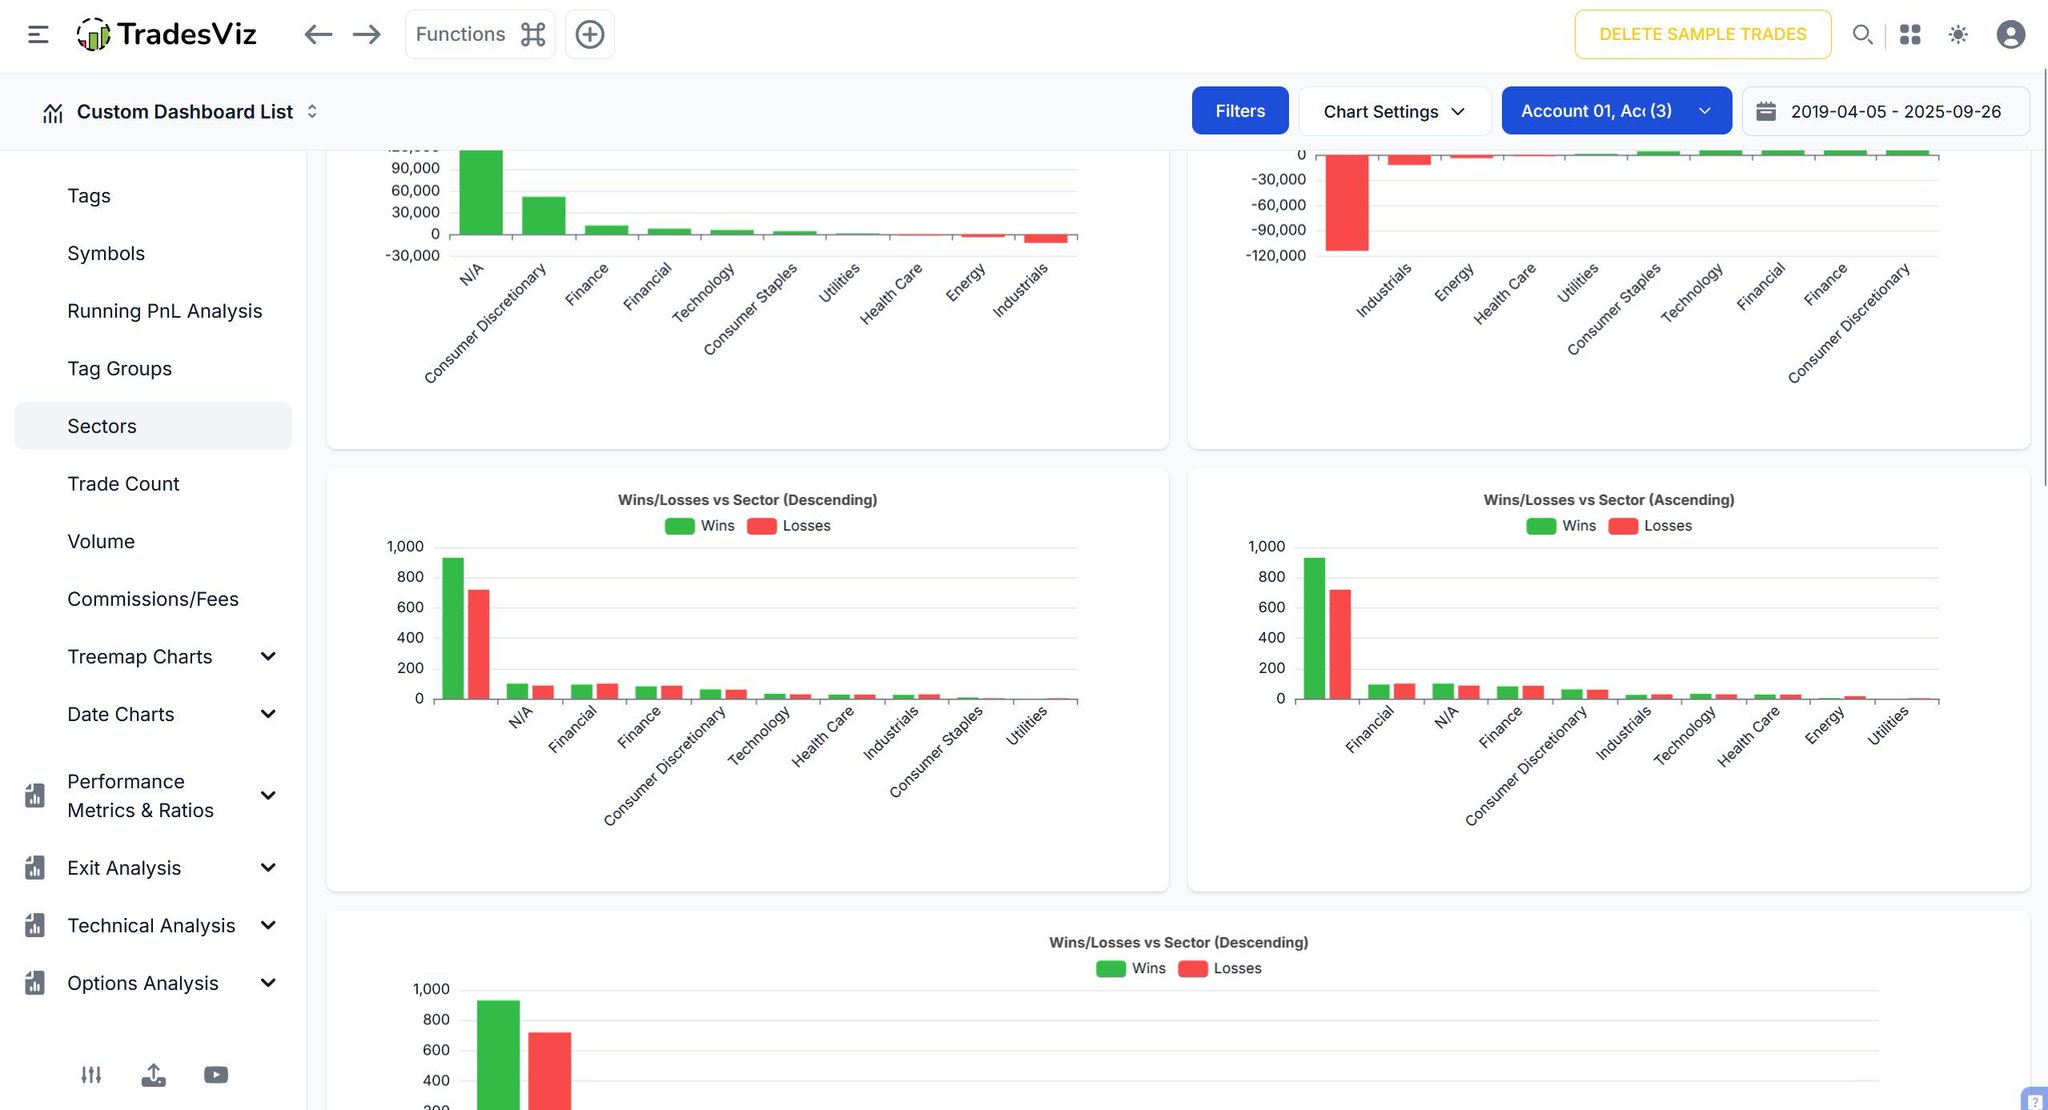
Know where you truly perform — by sector. The Sectors tab in TradesViz breaks down your wins, losses, and PnL across industries with clear charts. Spot which sectors fuel your edge and which ones drain your equity. Less guessing, more focused execution. Because not all setups — or sectors — are created equal.

User-posted image
View original post
TradesViz

TradesViz

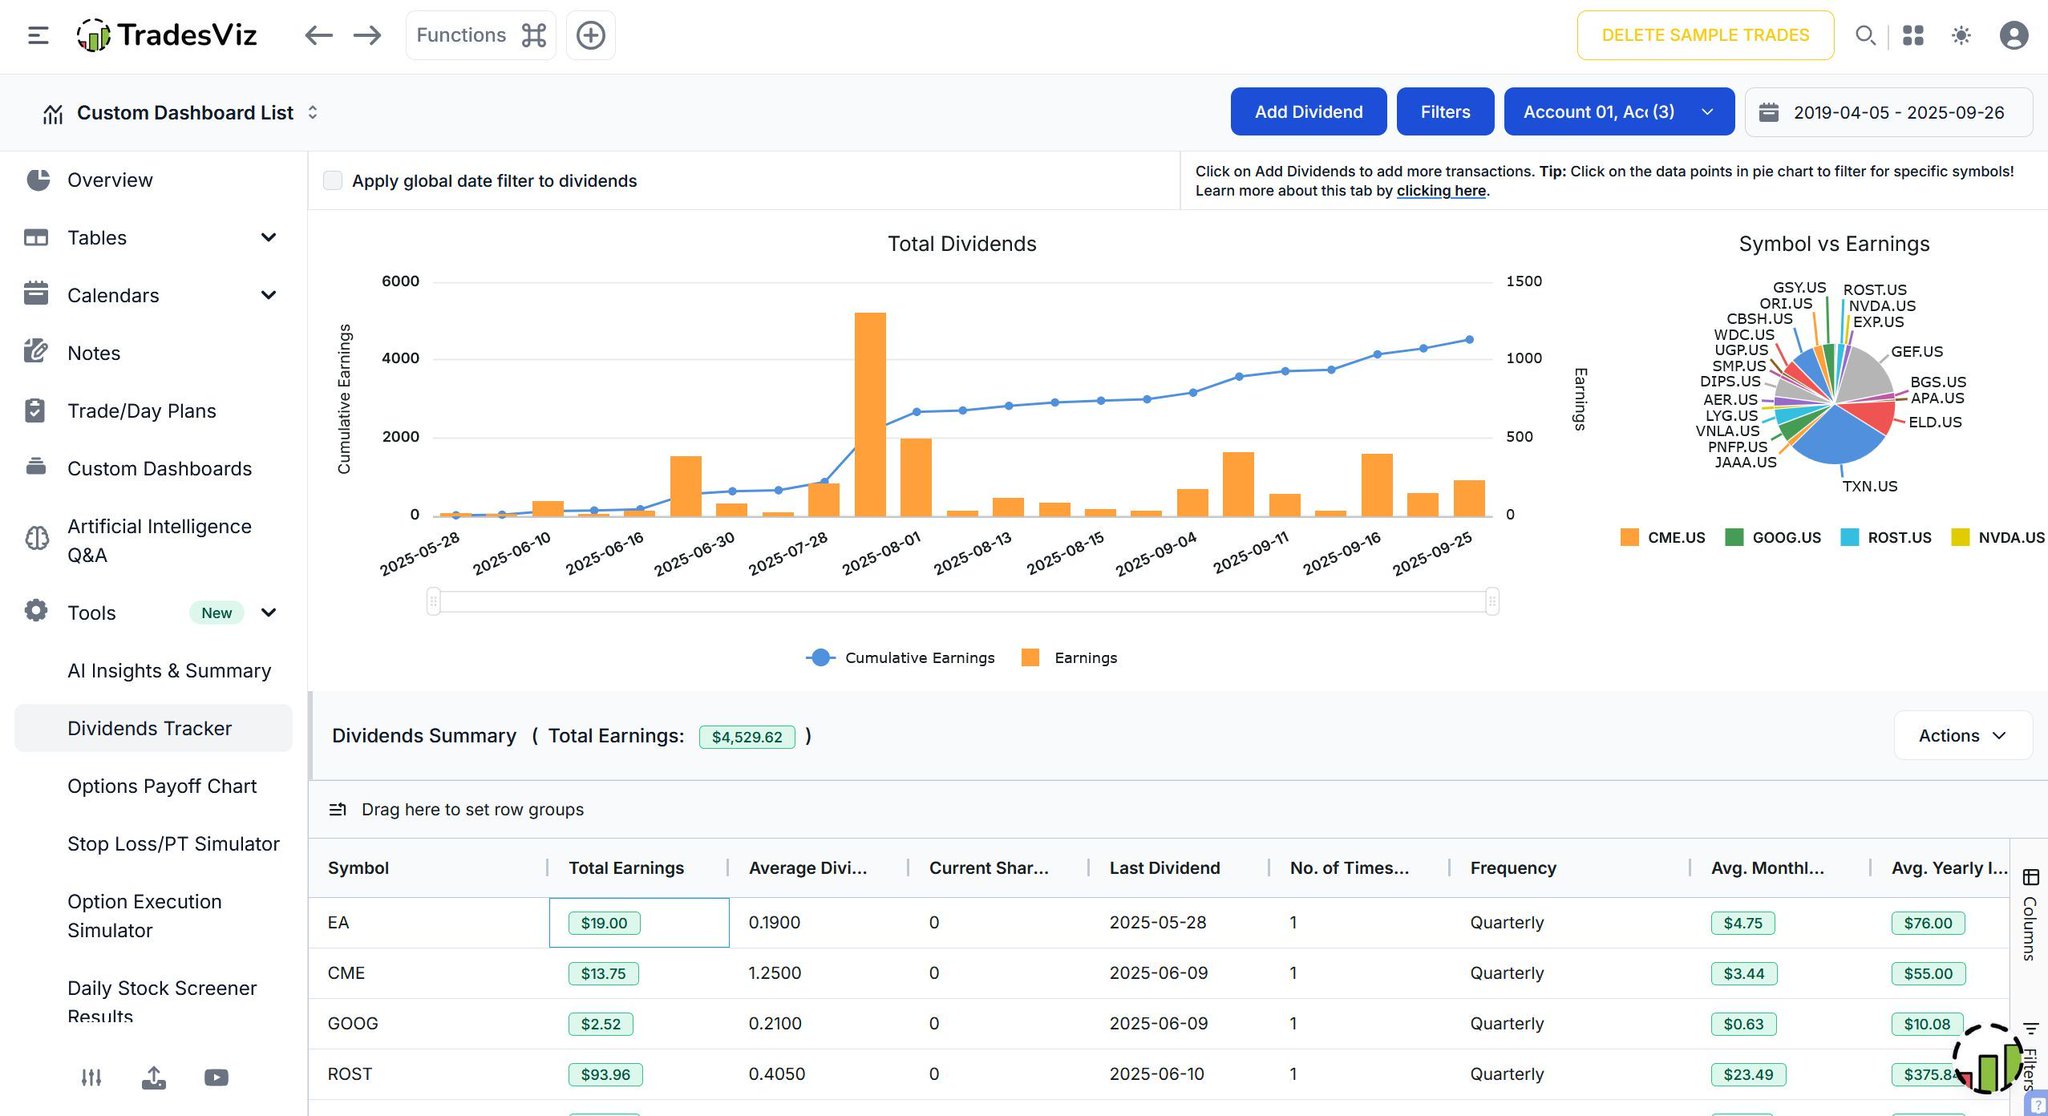
Track every payout, visualize your growth. The Dividends Tracker in TradesViz helps you monitor cumulative earnings, frequency, and income per stock with clean charts and breakdowns. See which symbols are boosting your passive returns and when the payouts hit. Simple, visual, and fully organized — because real returns aren’t just from trades.

User-posted image
View original post
TradesViz

TradesViz

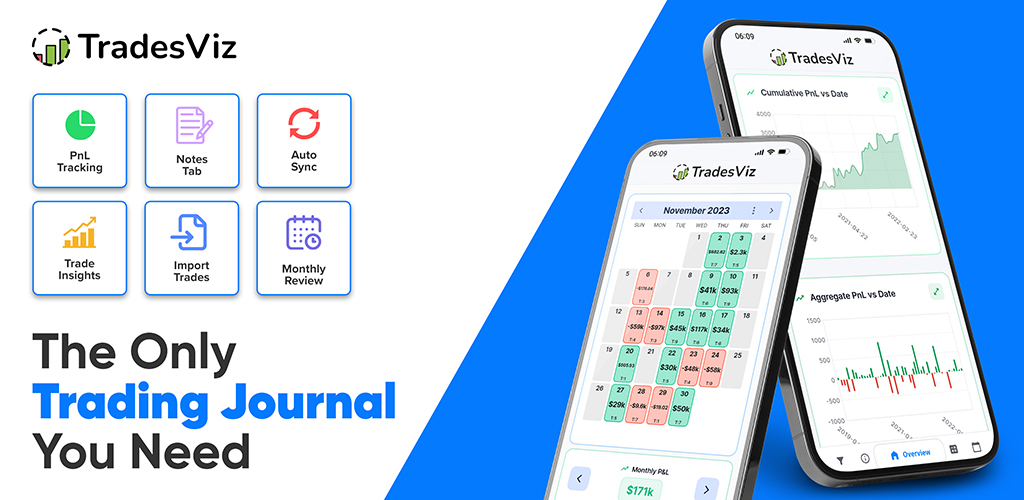
🎉 ALL-NEW TradesViz v2.0 Mobile App Launched! + Completely revamped UI + Auto-sync on the go + Import 200+ brokers + 60+ Charts/100+ Metrics + Faster dashboards + MFE/MAE metrics Out for both Android/iOS! Download for free! The best mobile trade journaling experience 👇

User-posted image
View original post
TradesViz

TradesViz

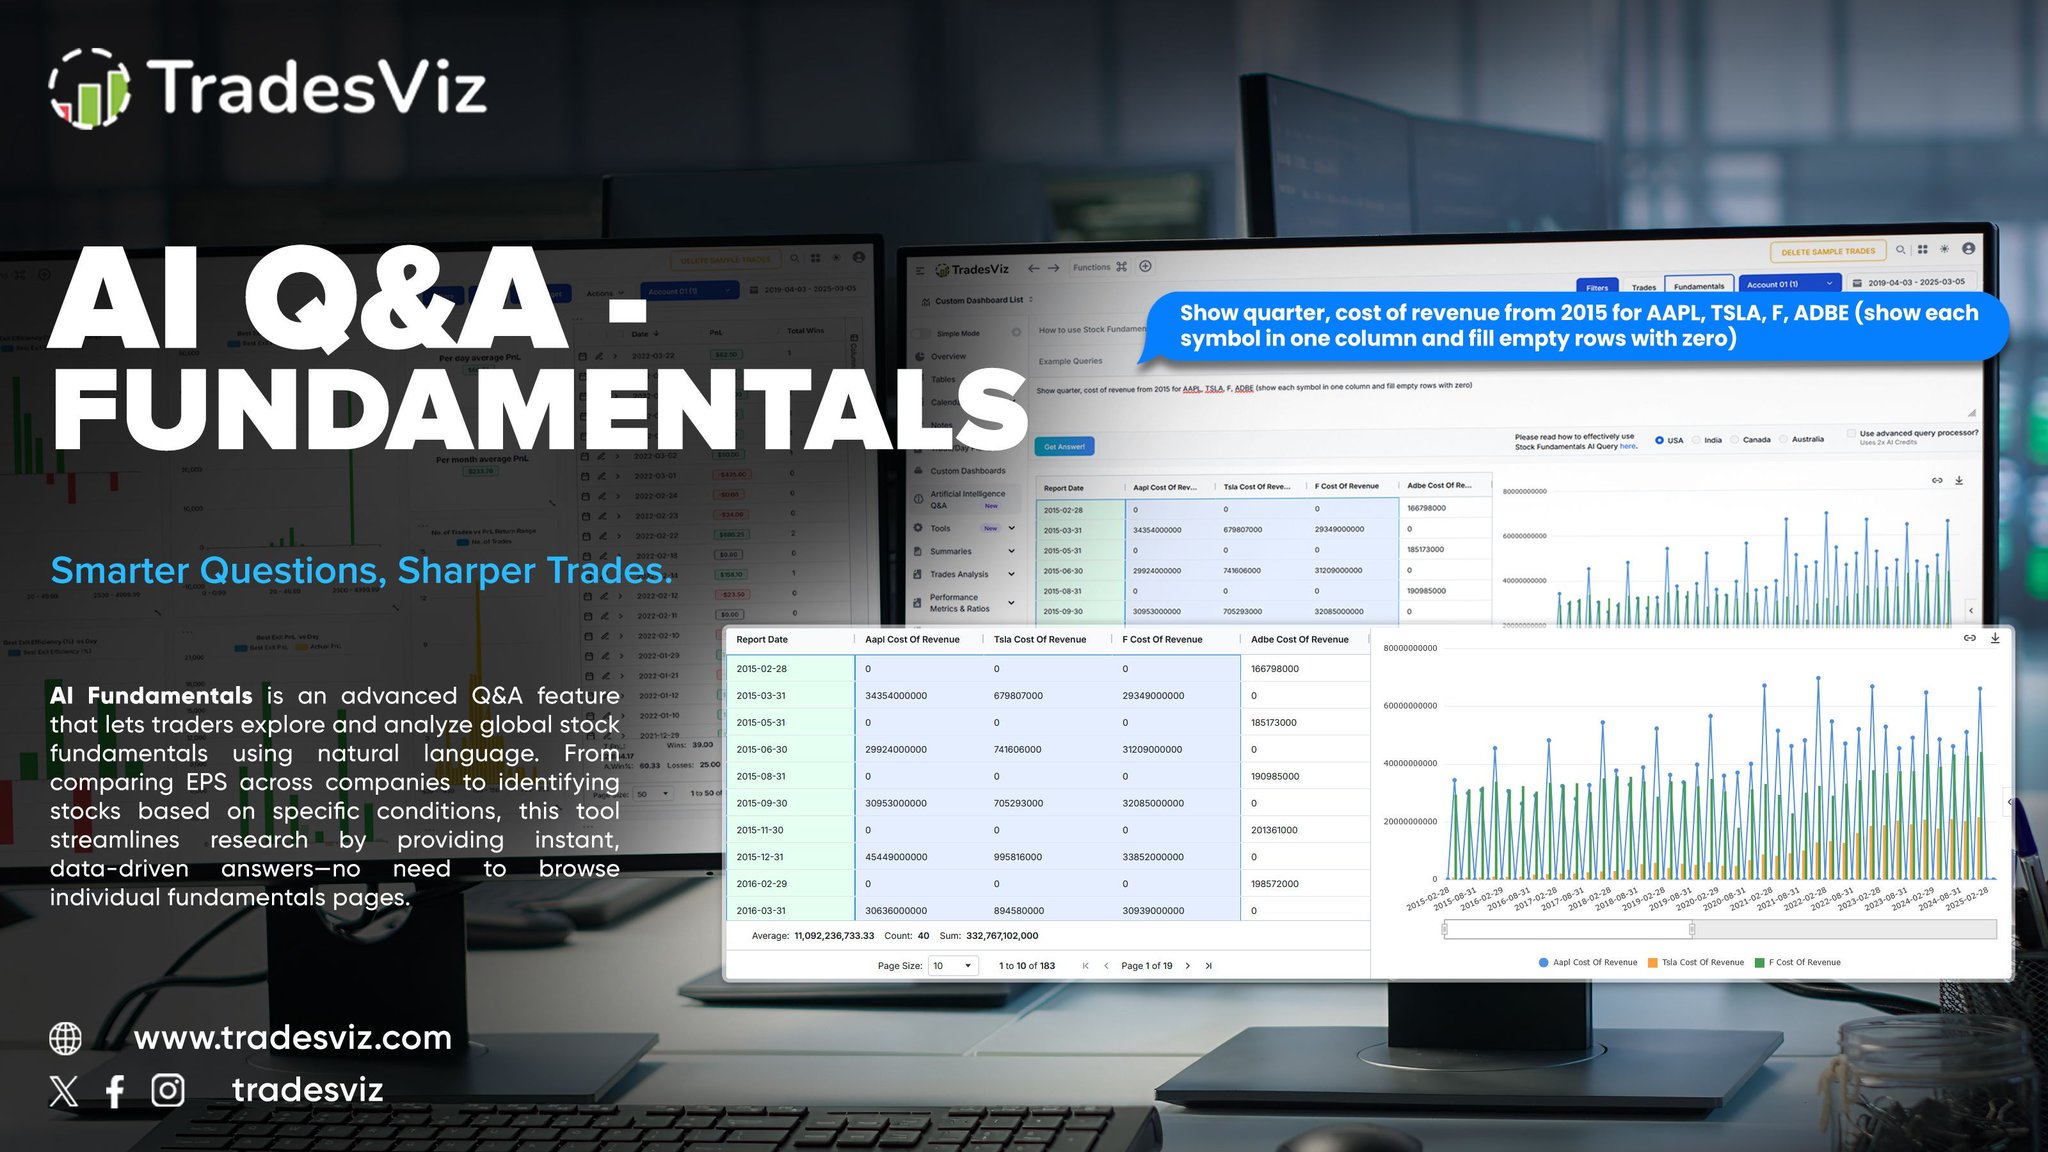
Ask smarter questions, get sharper insights — instantly. The AI Q&A – Fundamentals tool in TradesViz lets you explore stock fundamentals with natural language. Just type your query — compare EPS, revenue, margins, and more without digging through endless reports. Quick, accurate, and visual answers that save time and elevate your research. Because powerful trades start with the right data.

User-posted image
View original post