TradesViz

TradesViz

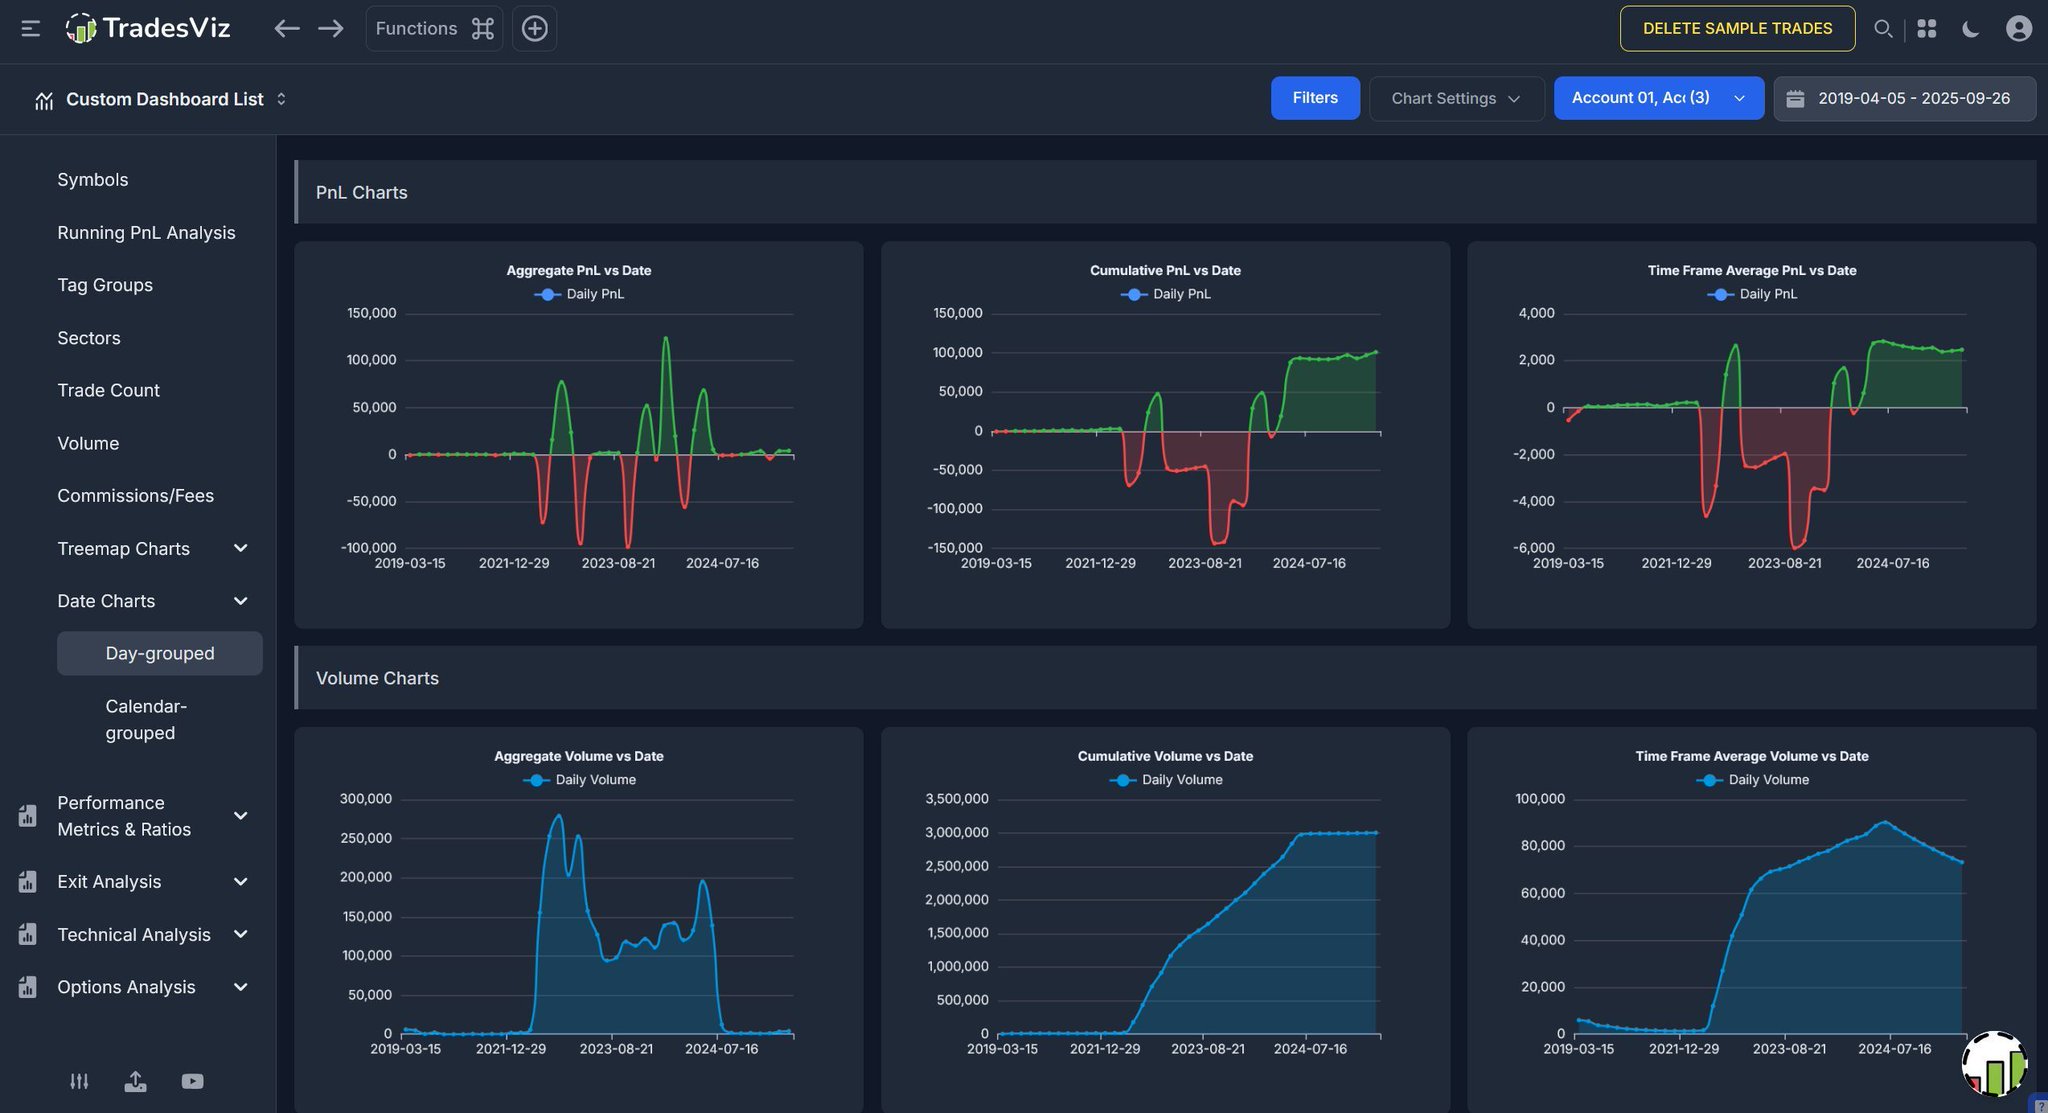
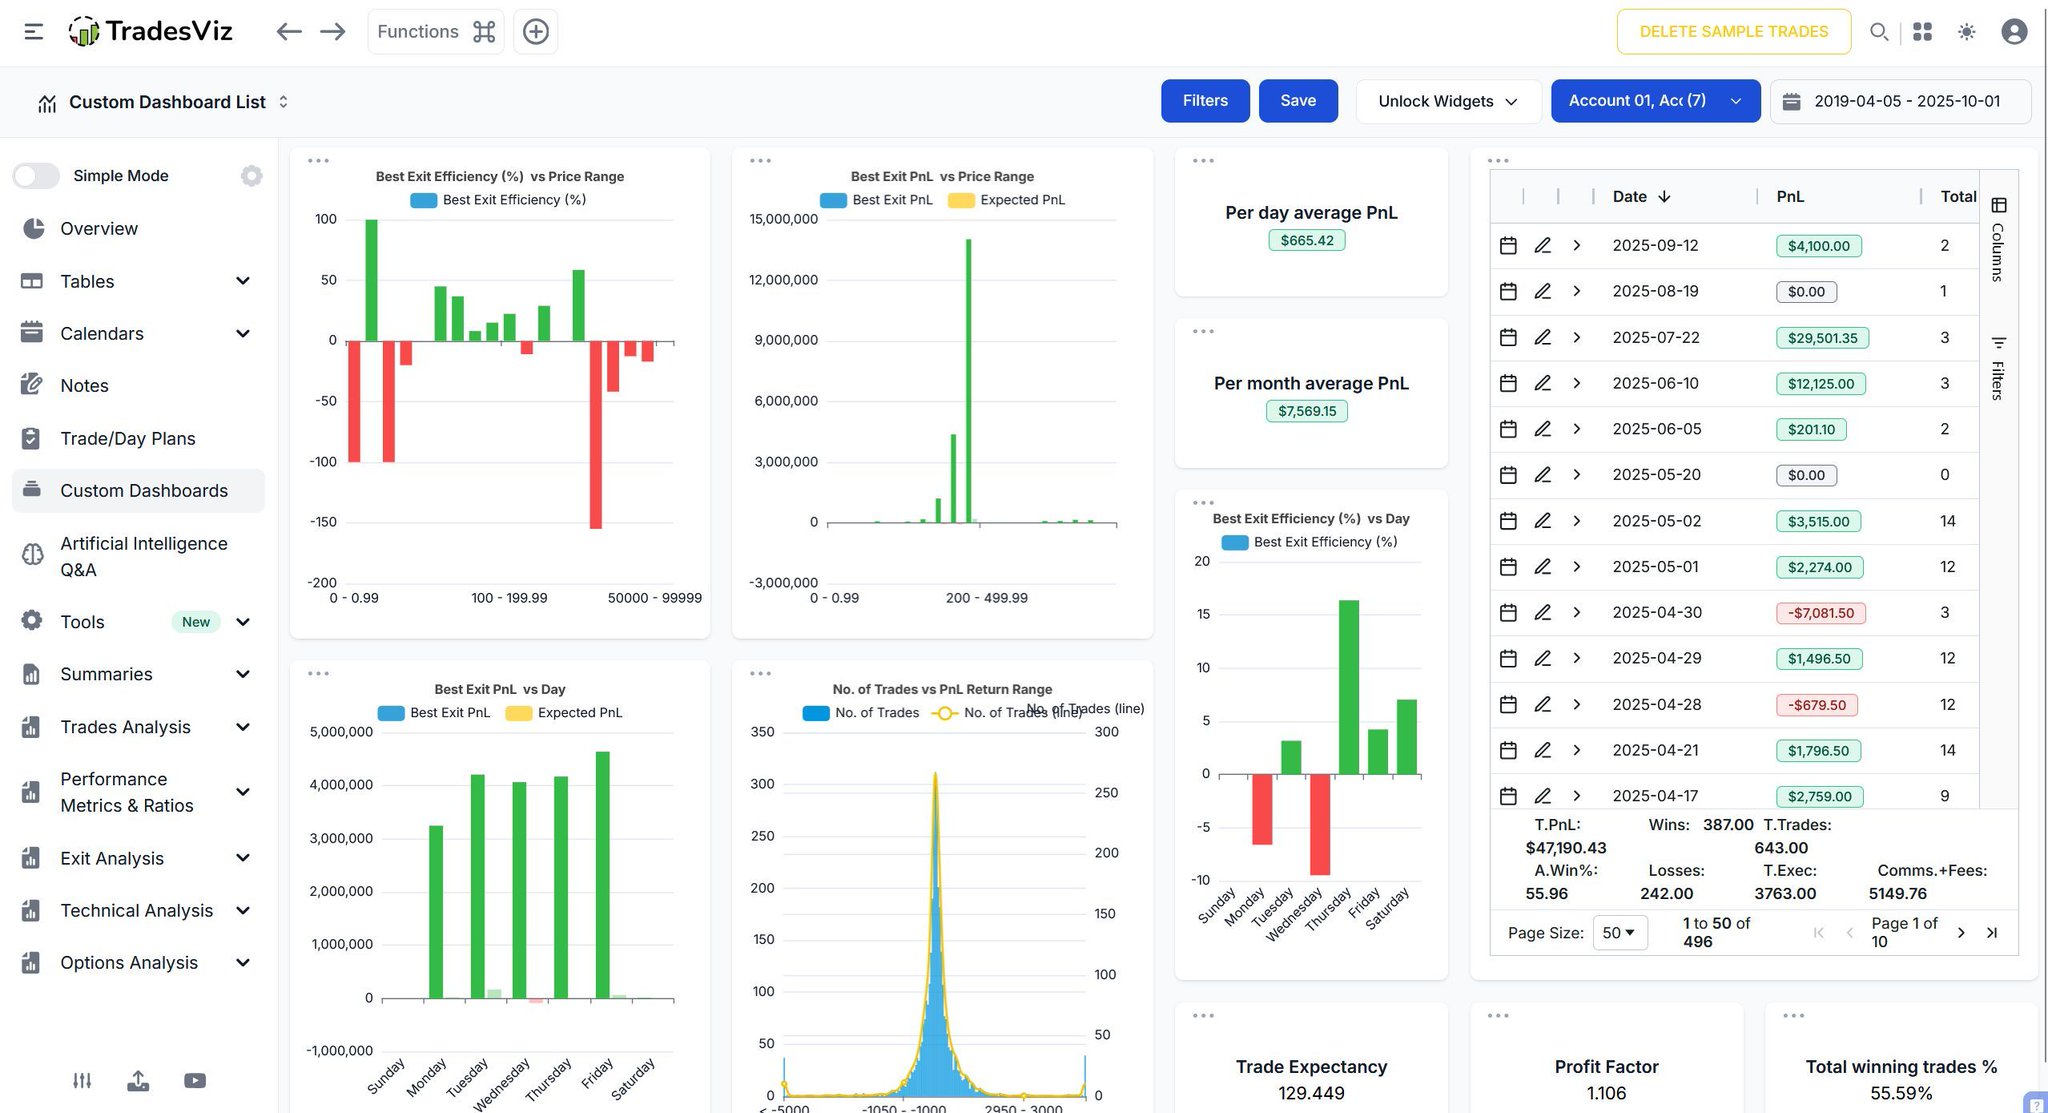
A trading desk needs precision, not noise. The Custom Dashboard in TradesViz is built to deliver exactly that 📊 Every chart, stat, and view is fully customizable so your workspace mirrors the way you track risk, PnL, and positioning. Nothing is fixed, the layout adapts to your process with conviction ⚙️ If you prefer structure from the start, prebuilt templates are available. Each one is designed to light up the tape with meaningful flow, keeping what matters most on your radar 📈
User-posted image
View original post
TradesViz

TradesViz

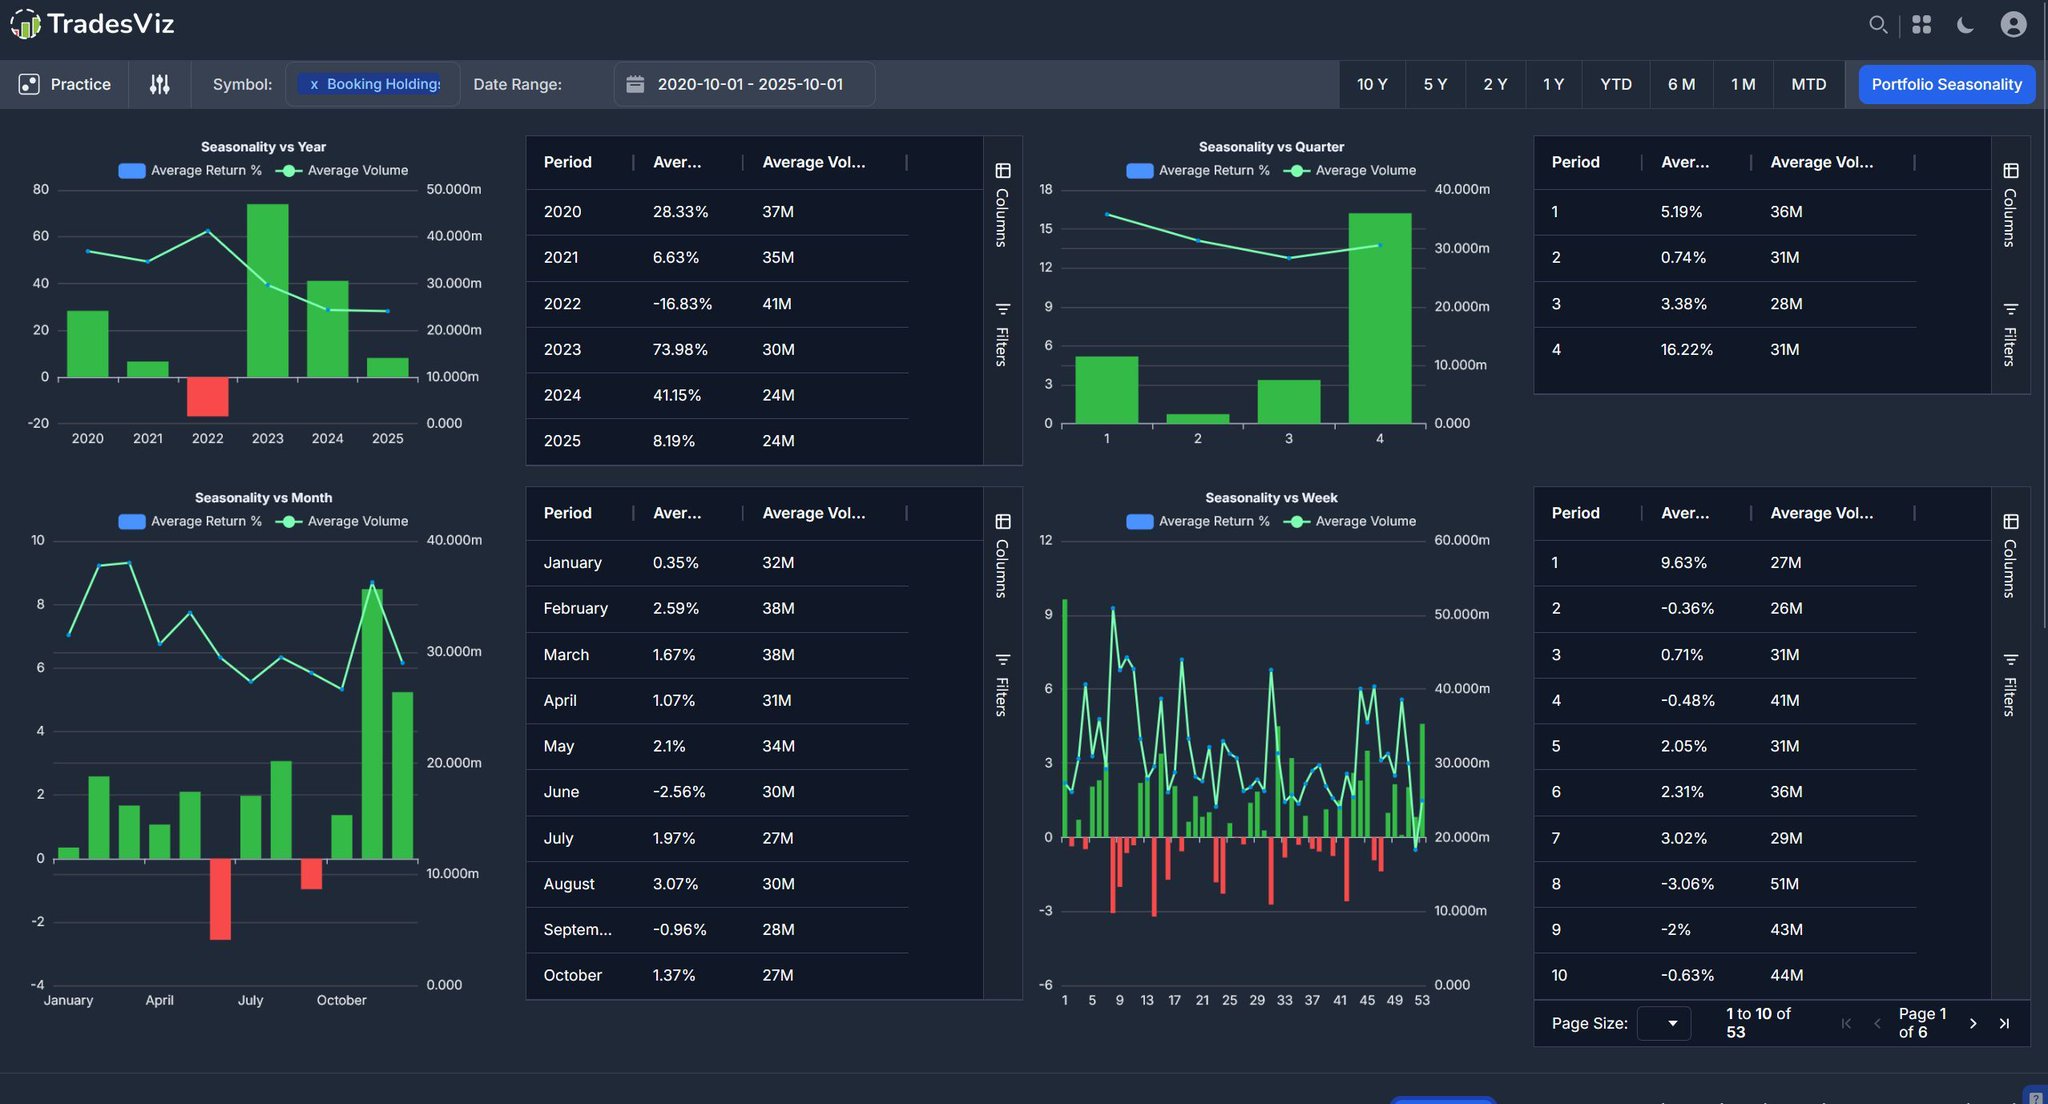
Oct seasonality for  $SPY 🤩 Looks beautiful! What are your plans for this month? We hope you've set your goals and prepared your plans on TradesViz! This is going to be a great month for everyone! 😁

User-posted image
View original post
TradesViz

TradesViz

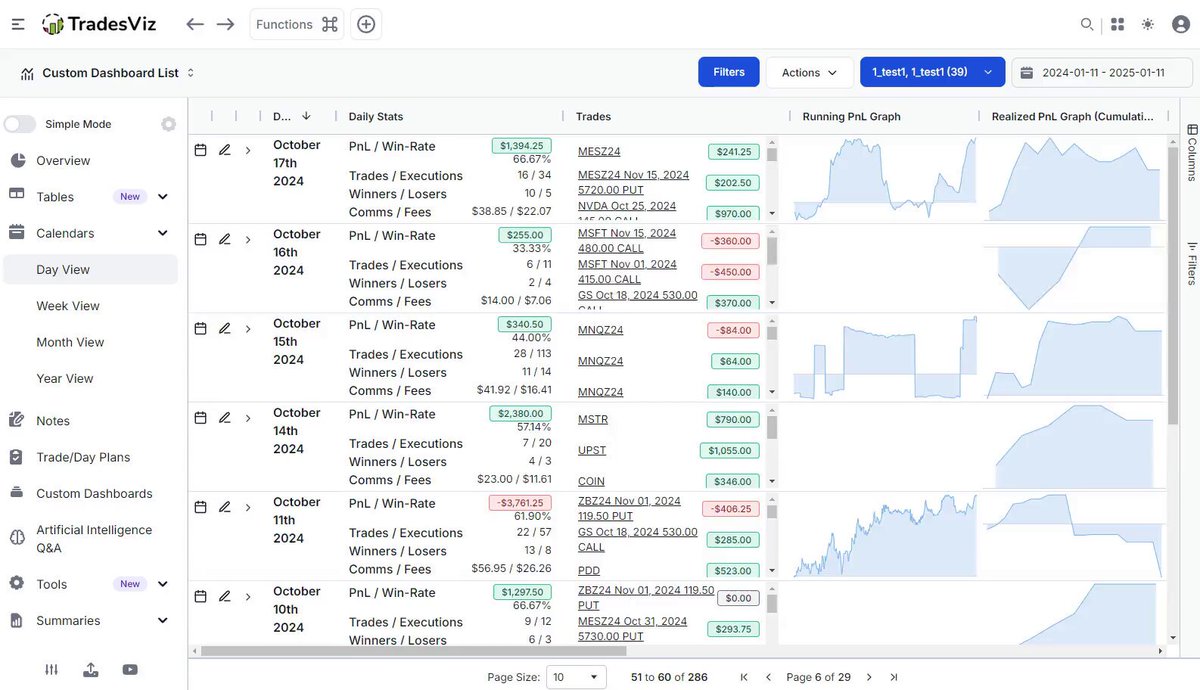
Track your trading performance one day at a time. The Day-Grouped view in TradesViz gives you a detailed breakdown of daily PnL, volume, and trade activity — all visualized and easy to compare. Spot patterns in your best and worst trading days, identify streaks, and fine-tune your setup timing. This is where daily discipline meets data-driven decision making. Every day leaves a footprint — it's time to follow it.

User-posted image
View original post
TradesViz

TradesViz

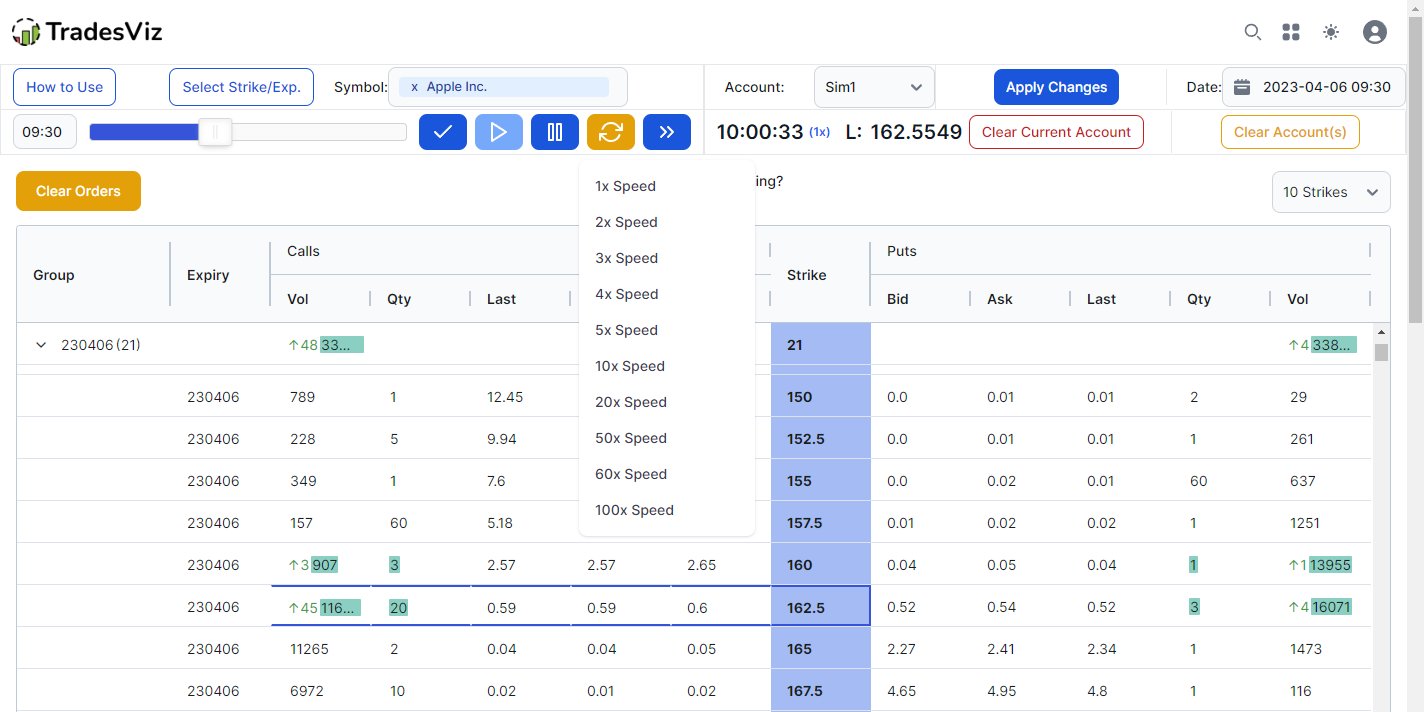
If you have your goals set and you know what you need, TradesViz can help you reach them. Example: Intraday trading options? You need practice, LOTS of it. This is MUCH more complex than scalping stocks. TradesViz has an entire options chain simulator to help you here. Name one other alternative that works as well as TradesViz with options, for options traders. There are none. Options flow, options charts, simulator, backtester, greeks - it's all here. Only on TradesViz.

User-posted image
View original post
TradesViz

TradesViz

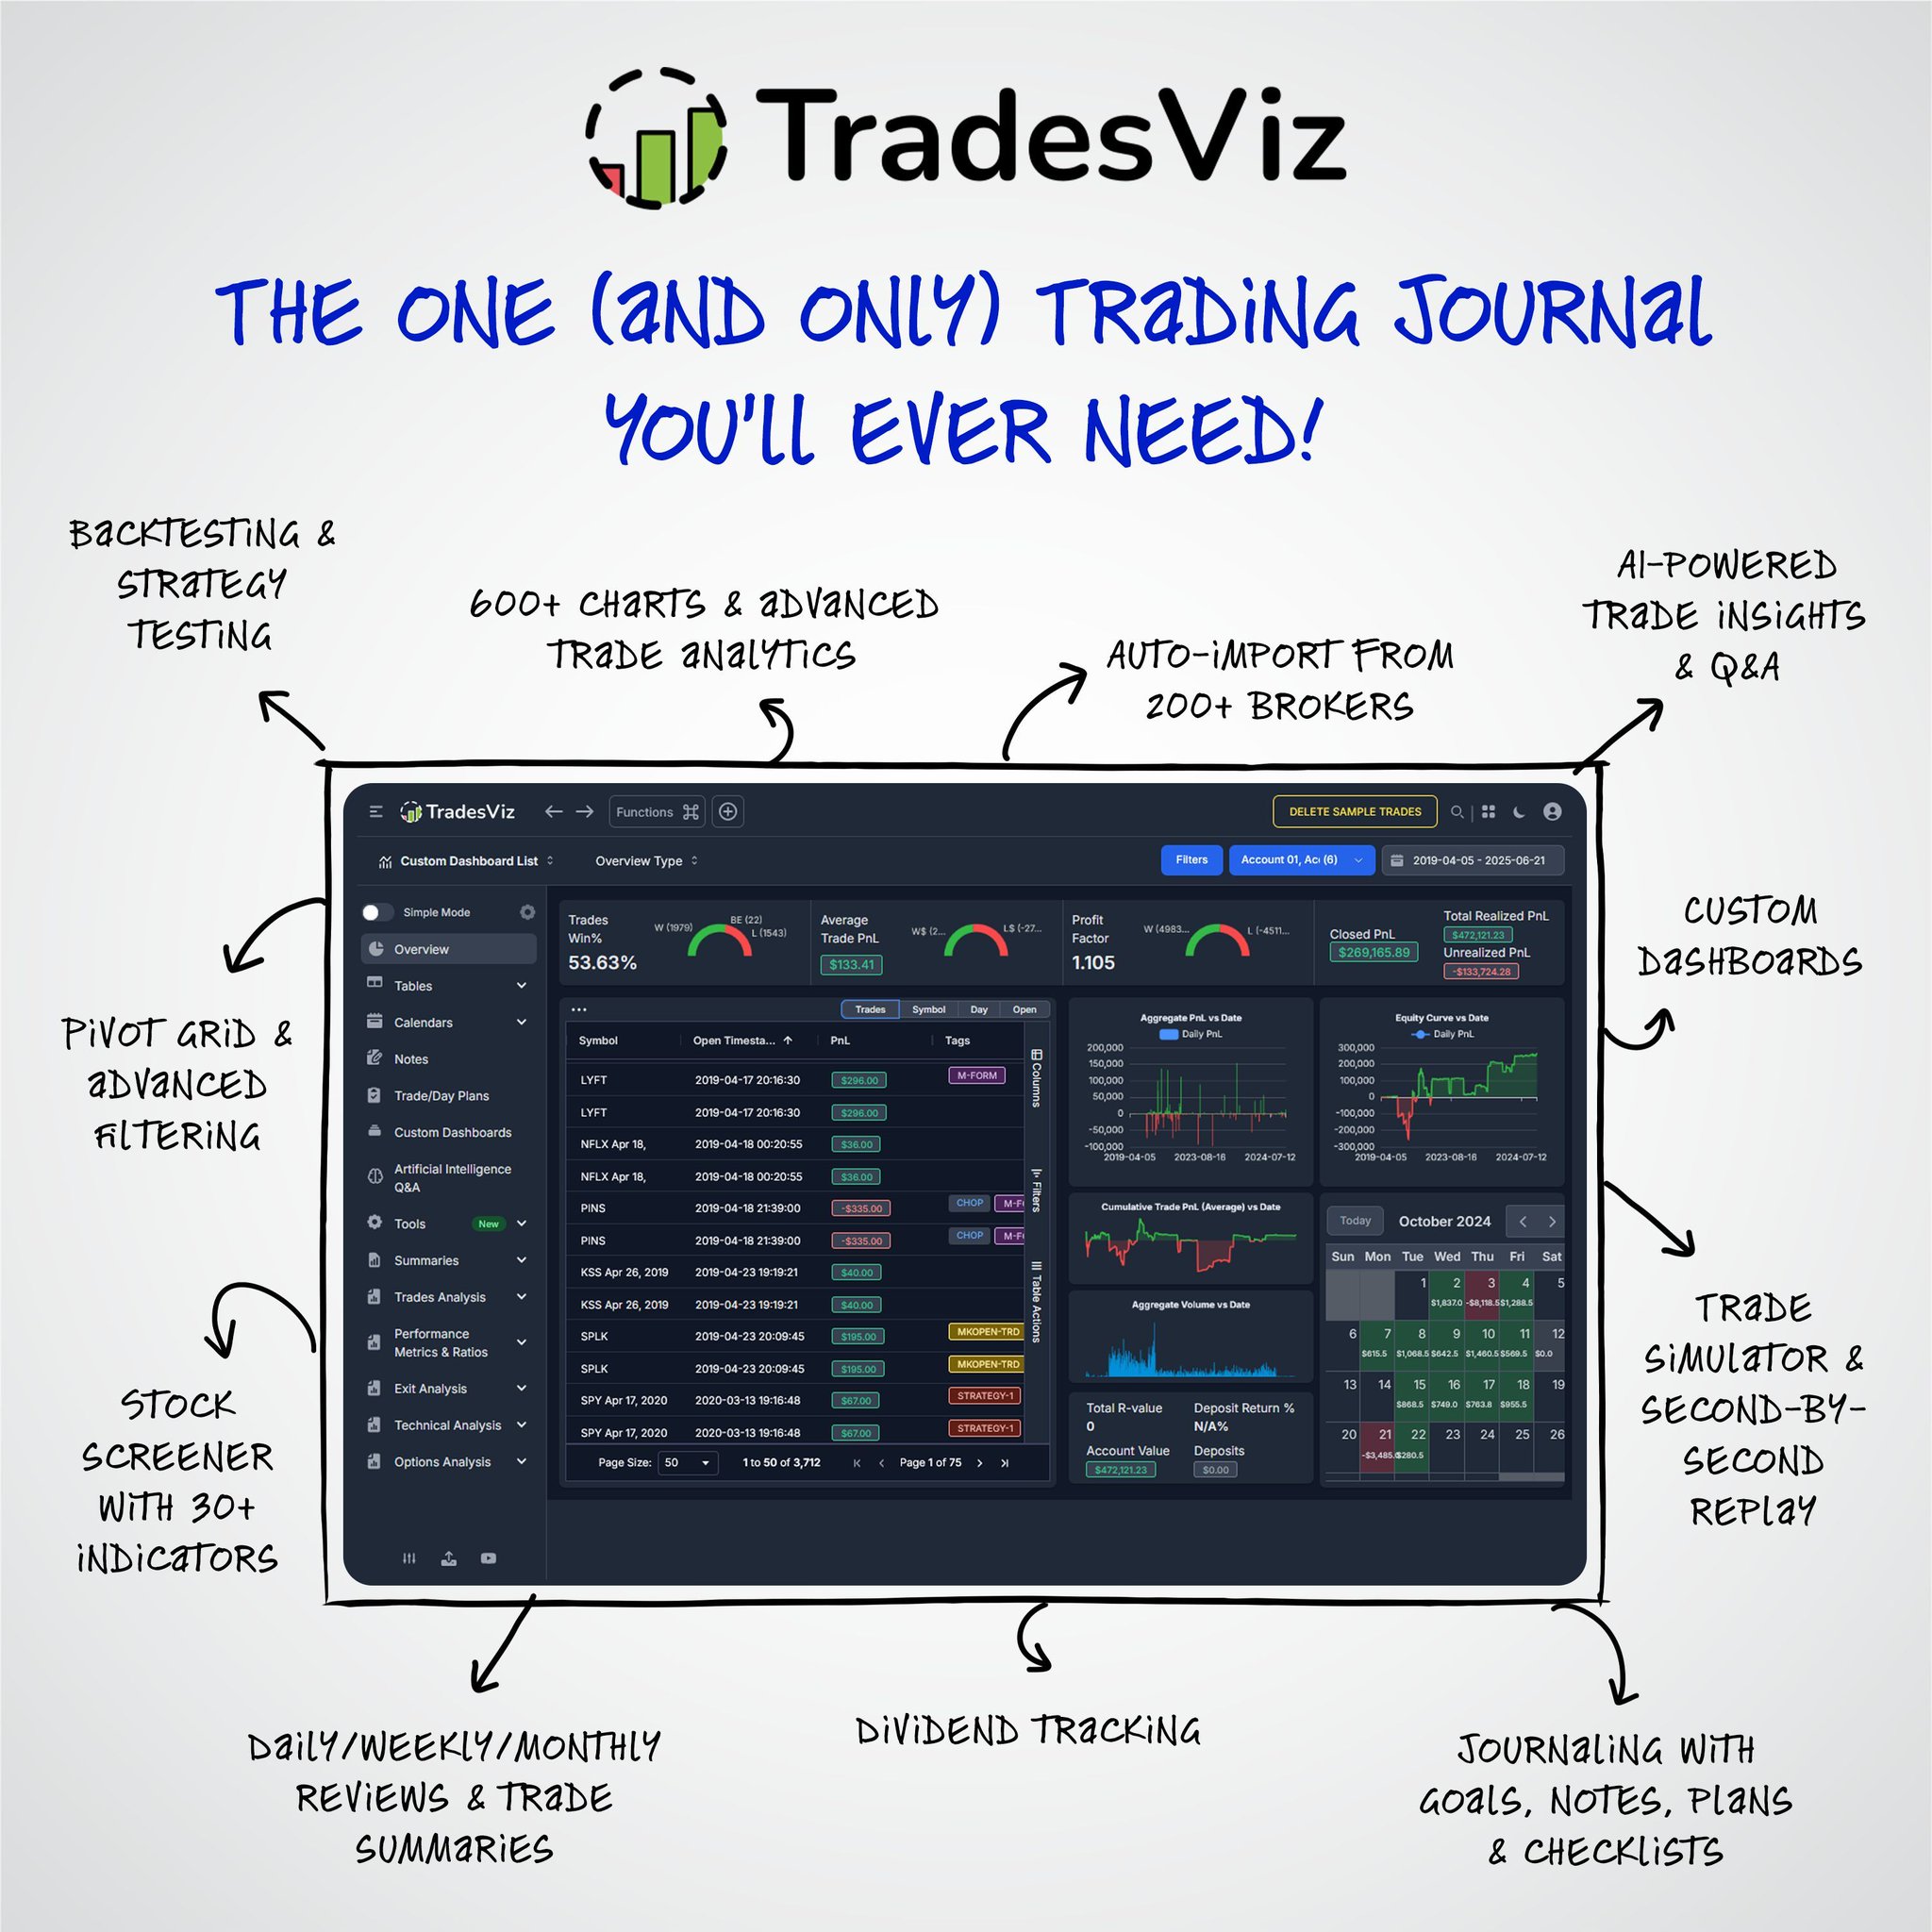
All your trading tools in one powerful platform — and then some. TradesViz isn't just a trading journal. It's your strategy lab, analytics hub, and real-time simulator in one. From automated broker imports and 600+ charts to AI insights, backtesting, journaling, and dividend tracking — it’s built for serious traders. Customize every corner. Track every angle. Sharpen your edge. This really is the one (and only) trading journal you’ll ever need.

User-posted image
View original post
TradesViz

TradesViz

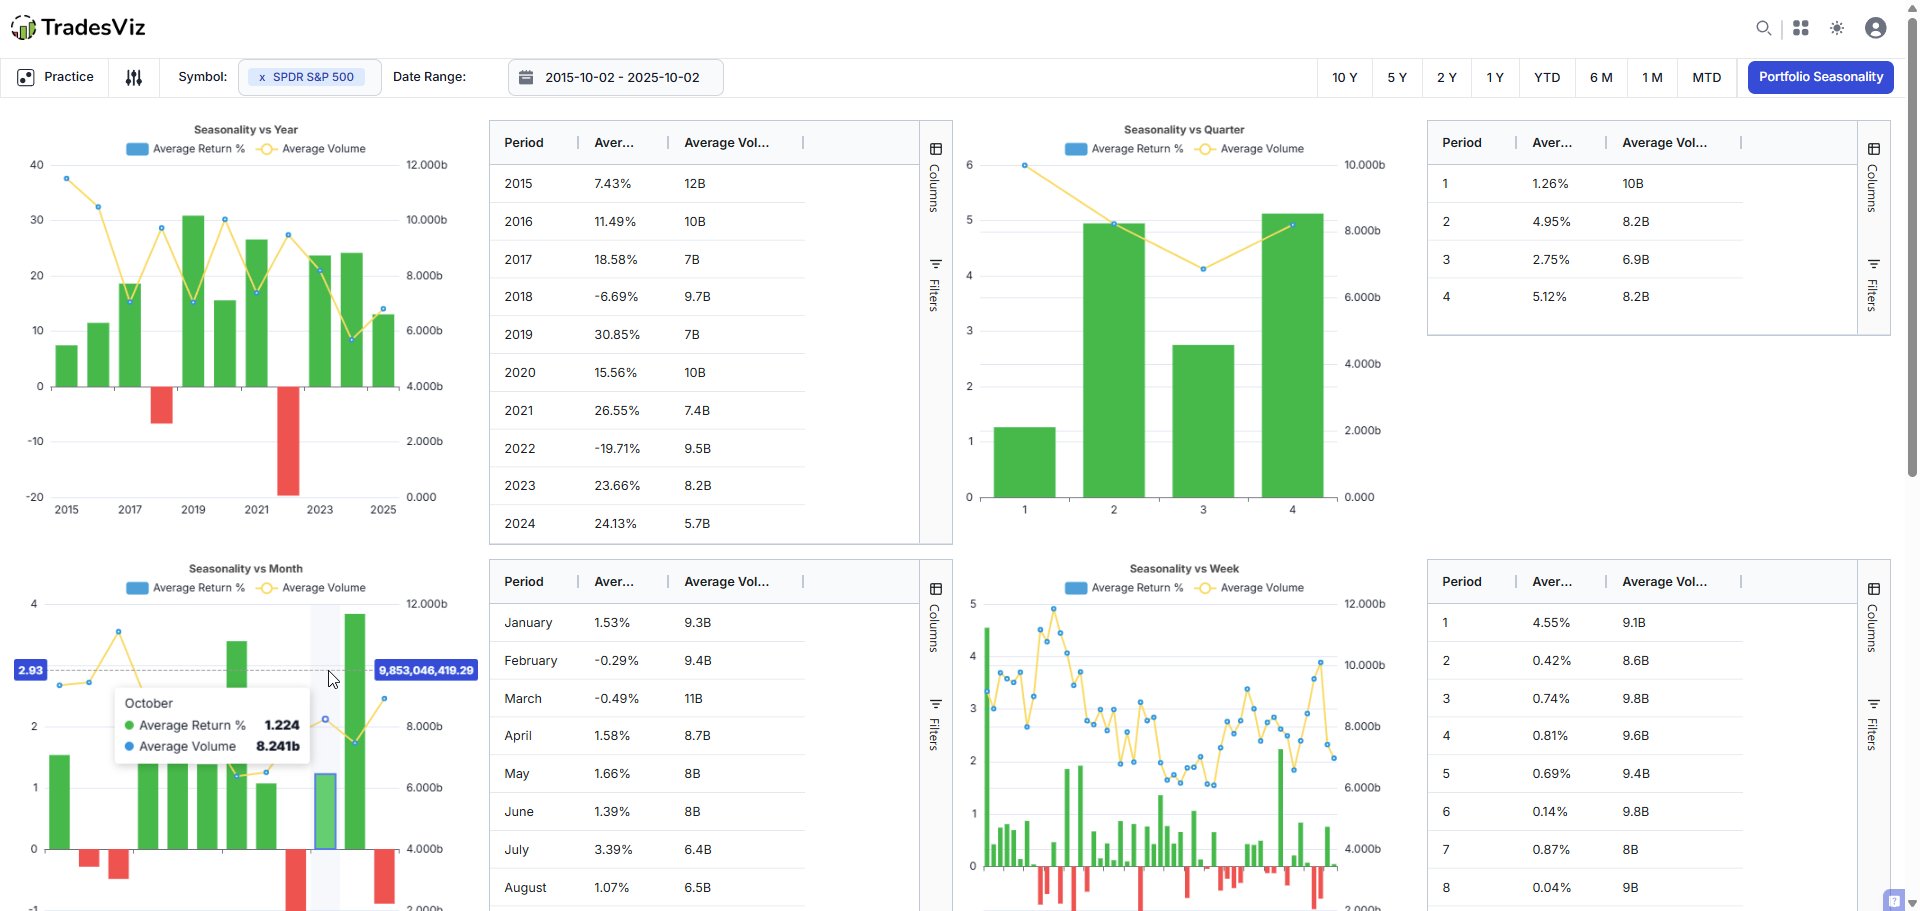
Timing matters — and seasonality helps you get it right. The Seasonality feature on TradesViz shows average returns and volume trends by year, quarter, month, and week. Easily spot high-performing periods and avoid historically weak zones. Great for refining entries, exits, and aligning your trades with the market's rhythm. Let data reveal when your setups perform best — and plan with confidence.

User-posted image
View original post
TradesViz

TradesViz

Layer by layer, Step by Step: More useful insights & planning ahead Let's start getting real. Most useful insights don't come from just pnl - they come from a combination of your inputs, advanced stats, and all of it together. Toggle off the "Simple mode" and start checking the tabs under Performance Metrics and Ratios. You may see a bunch of stats you've probably not heard of if you are a new trader. Don't fret. Don't worry. These are easy to understand, common metrics. Trade expectancy: (Average winning amount x Win ratio) - (Average losing amount x Loss ratio) R-value: Total PnL/Total risk taken (based on stop loss that you have for a trade). Hit Ratio: (No. of wins)/(No. of wins + No. of losses) Profit Factor: Total profit/absolute value of total loss

View original post
TradesViz

TradesViz

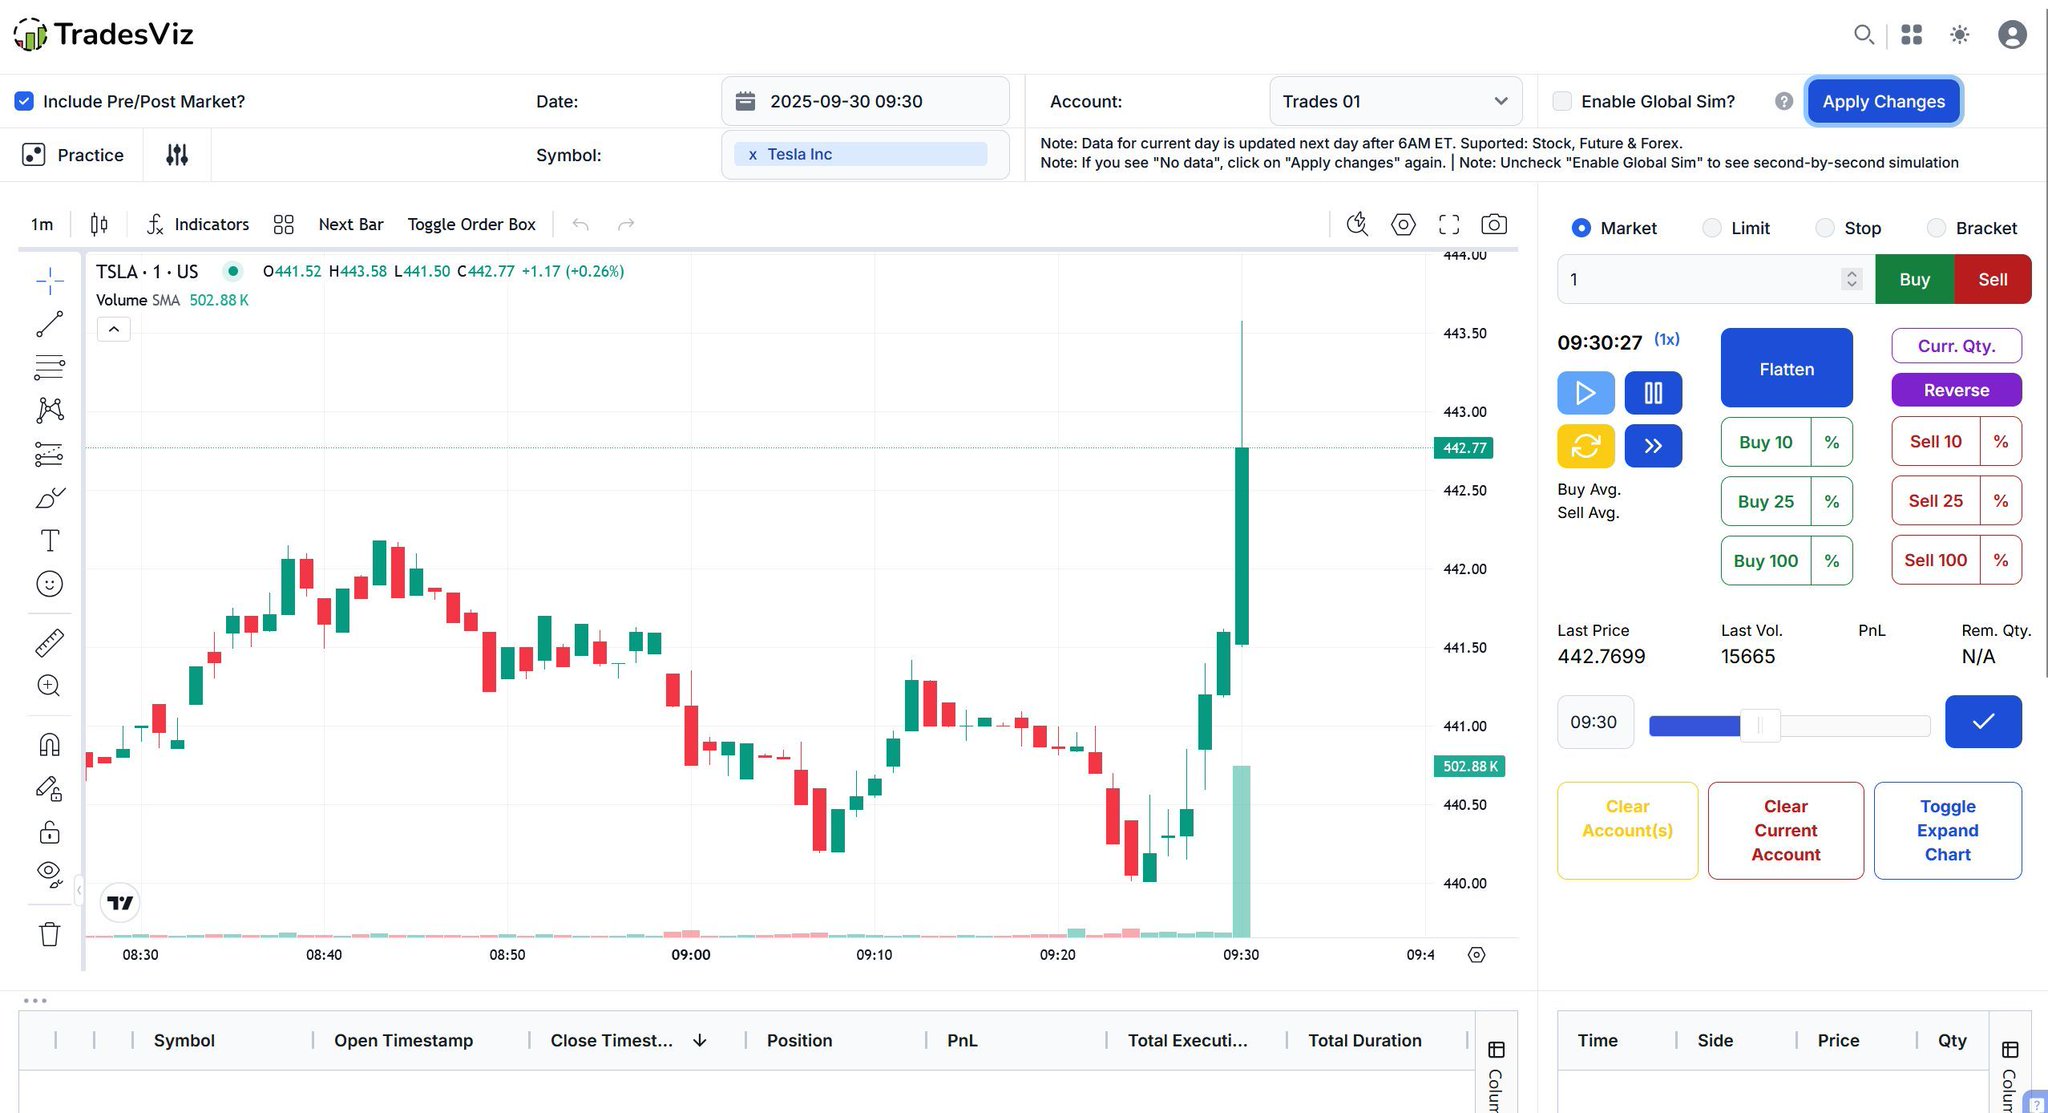
Practice your setups. Test your reactions. Build real confidence — risk-free. The Trading Simulator in TradesViz lets you replay real market data second-by-second and execute trades like it's live. Simulate order types, adjust position sizing, and refine your timing across any symbol you choose. Perfect for weekend drills or sharpening before market open. Train like a pro. Trade like one too.

User-posted image
View original post
TradesViz

TradesViz

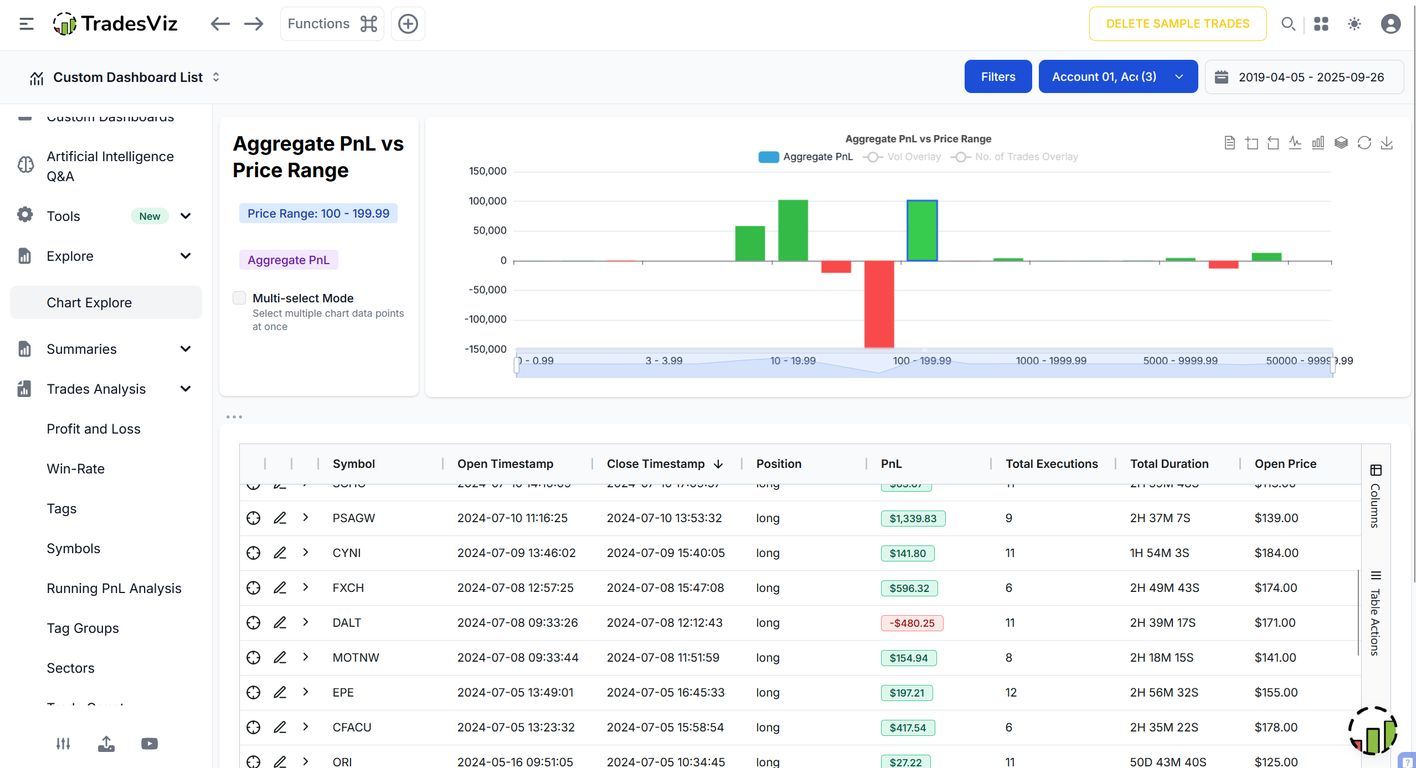
Your data is more than just numbers — it’s an entry point to insight. With Chart Explore in TradesViz, you can click on any chart bar to instantly drill into the trades behind it. Go from macro to micro in one click — filter by price, volume, time, and dig deeper into what’s really driving your PnL. No more switching tabs. Just click, explore, learn. Because the answers are always behind the bars — literally.

User-posted image
View original post
TradesViz

TradesViz

Sep 2025 wrapped up! 👏 ✅ Make sure to review your trades using the day view on TradesViz trading journal - it takes a few minutes, and you get to learn: - Max drawdowns - PnL metrics - Best/worst trades - Daily summary + More! Check the example below 👇🔖

User-posted image
View original post