TradesViz

TradesViz

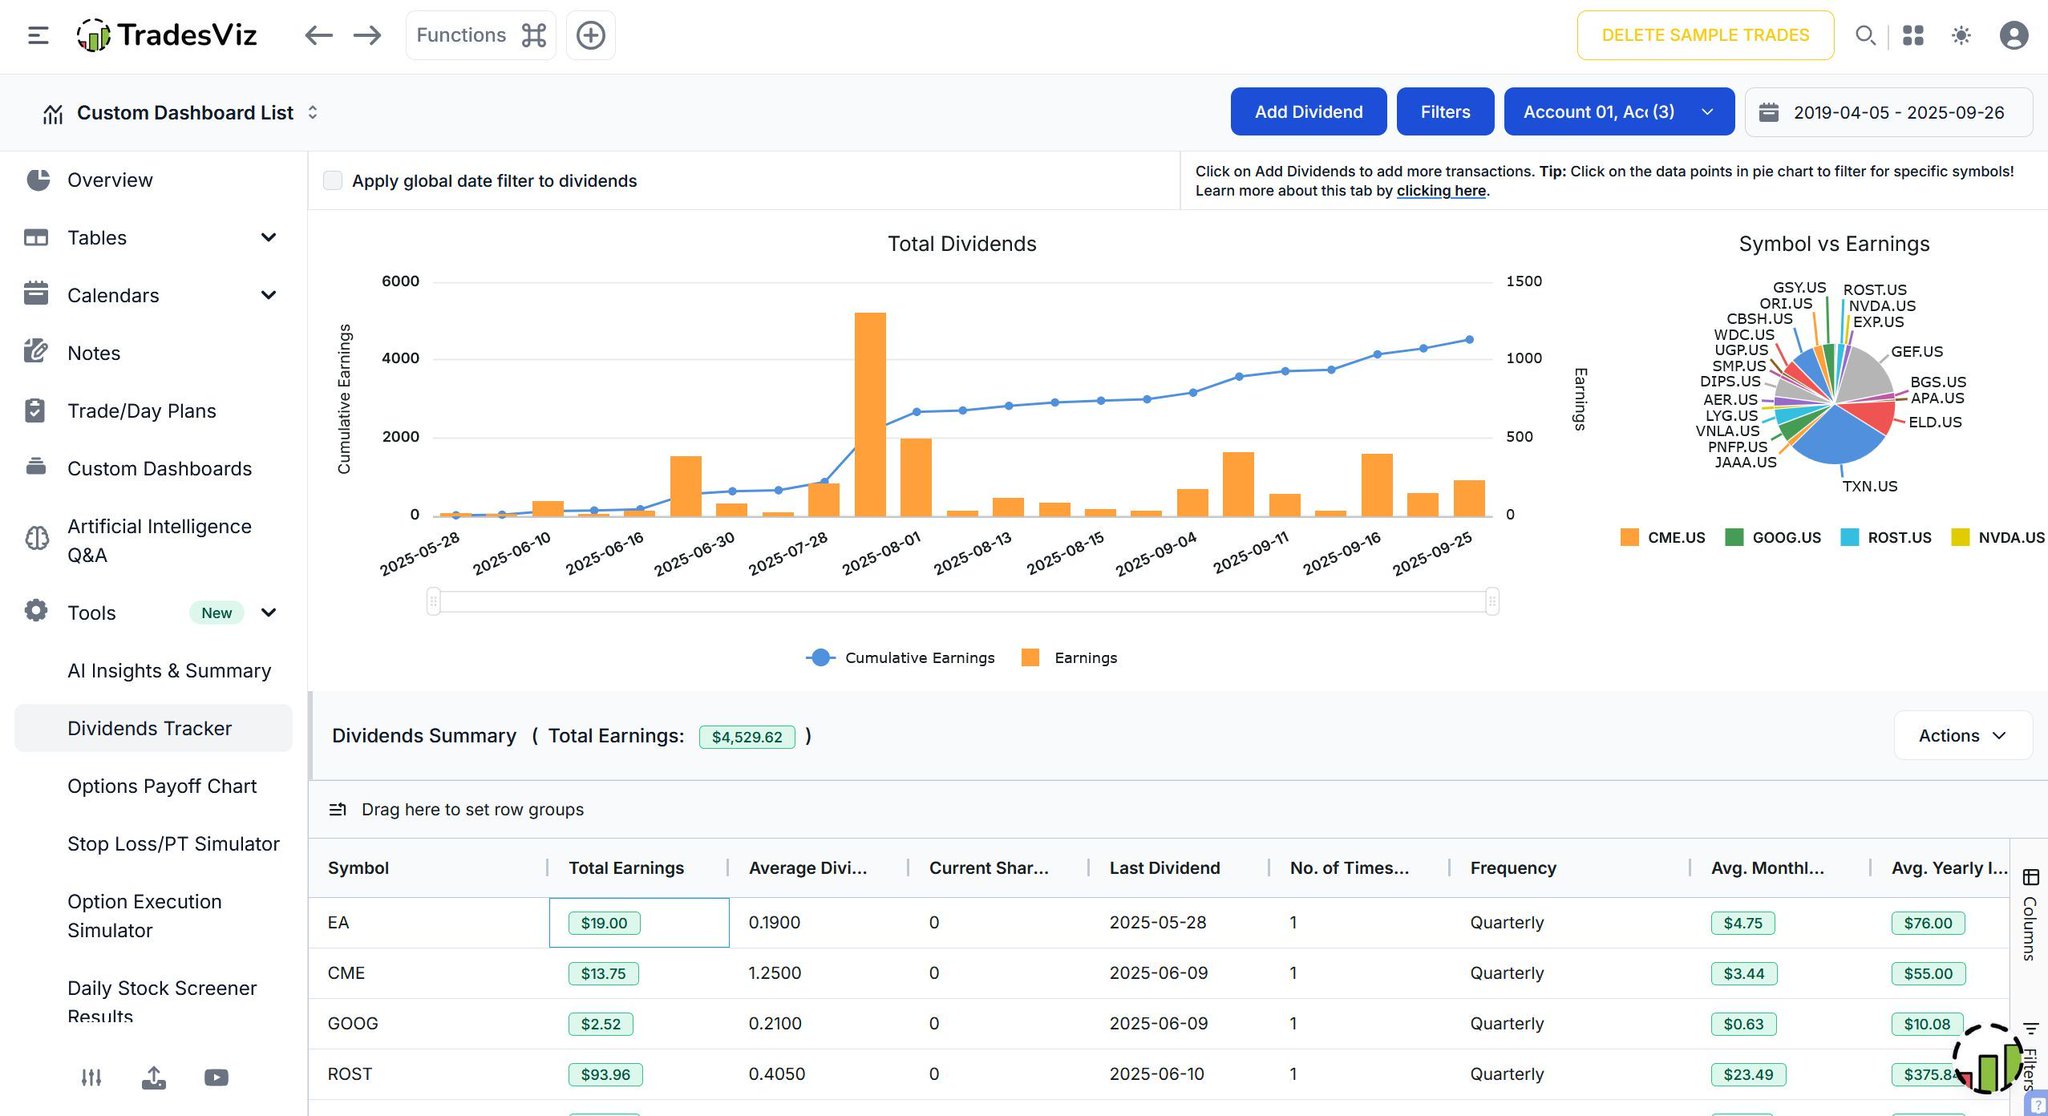
Track every payout, visualize your growth. The Dividends Tracker in TradesViz helps you monitor cumulative earnings, frequency, and income per stock with clean charts and breakdowns. See which symbols are boosting your passive returns and when the payouts hit. Simple, visual, and fully organized — because real returns aren’t just from trades.
User-posted image
View original post
TradesViz

TradesViz

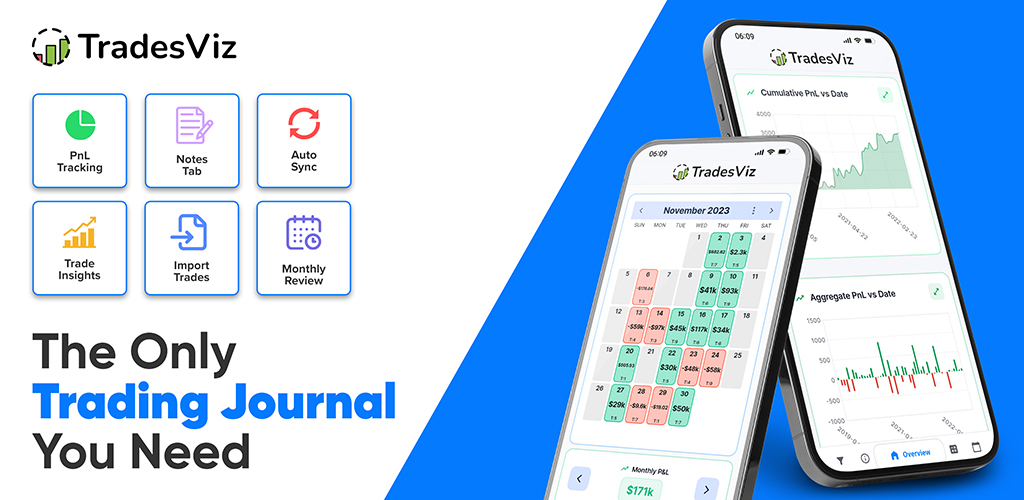
🎉 ALL-NEW TradesViz v2.0 Mobile App Launched! + Completely revamped UI + Auto-sync on the go + Import 200+ brokers + 60+ Charts/100+ Metrics + Faster dashboards + MFE/MAE metrics Out for both Android/iOS! Download for free! The best mobile trade journaling experience 👇

User-posted image
View original post
TradesViz

TradesViz

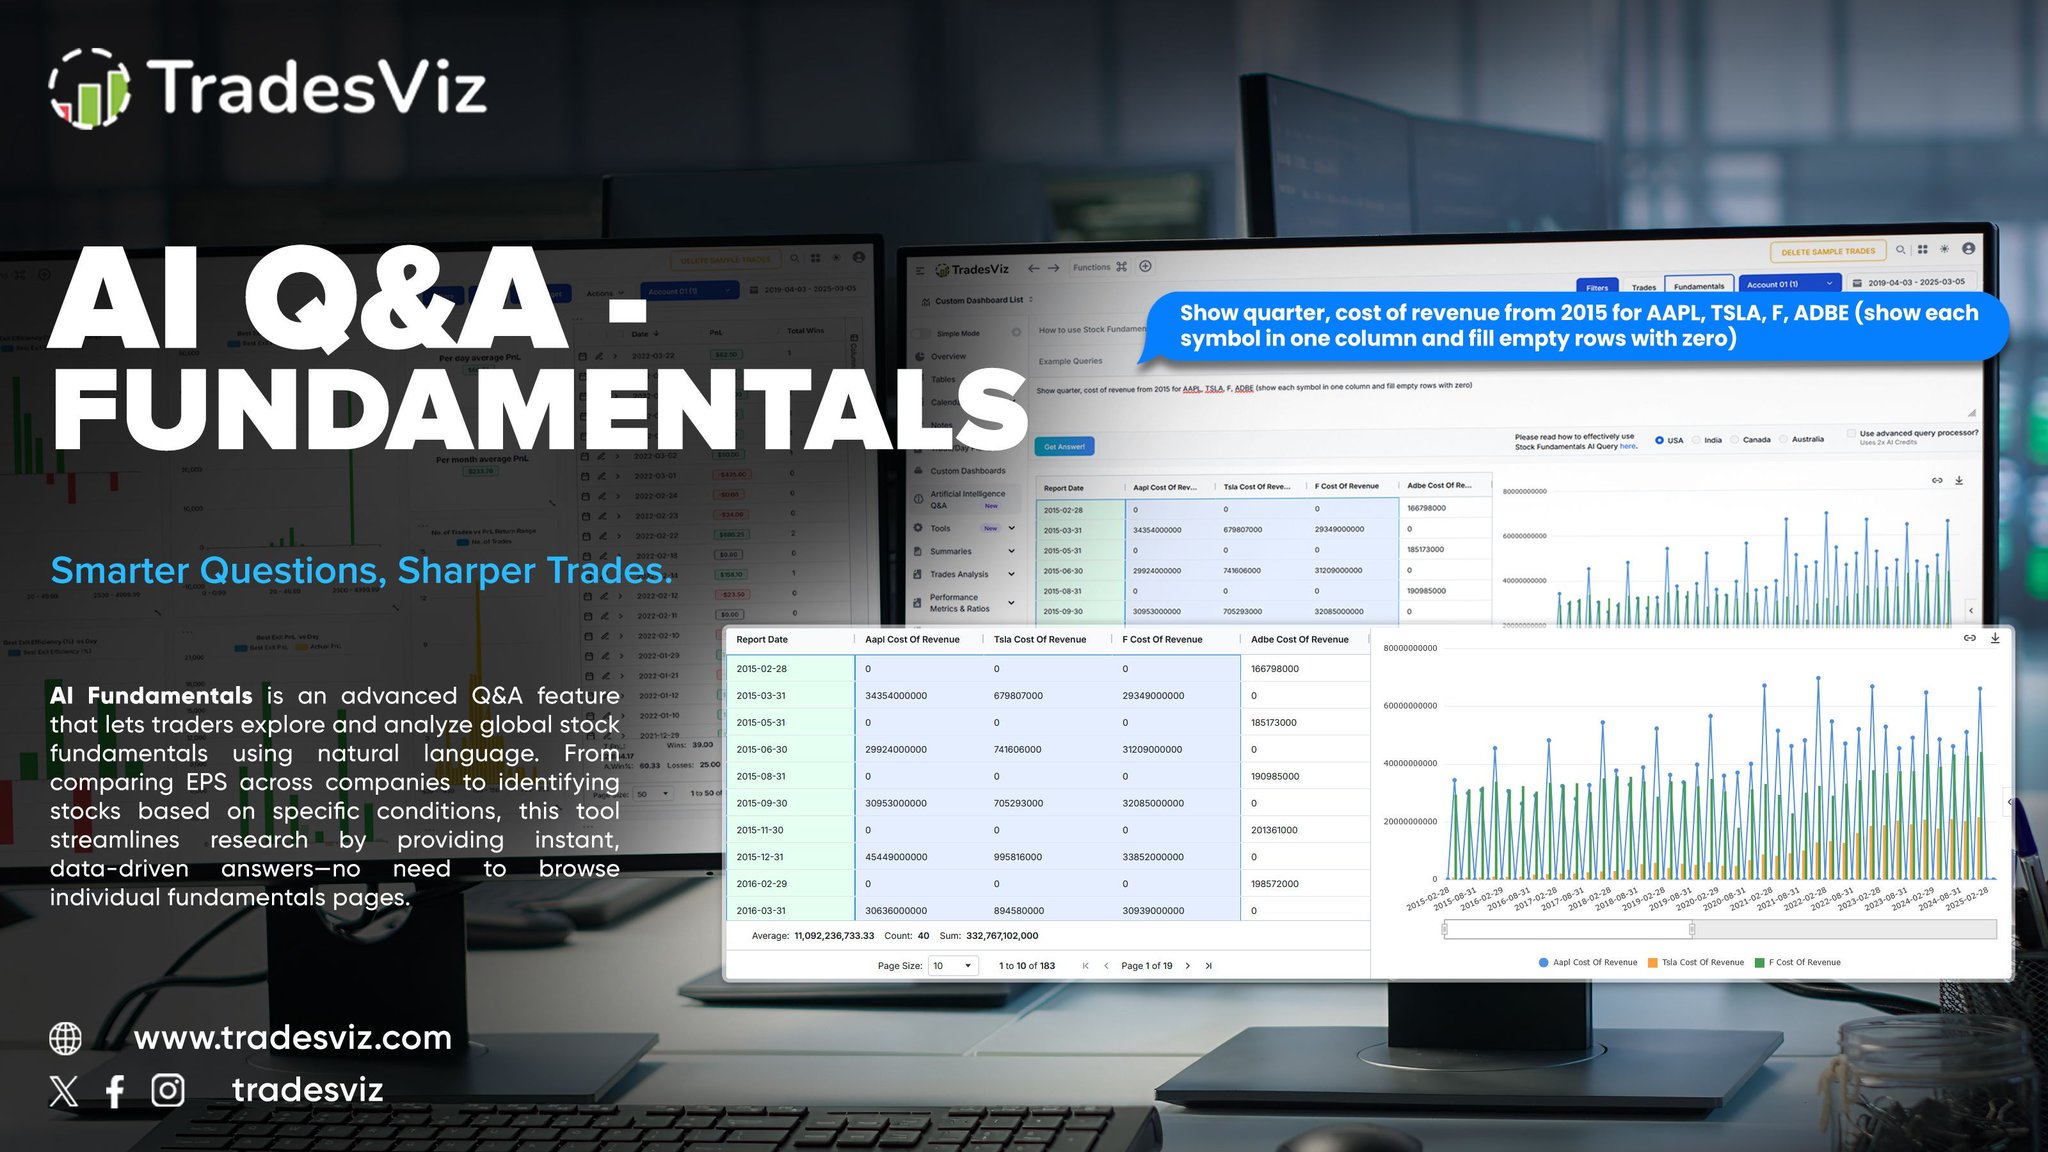
Ask smarter questions, get sharper insights — instantly. The AI Q&A – Fundamentals tool in TradesViz lets you explore stock fundamentals with natural language. Just type your query — compare EPS, revenue, margins, and more without digging through endless reports. Quick, accurate, and visual answers that save time and elevate your research. Because powerful trades start with the right data.

User-posted image
View original post
TradesViz

TradesViz

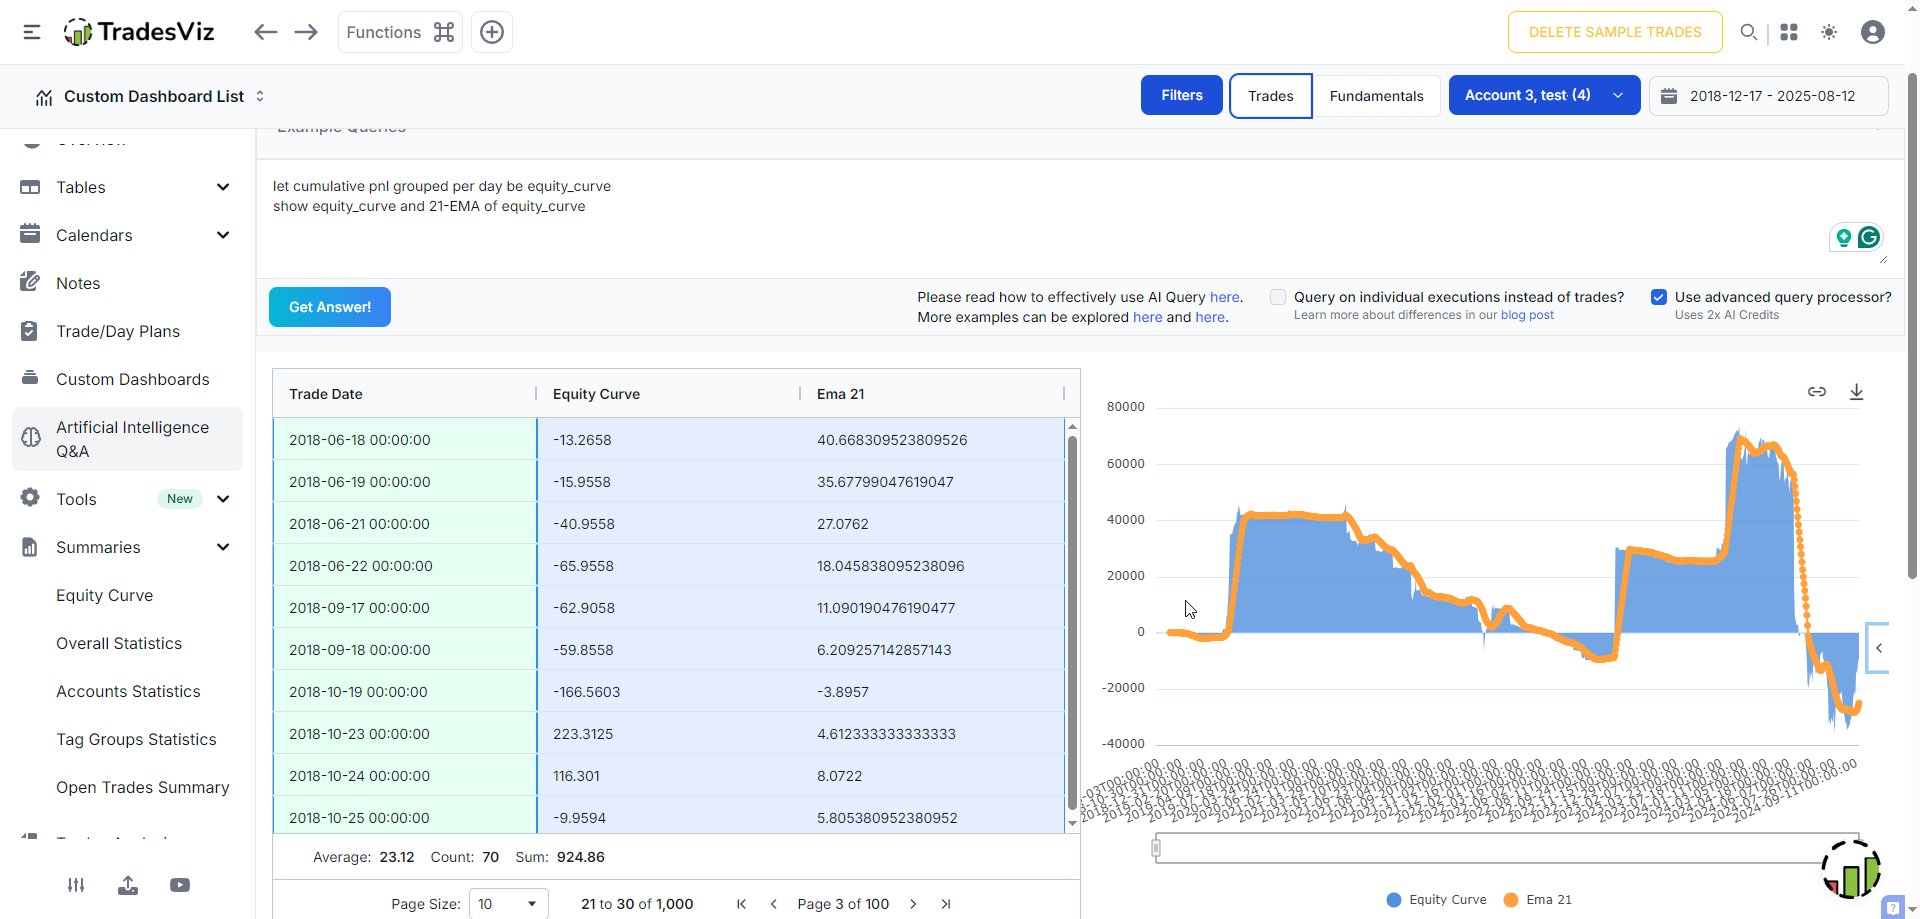
We're now seeing ENTIRE dashboards of AI query widgets on TradesViz *very* commonly. It's easy to see why: You spend time initially and craft the exact widgets/metrics you want, and TradesViz takes care of applying them for your accounts. If this level of flexibility isn't in your journal, then you are *wasting* time AND money. TradesViz is the ONLY tool with this capability and this level of flexibility. More than 50k AI queries and counting... Also, AI model update soon!

User-posted image
View original post
TradesViz

TradesViz

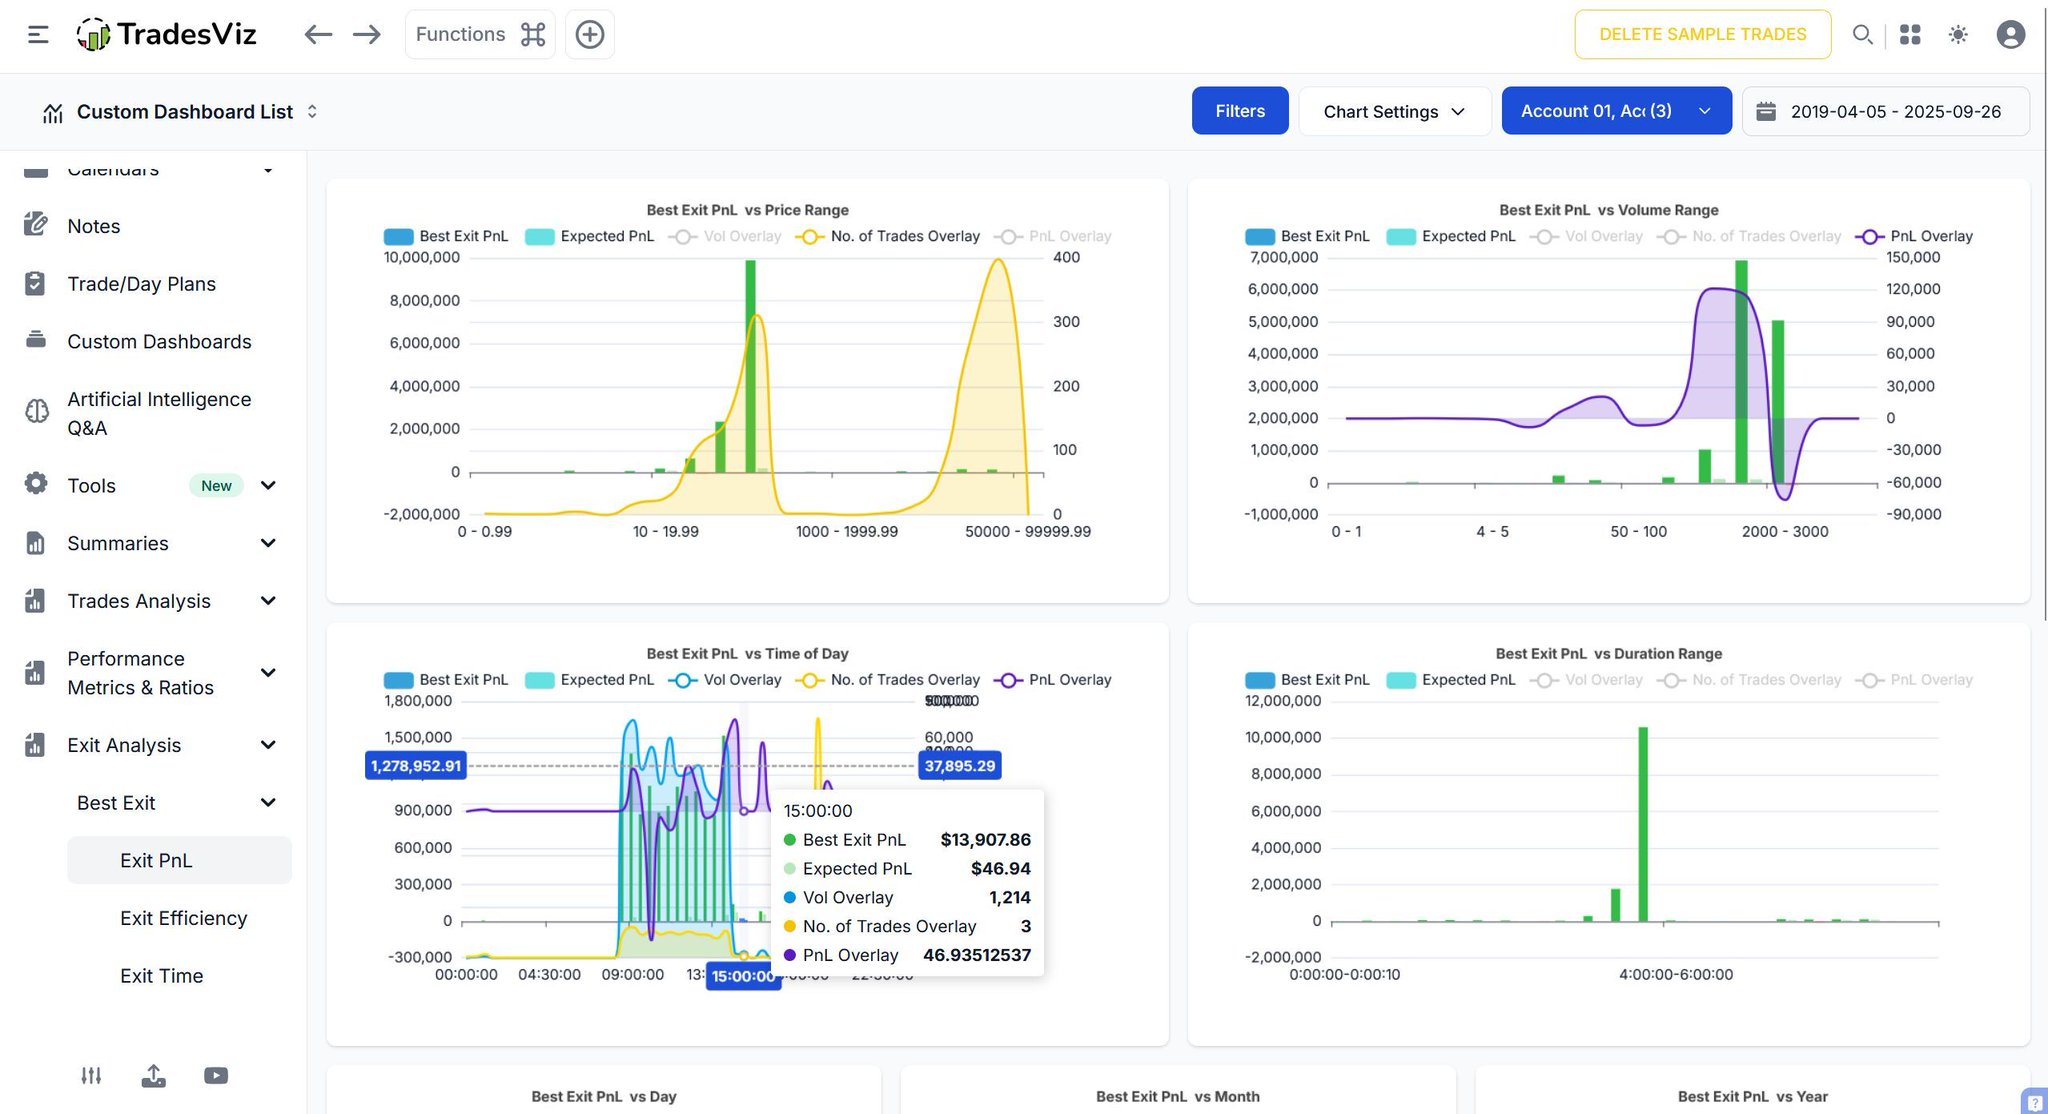
Exits make or break your trade — are yours helping or hurting? The Exit Analysis tab in TradesViz breaks down how well you’re closing trades using detailed metrics like exit timing, price efficiency, and potential PnL missed. Visualize every exit mistake and perfect the art of walking away at the right time. Stop leaving profits on the table — start mastering your exits with insightful data.

User-posted image
View original post
TradesViz

TradesViz

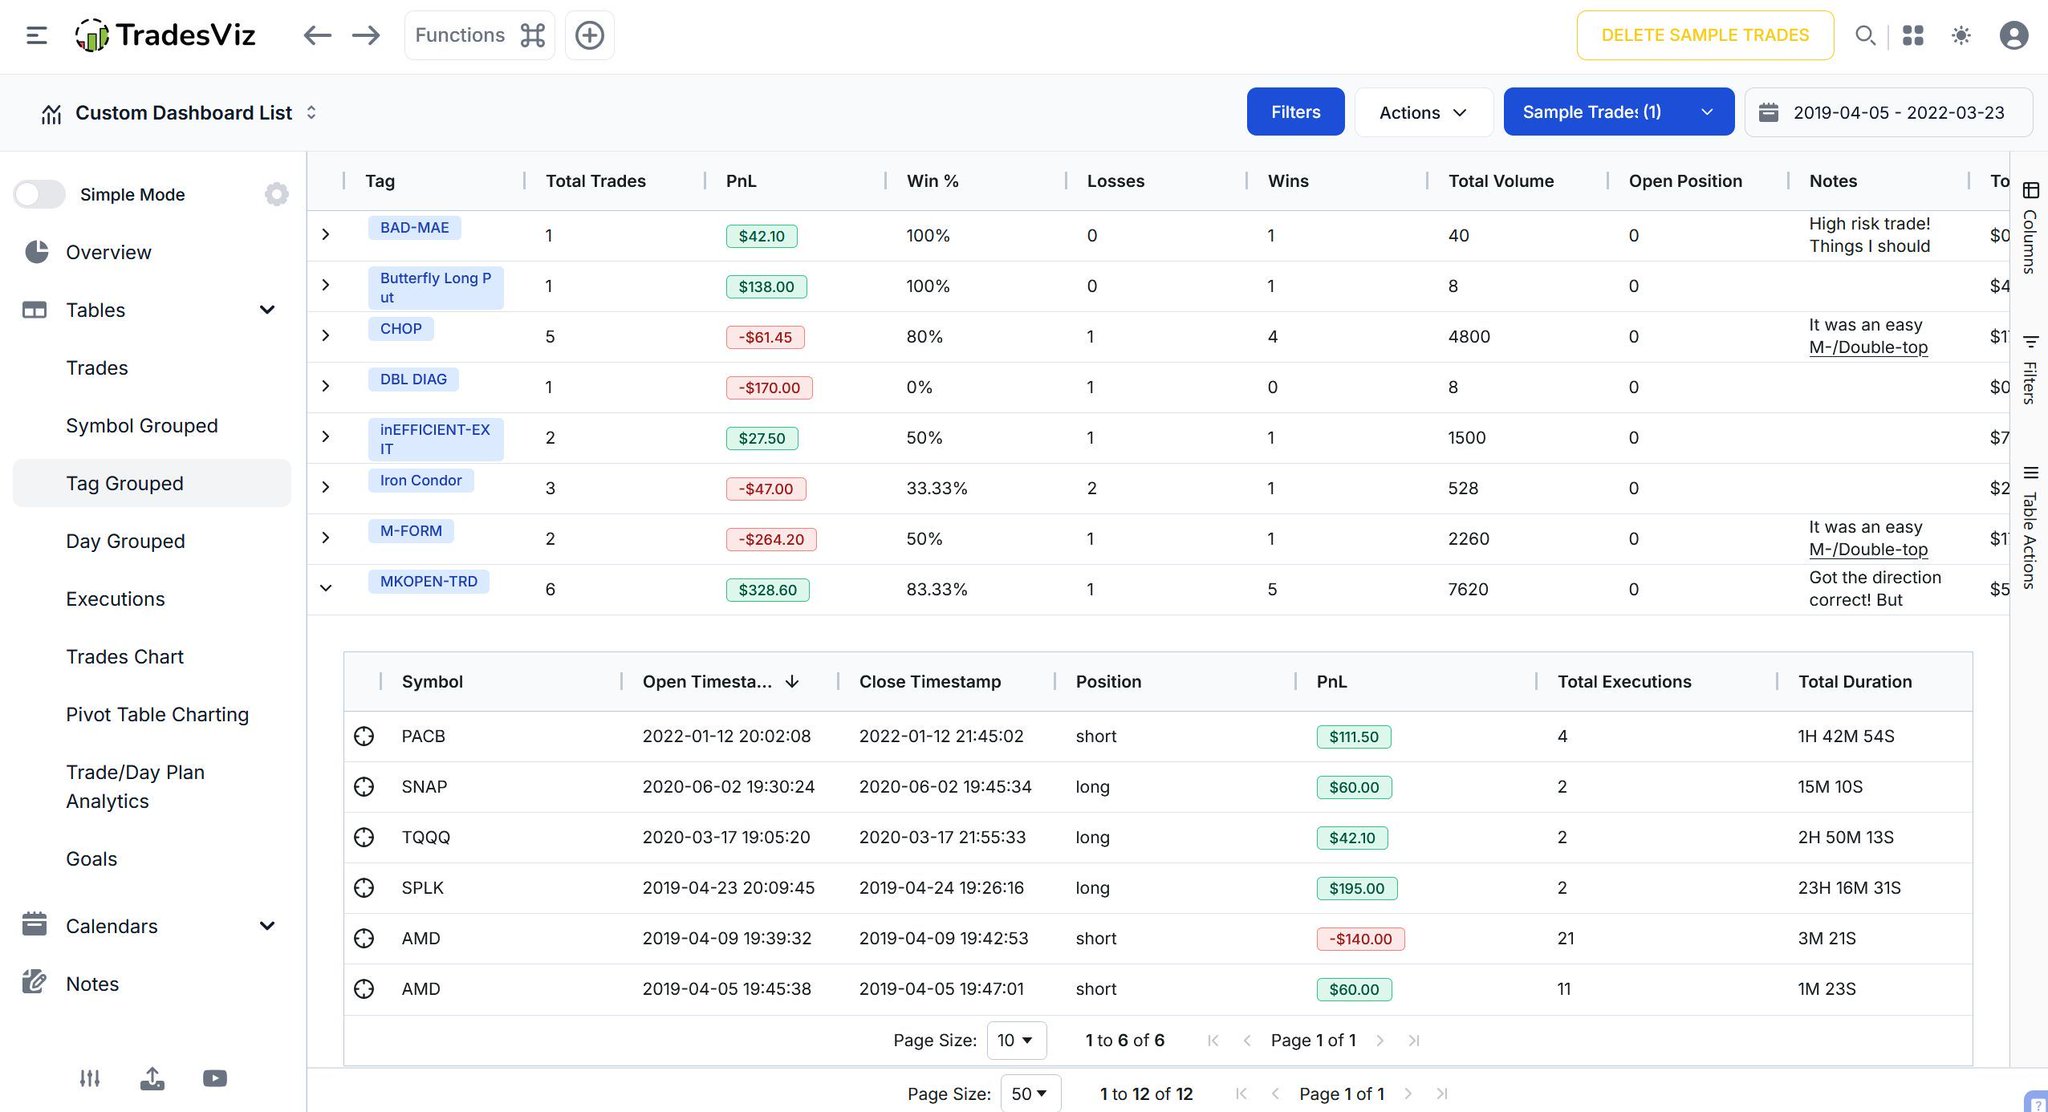
Turn patterns into insights with Tag Grouped Tables on TradesViz. Group your trades by strategy, setup, or outcome tags and instantly view PnL, win rate, volume, and performance. Compare how each tag performs over time — what’s working, what’s dragging your edge. Drill into trades directly, link notes, and refine with purpose. Your trading style isn’t random — this is how you make it measurable.

User-posted image
View original post
TradesViz

TradesViz

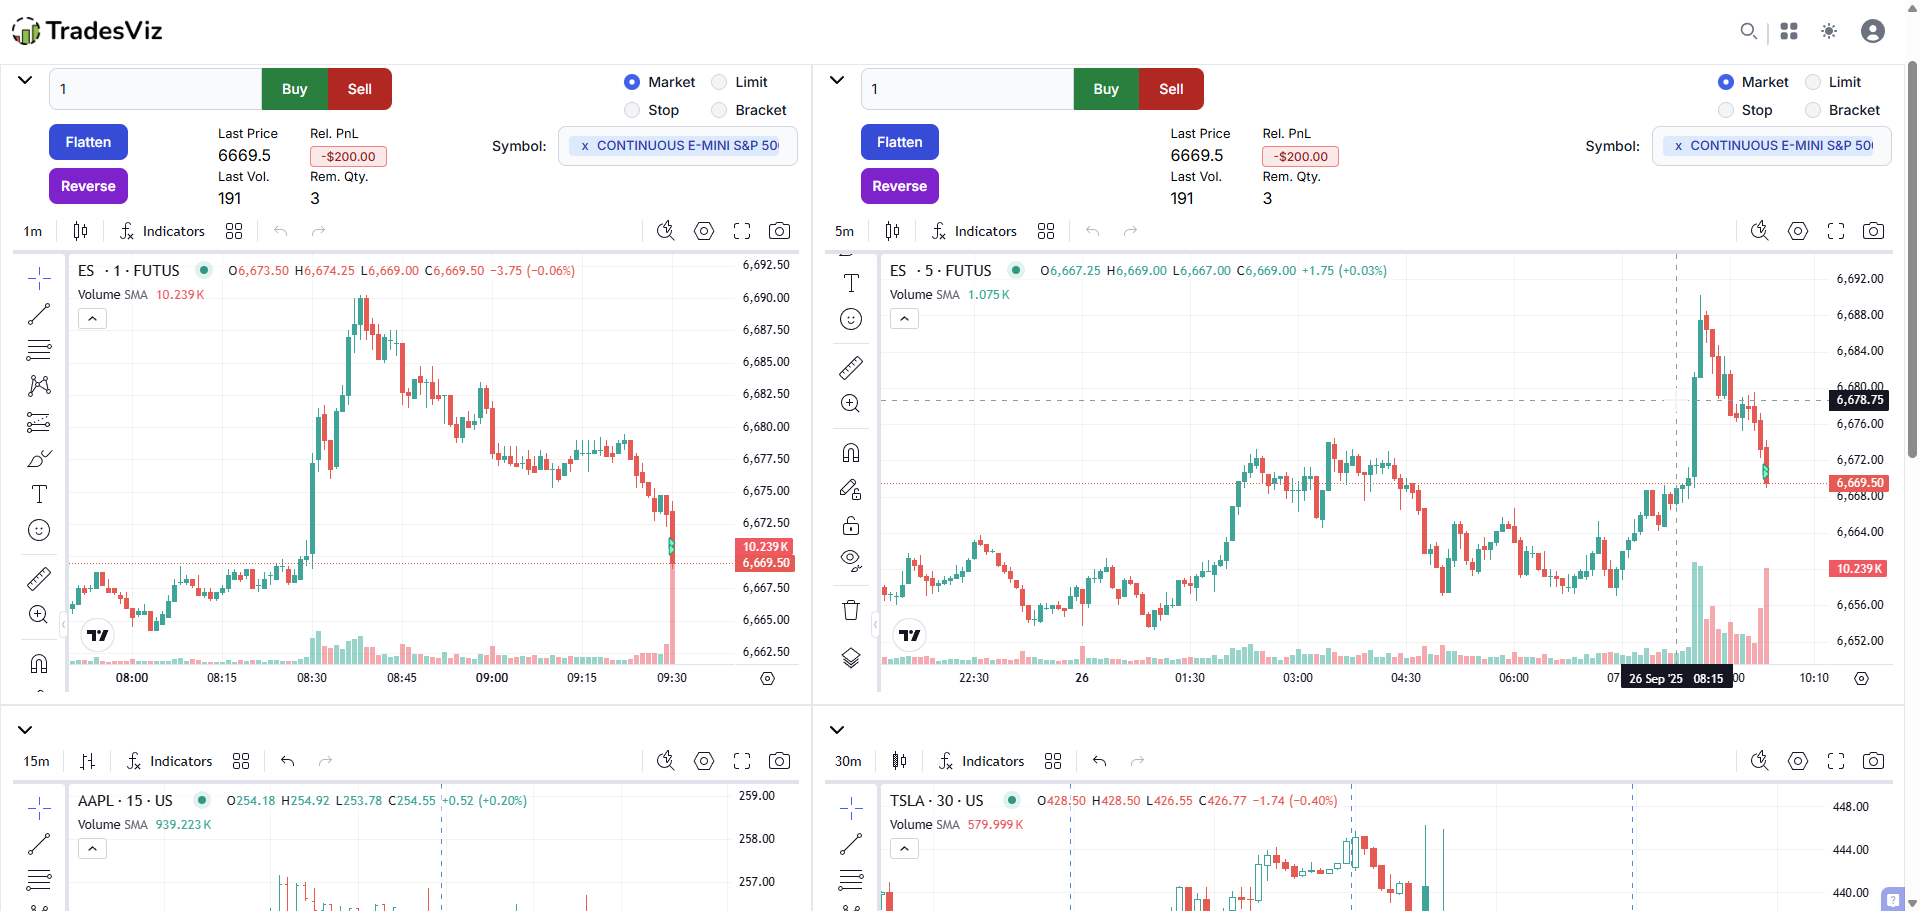
Did you know you can simulate 4x UNIUQE symbols on ANY timeframe in TradesViz's multi-simulator? Stock, future, forex - tens of thousands of symbols supported! Journal + Simulator + Backtest/Replay + AI It's all part of TradesViz platform 👇

User-posted image
View original post
TradesViz

TradesViz

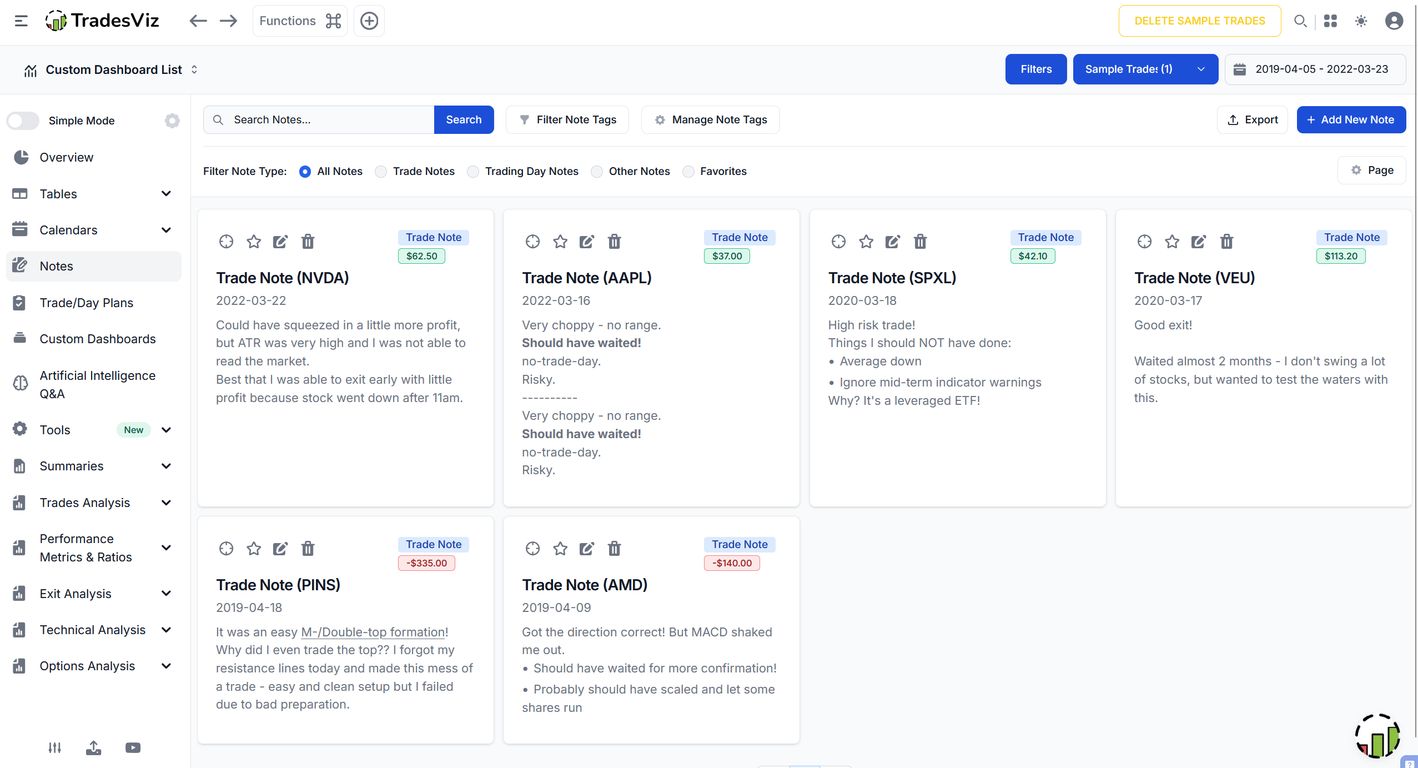
Every trade has a lesson — capture it before it fades. With Notes in TradesViz, you can log thoughts, mistakes, mindset, and setups tied directly to each trade. Tag, search, and filter to revisit key moments and refine your process over time. Wins or losses, they mean more when you reflect. This is how you build self-awareness — and real trading growth.

User-posted image
View original post
TradesViz

TradesViz

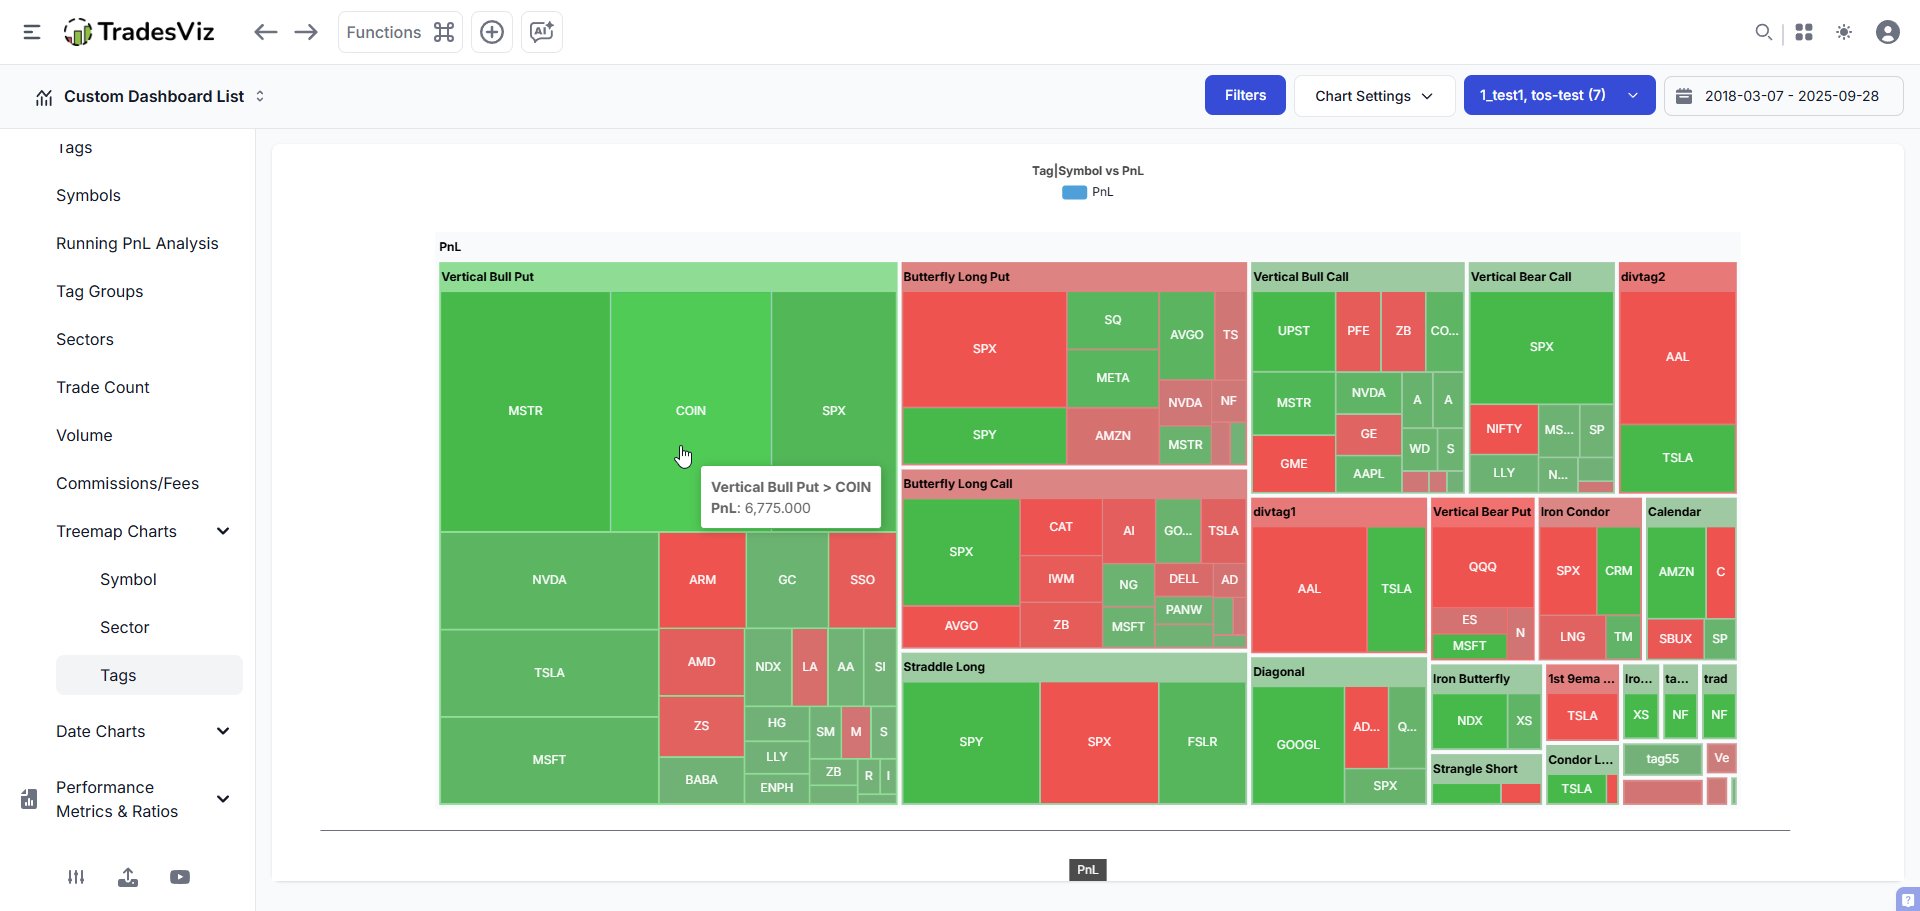
Options, tags, sectors, symbols - the best way to visualize and compare quantity/pnl and the relative size of these metrics is to use a Treemap! Along with pre-built treemaps, TradesViz now has a custom treemap function for ALL grids using the recent chart update! 📊

User-posted image
View original post
TradesViz

TradesViz

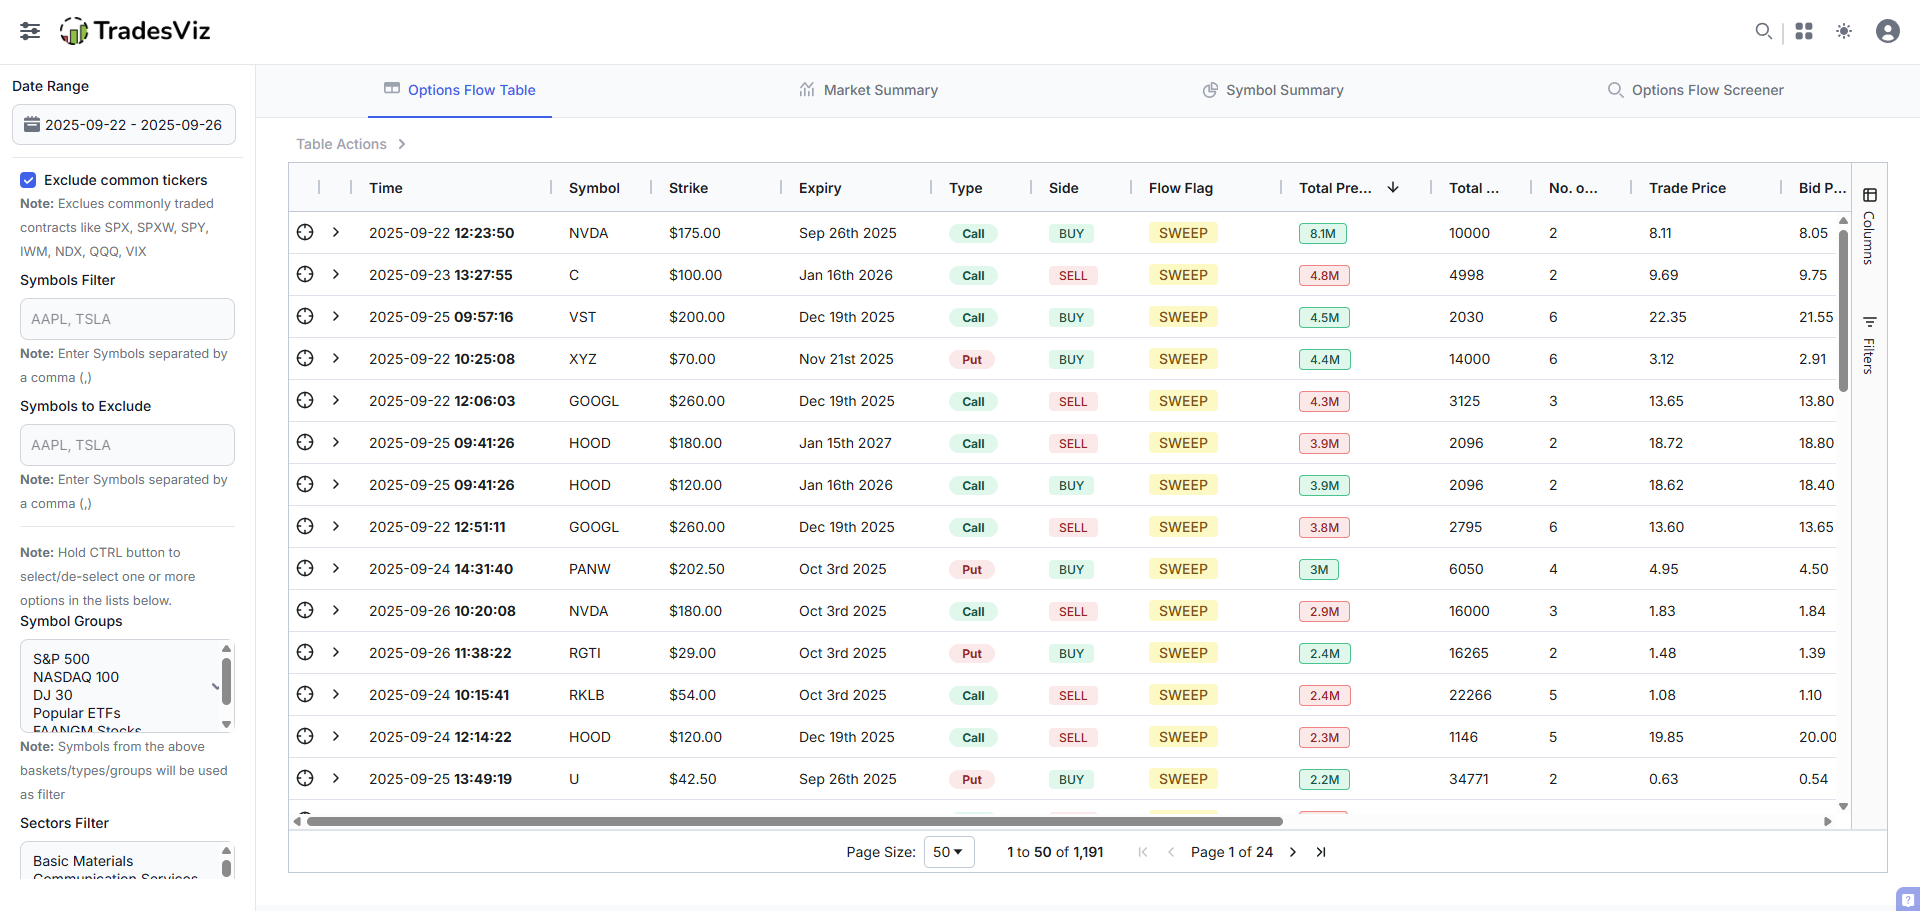
Most impactful options flow from the entire last week 🌊 $HOOD  $C  $VST  $GOOGL  $PANW  $NVDA + more! Check the options flow tab on TradesViz trading journal every day to get a detailed overview of what is happening every day on the options market! 🔍

User-posted image
View original post