The options flow for December 21, 2025 shows concentrated institutional activity mainly in $NVDA and $TSLA, with multiple large call sweeps and splits indicating strong positioning in both names ahead of early 2026 expirations.
$NVDA dominated the tape with repeated call sweeps around the $50 strike expiring January 16, 2026. The largest included several 38M sell and buy sweeps between the $49.50 and $50.50 strikes, each with 2815 contracts traded, suggesting active profit taking and re-hedging near short term price levels. Additional $NVDA call buy sweeps worth 29M at the same expiration indicate ongoing bullish interest.
$TSLA followed closely with large trades at the $440 strike expiring December 26, 2025. These included a 16M call buy split and a 12M trade at similar strikes, together signaling short-term bullish bets on continued strength. Another 7.7M sweep at the same strike reinforced active sentiment going into expiration week.
Smaller but meaningful flows appeared across other names including $DJX with a 7.6M call buy sweep at the $400 strike expiring December 15, 2028, $XBI with a 6.6M call sell sweep, $NEM at 5.8M, and $IBIT with a 5.7M call buy sweep. $GLD featured two moderate sell splits of 5.8M and 4.9M, showing mild rotation within commodities.
The one that got away.... 🥹
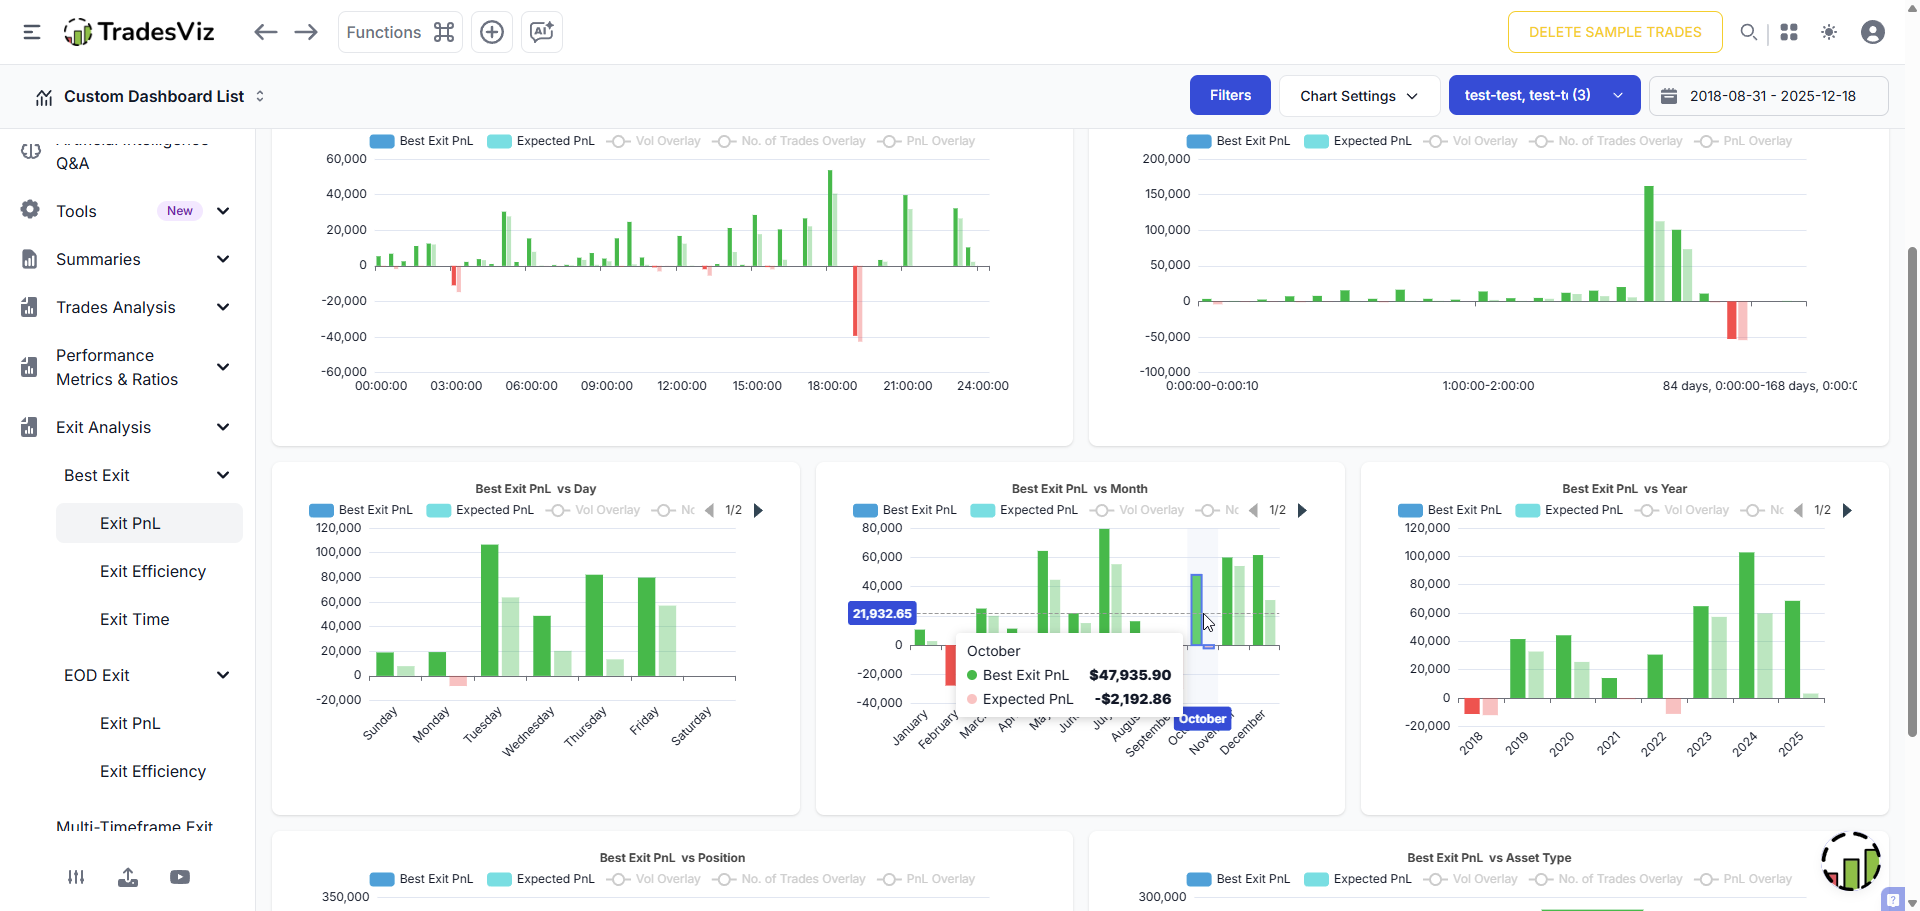
It's time to review those trades that you wish you had added to, and you wish you had cut sooner.
How do you even find these?
1. Check the best exit pnl per month
2. Check trades with the worst running pnl
This is 2 clicks on TradesViz.
The easiest way to review 12 months of trading?
One click on TradesViz. 🖱️
Our Year-End Trading Summary (heatmap/pivot/AI) generates a complete audit of your performance instantly.
✅ Identify winning & losing streaks. ✅ Drill down from Yearly ➡️ Monthly ➡️ Weekly views in seconds.
✅ Review daily notes and context without searching.
Don't end the year in the dark.
Get your automated report today on TradesViz.
Start a trial and just *try* :)
You can check the dividends, visualize per-sector, industry, and symbol in TradesViz.
TradesViz is the only trading journal with auto dividends support, along with advanced trade analytics.
2026 is going to bring a LOT MORE to the platform 😋
Oh.. we're not done for 2025 yet.
50% TOTAL OFF EVERYTHING. 🎅
Stop paying for separate apps. TradesViz combines:
✅Advanced Journaling
✅Trading Simulator
✅Options Analysis/Flow
✅AI Analytics
✅ Notetaking + Planning
😁 Get the All-in-One solution for half off this Christmas.
🎟️ Use Code: TVNEWYEAR26
🌊 Summary of options flow from the previous week.
🤔 Large flow from early last week still dominates when we plot all data together.
$EEM $NVDA $TSM $IBIT + more
Will we see a slowdown this week?
Also check the top flow from last 2 market days below 👇
🎟️TVNEWYEAR26:OFFER
"What if I used a tighter stop?" "What if I aimed for 2R instead of 1R?"
Stop guessing. Start using TradesViz Risk Simulator to SEE THIS.
This is the Stop Loss/PT Simulator on TradesViz.
Left Side (Original): -$1,600 Loss. 📉
Right Side (Simulated): +$8,775 Profit (using new SL/TP rules). 📈
The trade entries were the same. The management was different.
Test your rules on historical data before you risk real money on them!
Focus on setting your dashboard to show you what you want to see and what matters to you.
No journal offers this.
TradesViz's 100% custom dashboard uses simple drag and drop widgets that are, again, 100% custom and can be defined by you using AI.
Here's an example 👇
TradesViz stock of the day: $AGCO - AGCO Corporation
AGCO Corporation manufactures and distributes agricultural equipment and replacement parts worldwide.
Check the practice mode 🎲 on the Fundamentals page on TradesViz. This is free and learn a lot about companies!
This is the best way to test and learn options strategies.
Combine the options execution simulator with payoff charts to get a better understanding of options pricing and risk.
This is all possible only on TradesViz trading journal.
🎟️TVNEWYEAR26: 25% + 30% off!TradesViz | Trading Performance Analysis (@tradesviz)Ever wanted to test an option spread before putting real money on the line? 💡
The Options Execution Simulator in TradesViz lets you build and simulate multi‑leg strategies in seconds.
Mix calls, puts, expiries, and strikes, hit Simulate Order, and instantly see how your payoff curve changes with price moves.
It’s a clean, data‑driven way to experiment safely and refine your setups before execution.
Your strategy ideas deserve a test drive before they hit the market.—