Your subscription is your first trade of the month. And you’re already in the red.
Trading is about edge and efficiency. Paying $150+/mo for a journal that offers "Basic Journaling" and "No Simulator" is a losing trade from day one.
Compare the columns.
On the left, you have expensive "Data Viz Tools" ($90+) that don't even let you journal.
In the middle, you have TradesViz at $29.99/mo offering "AI Q&A," "Options Flow," and "Seasonality".
If you can't spot the value here, how do you expect to spot value in the market?
Make the smart trade.
Market tuition is the most expensive education on earth.
Do you want to pay for your lessons with your hard-earned capital, or do you want to pay with your time?
This isn't a "paper trading game." It is a full-scale execution environment.
The Order Panel on the right gives you the exact same tools—Market, Limit, Stop, Flatten, Reverse—that you use in the line of fire.
Make your fat-finger errors here. Blow up your account here.
Get the incompetence out of your system before you fund your real account.
Protect your capital.
Can your journal do this?... 🤨
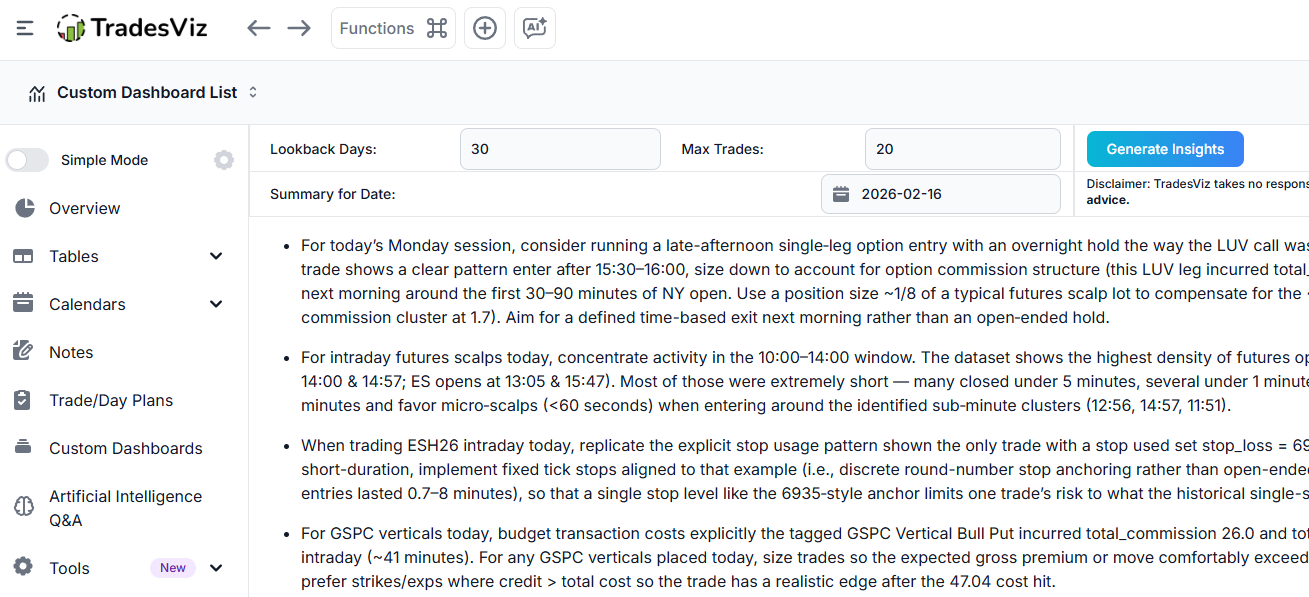
All AI models and post/pre-processing have been greatly improved on TradesViz's AI Q&A.
Ask questions that matter and apply the insights that truly have a positive effect on your performance.
That's the goal we have here at TradesViz.
The house always wins because the house plays the probabilities. Are you the house, or the gambler?
You celebrate the lucky windfalls and suppress the memory of the bad losses. But the Returns Distribution curve remembers everything.
It strips away the emotion and leaves only the math.
Look at the % Return Range chart. If your distribution is skewed to the left (negative returns), you don't have "bad luck." You have a losing system.
A professional's edge isn't magic. It's just a curve shifted slightly to the right.
Stop hoping. Start measuring.
Your broker loves you. Your PnL hates you.
Profit is vanity. Net Profit is reality.
This dashboard tracks the silent killer of portfolios: Commissions.
Look at the "Commissions & Fees vs Day" chart. Why is Friday's bar triple the size of Monday's?.
You aren't trading better; you're just clicking more.
High fees are often the first red flag of "churning" or over-trading.
Stop working for your broker.
Start keeping what you earn.
The February 16 technical screener showed broad and diversified momentum, with several stocks posting large one-day gains and others maintaining extended multi-week uptrends.
In the more than 20 percent daily gain group, FGNX stood out with a 397 percent surge accompanied by heavy trading volume of 36 million shares, marking one of the sharpest single-day advances of February. MGRT followed with a 112 percent jump on nearly 1.8 million shares, a 29,000 percent volume increase. FSLY, WTID, and GLTO gained between 59 and 72 percent with strong follow-through, signaling renewed interest in growth and tech themes. RIME and JDZG each logged 30 percent price increases and massive volume expansions above 15,000 percent, showing significant speculative activity.
In the stocks in overall uptrend for more than 14 days group, LITX led with a 141 percent rise and 2,300 percent volume growth, confirming a persistent accumulation phase. AZN, CONI, and NKTR continued multi-session runs of 90 to 117 percent, showing steady institutional momentum. ETHD, HOOZ, and LTE also sustained 70–90 percent gains with expanding volume trends.
Overall, the screener highlighted expanding market breadth, where both breakout names and longer-trending stocks showed consistent demand, supporting a constructive tone across mid-February trading.
The February 16 options flow screen showed a continuous three‑day rise in the put to call premium ratio across multiple large‑cap and high‑beta names, signaling broad defensive positioning after recent market volatility.
PDD recorded the sharpest move, up 3,167 percent, while T saw an exceptional 2,456 percent increase, both reflecting substantial short‑term protection buildup. FXI and UNP also spiked 1,304 and 915 percent respectively, suggesting increased hedging activity in China exposure and transport sectors. XYZ and DAL followed with gains of 789 and 335 percent, confirming steady premium demand across cyclical names.
Among growth‑focused tickers, ARKK showed a 95.5 percent rise in its ratio to a current value of 24, while RBLX and U rose 314 and 158 percent, marking consistent shifts toward downside coverage in innovation and gaming segments.
The ARKK chart illustrated mild price pressure alongside rising put premiums, confirming measured hedging rather than panic selling. Collectively, the data points to disciplined institutional protection layering, with traders preparing portfolios for potential volatility through the latter half of February.
The February 16 options flow screen showed concentrated institutional activity in CVX and UPS, accounting for nearly all of the session’s notable sweeps.
CVX calls dominated early afternoon trading with repeated buy sweeps at the 170 strike expiring February 20, 2026, each valued around 47 million in premium and totaling more than 100,000 contracts combined. Additional call flows appeared at the 160, 165, and 155 lines, each near 34 million, suggesting structured accumulation rather than speculative buying.
UPS activity centered on the 85 and 100 call strikes for March and February 2026 expirations, where multiple sell sweeps ranging from 28 to 41 million per trade indicated large-scale premium taking after prior advances.
GLD also saw an isolated 38 million call sweep at 475 expiring February 27, 2026, reflecting selective exposure toward metals.
Overall, the tape reflected disciplined two‑way flow: CVX building upside positioning in energy while UPS traders realized call premium and rotated exposure. The pattern suggests controlled re‑balancing rather than directional volatility ahead of the mid‑month macro catalysts.
🤖 Useful upgrades coming tomorrow 👀
TradesViz's AI features are only getting stronger every month.
New integrations, new charts, new ways to use your analysis, - all are going to be part of upcoming updates :)
The market is a mirror. 🪞
When an "outlier event" hits, what is your immediate reaction?
Panic? Euphoria? Calmness?
Your reaction is the only answer that matters.
Your PnL tells you how much you made.
Your reaction tells you who you are.