The **February 25, 2026 Options Flow Screener** highlighted stocks showing **positive divergence** on the **15‑minute timeframe** over the past day, indicating emerging bullish momentum under a **moderate divergence threshold**.
The list includes **$ACN, $AVGO, $HL, $JNJ, $RKLB, $STX, $USO, and $WFC**, reflecting strength across multiple sectors — from technology and healthcare to energy and financials.
The featured chart of **$ACN** shows clear short‑term price stabilization despite earlier declines, while volume activity and options flow metrics point to potential accumulation, supporting the divergence signal.
Overall, the screener suggests that institutional participants could be positioning early for reversals or rebounds in these names as momentum begins to shift upward.
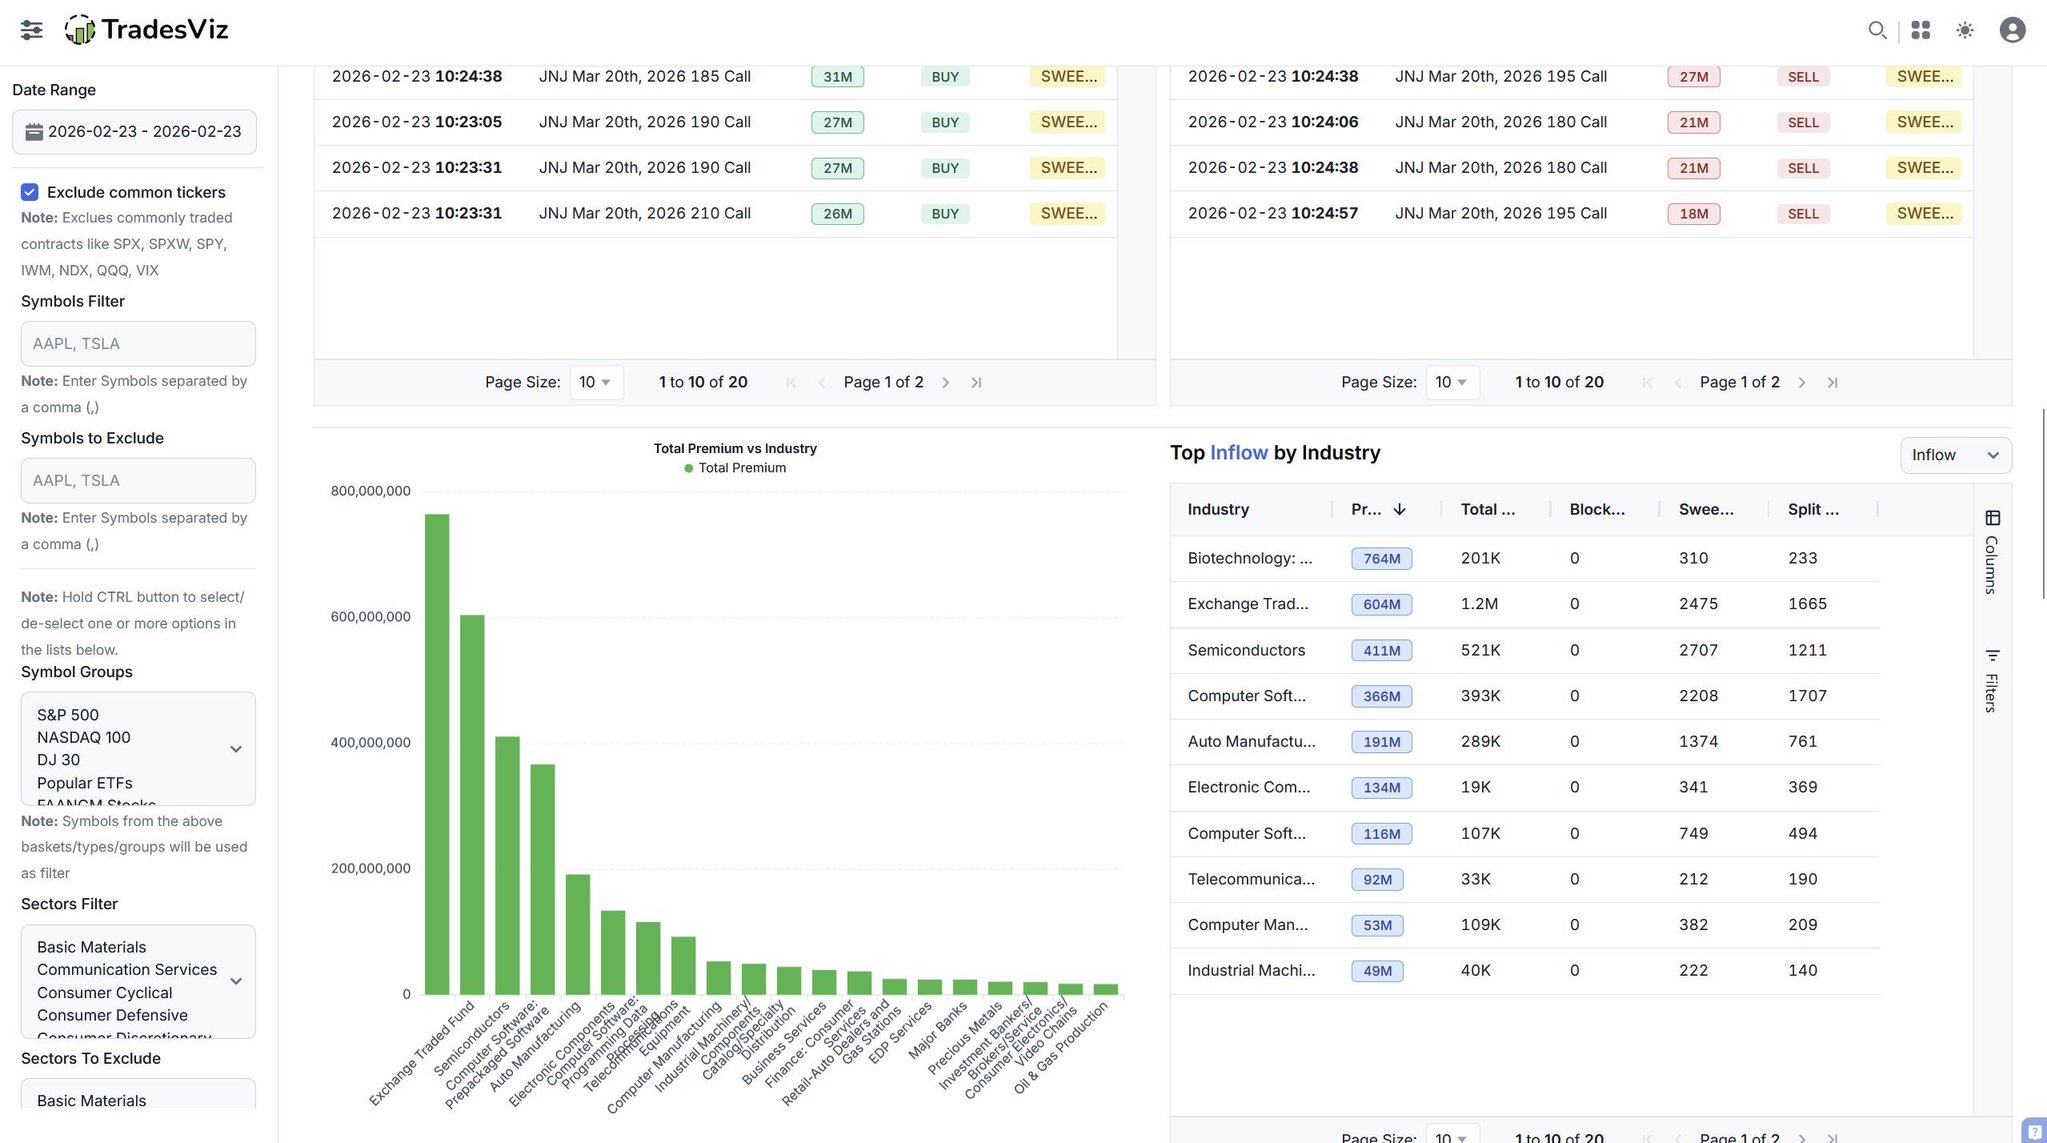
The options flow for **February 25, 2026** showcased concentrated institutional activity in metals, semiconductors, and tech‑linked equities, with multiple high‑value sweeps revealing selective accumulation and premium rotation.
$GLD dominated the tape early with a $90 million call buy sweep at the $480 strike (March 2026) — the day’s largest single transaction — balanced by two $55 million call sell sweeps at $475, suggesting active repositioning in gold exposure.
$GLW (Corning Inc.) followed with synchronized buying across several expirations: an $11 million call buy sweep at $65 (March 2026) and $70 (December 2026), plus $7.5 million buy and sell prints around $57.50 and $60, confirming steady two‑way institutional interest within industrial technology.
In semiconductors, $LITE posted $10 million and $6.8 million split call buys at $390 (March 2026), while $AVGO registered a $3.1 million put sell split at $1,100 (July 2026), signaling continued bullish bias in the chip sector. $SNDK added $4.5 million put split flow at $600, reinforcing protective hedging theme.
$XLE and $SLV each printed mid‑sized $4–5 million sweeps, showing measured re‑entry into energy and metals. $CVNA and $CYTK posted smaller balances (~$3–4 million) as secondary participants.
The February 25, 2026 earnings calendar features a powerhouse lineup across technology, retail, and financial sectors, accompanied by several key economic events shaping midweek sentiment.
After hours, tech takes center stage with $NVDA (NVIDIA Corp.) reporting from a record $4.65 trillion market cap with $1.45 EPS consensus, followed by $CRM (Salesforce, Inc.) at $166 billion and $2.14 EPS, $SNPS (Synopsys) at $80 billion and $2.43 EPS, $SNOW (Snowflake) at $53 billion and –$0.65 EPS, and $HEI (Heico Corp.) at $48 billion and $1.26 EPS. $TKO (TKO Group Holdings) also reports post‑close with a $40 billion valuation and $0.14 EPS projection.
Pre‑market releases include $TJX (The TJX Companies) with $175 billion cap and $1.38 EPS estimate, $LOW (Lowe’s Cos.) at $153 billion and $1.95 EPS, $BMO (Bank of Montreal) at $101 billion and $2.35 EPS, and $MDLN (Medline Inc.) with $65 billion cap and $0.24 EPS.
Key U.S. economic events include FOMC Member Barkin speaking at 08:30, Crude Oil Inventories at 09:30, FOMC Member Schmid at 10:00, and FOMC Member Musalem at 12:20, all adding macro context to an earnings‑heavy trading day.
Here is a powerful trading journal created for real traders seeking to identify and optimize their edge.
If you are passionate about analyzing your trading data, you need to check out
Improvements - Lots of them - UI, UX, Utility are coming to TradesViz soon...
Everything is going to be cleaner, faster, and easier to use.
+ Massive AI first-of-a-kind feature coming soon.... 👀
Track the Institutional Capital ✅
The Market Options Flow tool aggregates massive sweep and block trades, categorizing them directly by industry.
Use the custom filters to isolate unusual premium inflows and block out standard market noise.
Align your daily technical setups with actual institutional capital rotation.
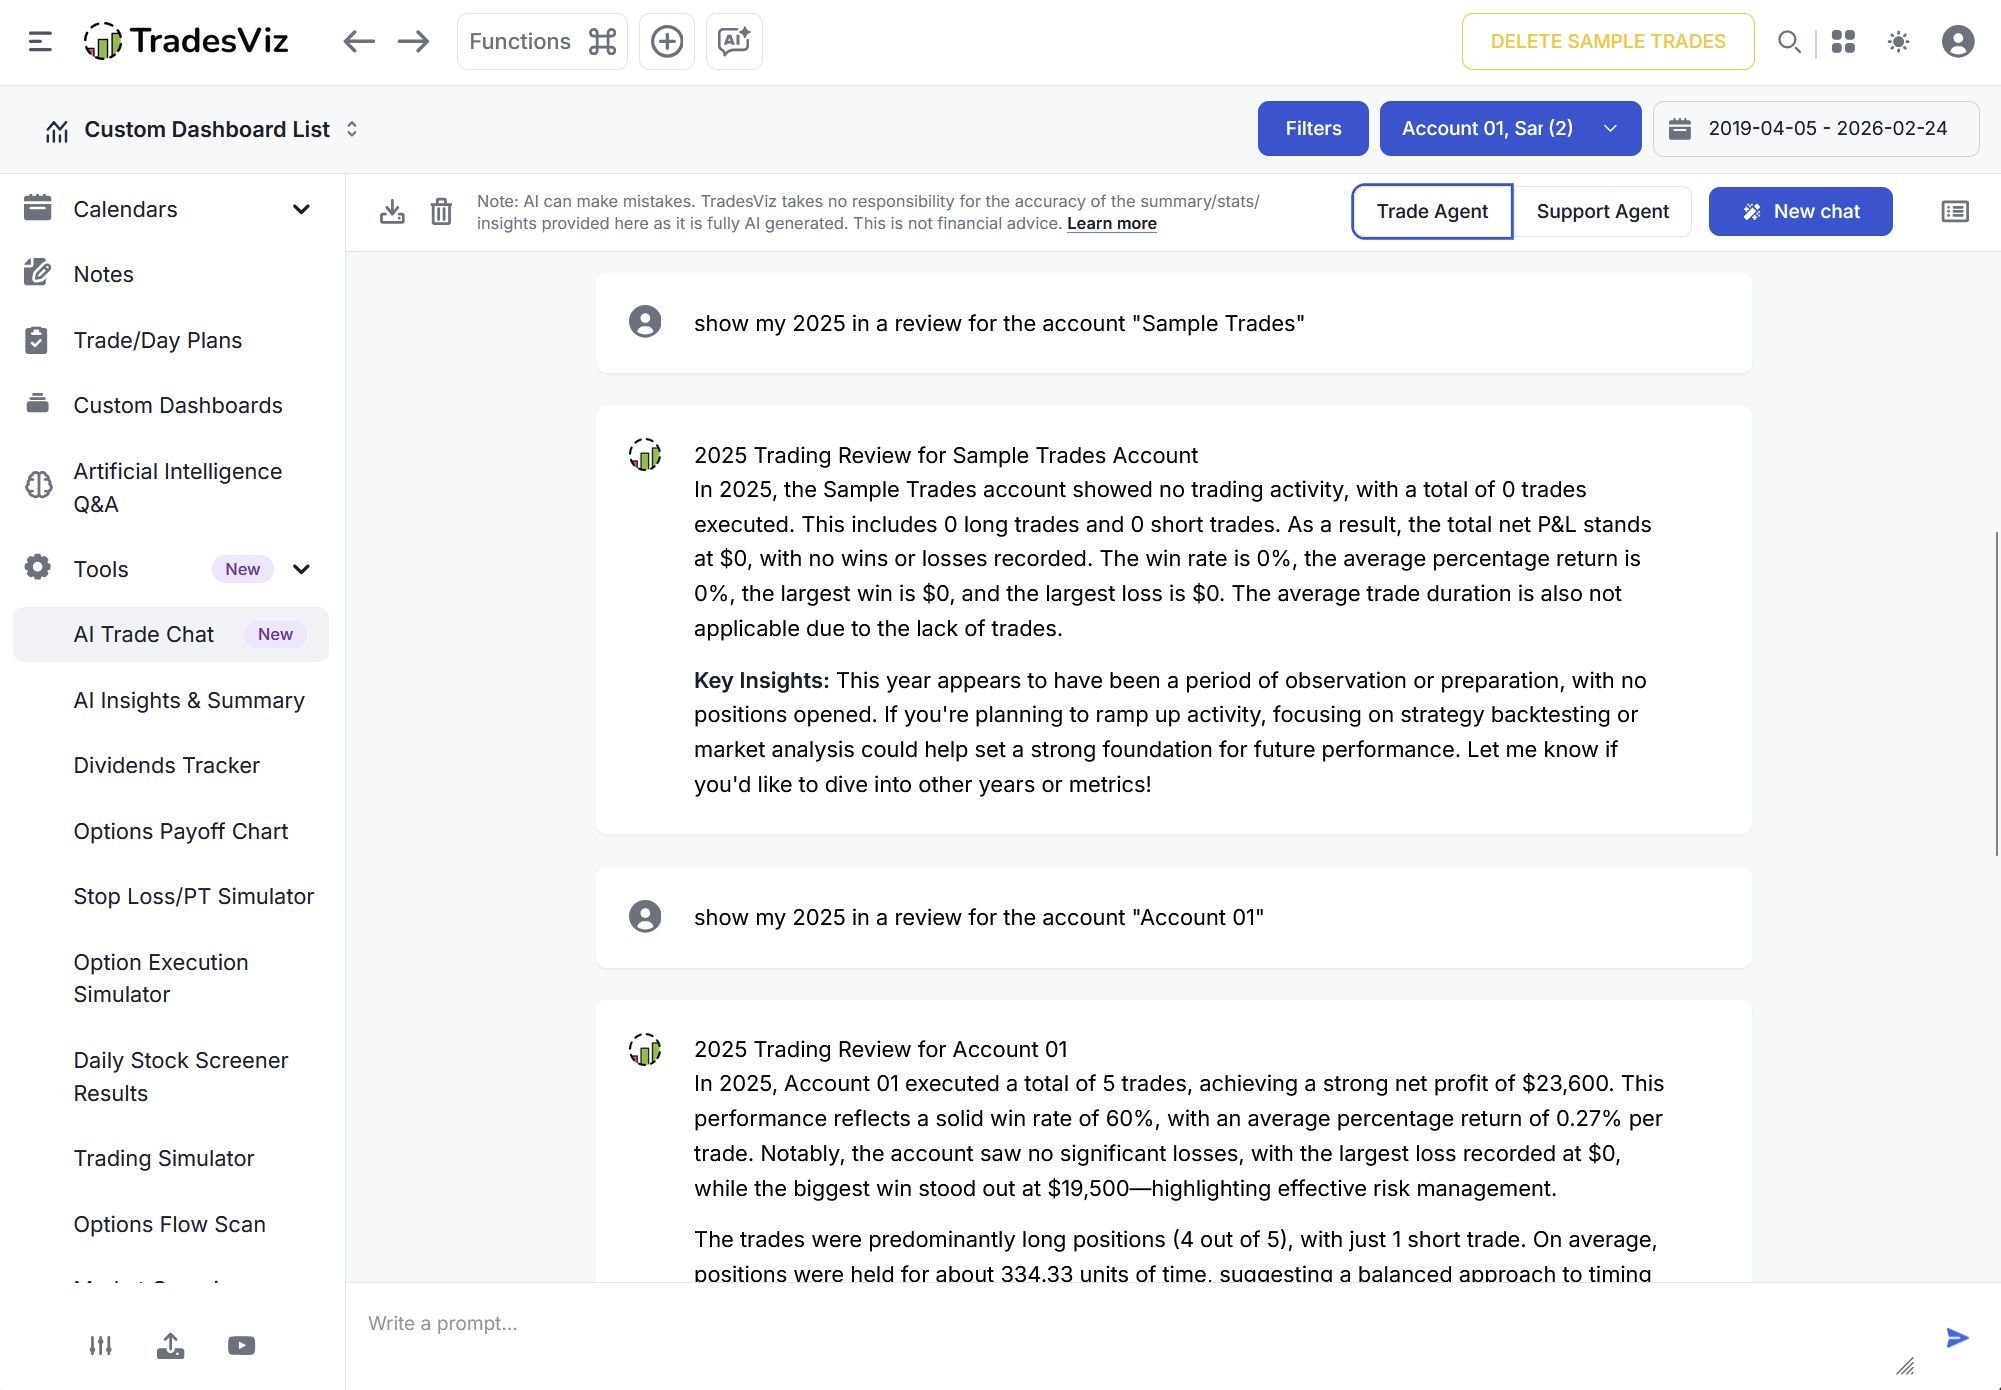
Manual performance reviews require significant time spent filtering tables and configuring charts.
The AI Trade Chat feature streamlines this process by allowing you to query your trading database directly using natural language.
By simply prompting the integrated Trade Agent, you can instantly generate comprehensive, text-based summaries for specific accounts, timeframes, or custom parameters.
It is designed to quickly extract macro-level insights, identify overarching behavioral trends, and review broad performance metrics at the end of a session or year without disrupting your primary analytical workflow.
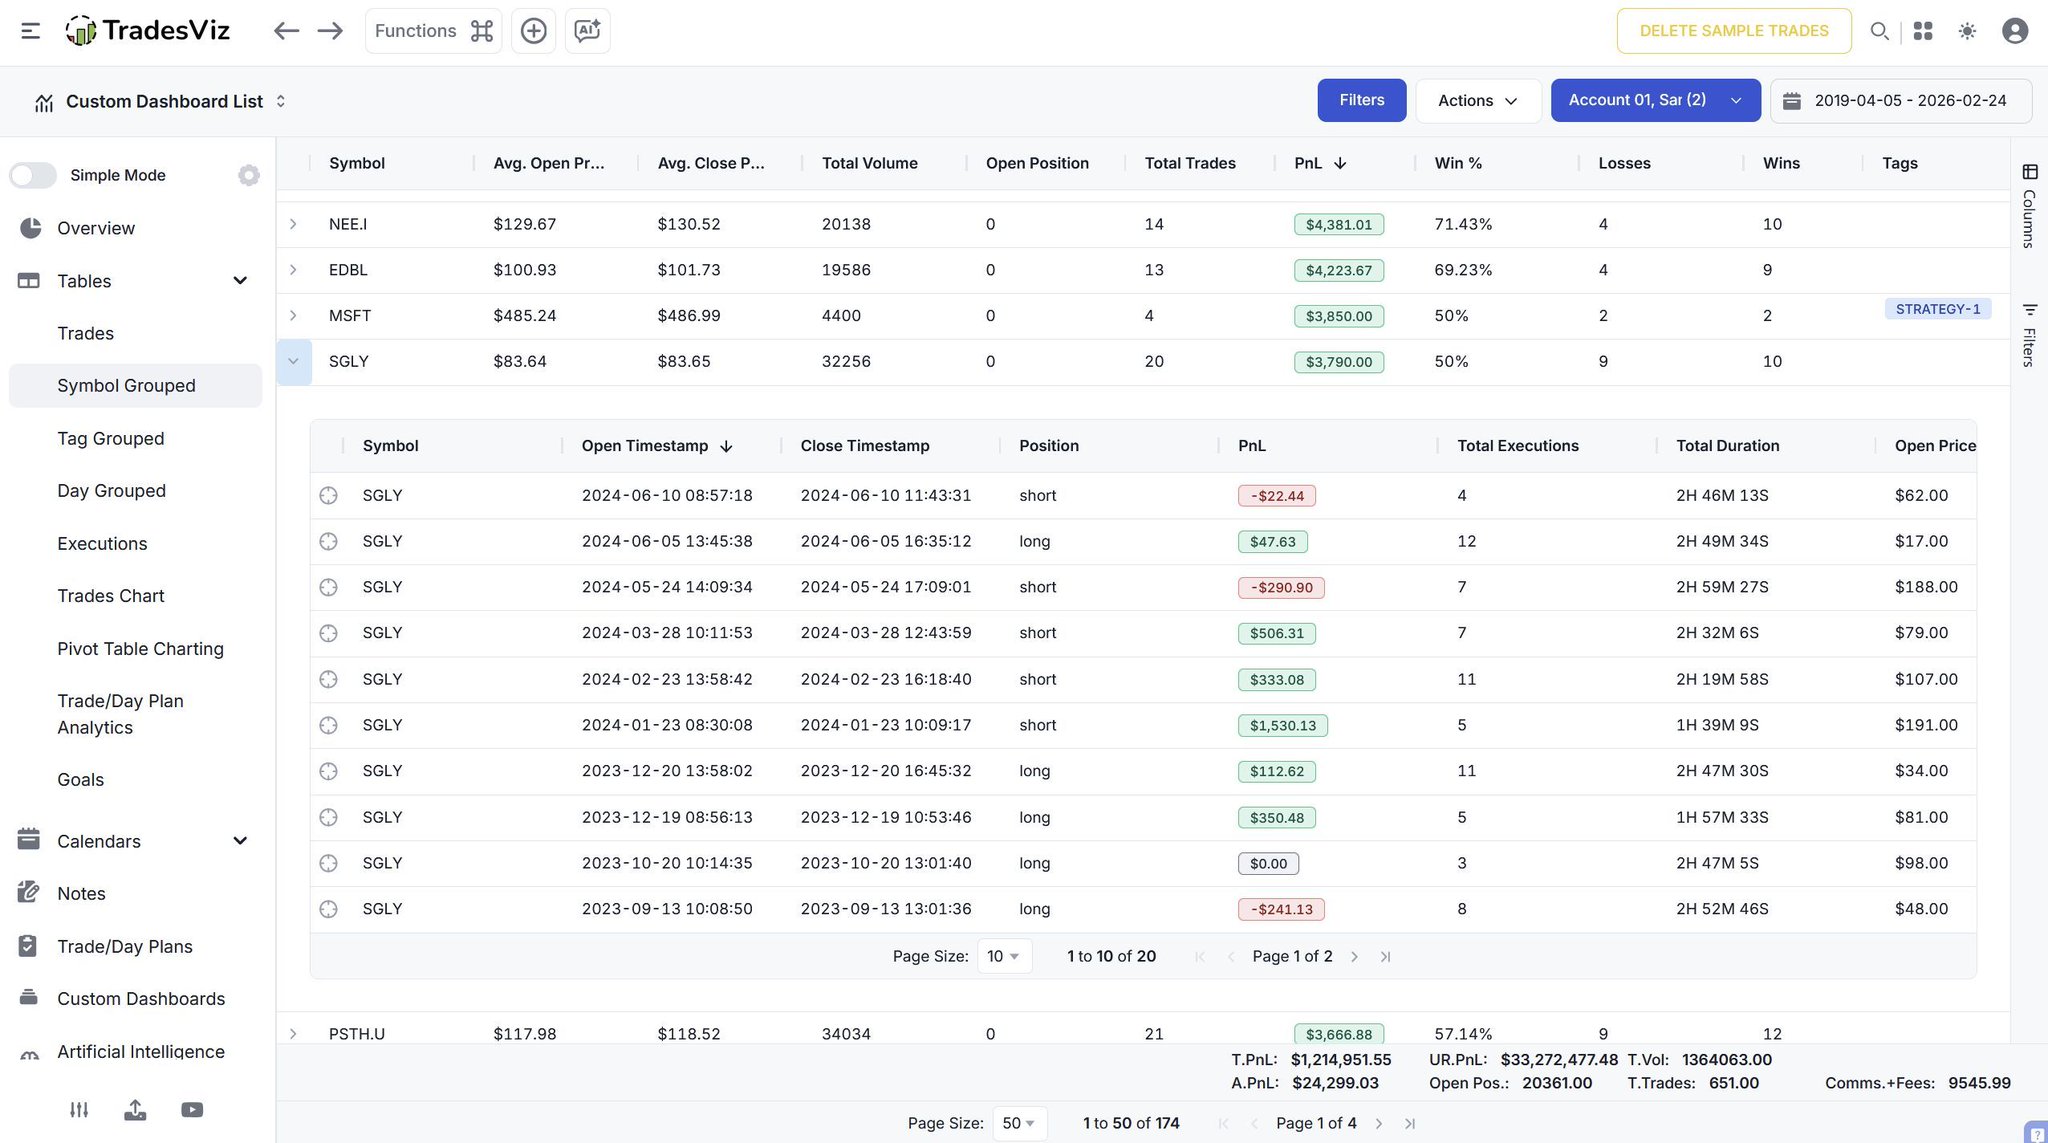
Isolate Your Edge by Asset ✨
A chronological trade log makes it impossible to know which specific assets are actually driving your returns or quietly bleeding your account.
The Symbol Grouped feature automatically consolidates your entire trading history by individual ticker.
Expanding any symbol row instantly reveals every historical execution for that specific asset in one focused, sortable view.
The February 20 Options Flow Screener revealed a sharp rise in the put‑to‑call premium ratio across multiple large‑cap sectors, indicating elevated hedging activity and a defensive market tone.
$AXP led with an extraordinary 16,995 percent increase, reaching a ratio of 10, suggesting substantial downside protection in financials. $CCJ followed closely with an 8,161 percent jump and a ratio of 8.5, reflecting strong put demand in the uranium and materials space. $JD and $AAL rose 2,004 percent and 1,622 percent respectively, with ratio values above 5, signaling similar caution in discretionary and travel sectors.
$ETN saw a 1,601 percent increase to a ratio of 13, one of the session’s highest readings, implying significant institutional hedging pressure. $KO (+1,620 percent, 3.3 value), $LABU (+1,357 percent, 4 value), and $XBI (+698 percent, 2.9 value) showed continued protection flows in biotech and consumer defensive names. $MA and $JPM recorded smaller but steady increases, reinforcing broad‑based risk management behavior.
The chart of $ETN illustrated a steady price decline paired with a parabolic rise in the ratio, confirming heavy accumulation of puts rather than speculative chasing. Overall, the data reflected coordinated institutional hedging ahead of potential market volatility in late February.
The February 20, 2026 options flow showed high‑notional institutional activity concentrated in $RTX and $COIN, with supporting flows across technology and energy names, revealing a session driven by structured portfolio adjustments.
$COIN recorded one of the largest single trades — a $83 million put sweep at the $200 strike (February 2026) — suggesting significant downside protection in crypto‑linked equities. $RTX dominated overall flow with a series of repeated $115 call sell sweeps ranging from $39 million to $78 million in premium, confirming systematic premium selling in the defense sector. Balanced activity appeared at higher strikes, with $130 and $180 call buy sweeps between $8 million and $18 million, implying selective upside exposure.
Other notable names included $SNDK with an $11 million long‑dated (January 2027) call buy (split flag), $SHEL’s twin $11 million call sell sweeps at $4.75 for the same maturity, and $VAL printing an $8.4 million call sell sweep at $185. $HOOD and $AFRM added smaller sell‑side and hedging flows, rounding out the session’s tech activity.