The options flow for June 1, 2026 showed elevated multi‑sector activity with strong sweeps in technology, financials, and defense names.
$IGV led early with an $85 put sell sweep worth 46M expiring August 2026, indicating large‑scale premium collection and bullish sentiment in software ETFs. $GS followed with multiple back‑to‑back sweeps — call buys and sells between the $580 and $600 strikes for June and July expiries, each ranging between 20M and 32M — suggesting aggressive two‑way positioning from institutions.
$SNDK posted significant semiconductor activity with call sweeps up to 18M at the $1,900 and $2,000 strikes for early 2027. $IBM showed two large call sell sweeps totaling 31M at $255 and $260 strikes for January 2027, potentially signaling near‑term profit taking. $AAPL and $SMCI both recorded steady 12–15M sweeps, reflecting continued heavy rotation in large‑cap tech.
$LMT closed the session with a $13M call buy sweep at the $350 strike expiring June 18, 2026, hinting at renewed interest in defense stocks.
Overall tone: balanced but high‑volume trading across tech, finance, and defense sectors, reflecting active positioning ahead of early June catalysts.
🎉 Anniversary Special: Use code TVYEAR6 to lock in 50% OFF all yearly plans.
Stop paying a premium for a platform that has to lie just to stay relevant. 🦅
When you compete by misleading, you are digging your own grave.
They want you to think you have to pay massive premiums for Trade Replay, Strategy Backtesting, and Live Screeners.
You don't.
We engineered a superior ecosystem that delivers maximum depth, absolute accuracy, and raw clarity without the ridiculous paywalls.
Stop fighting your tools and start building your edge.
Paper trading without consequences builds completely useless habits. 💀
It is easy to diamond-hand a massive drawdown when there are absolutely no rules.
Try doing that with a prop firm's trailing drawdown breathing down your neck.
Our upgraded Trading Simulator forces you to execute under the exact compliance parameters of the industry's top firms.
Train your psychology under the exact conditions you are going to be tested on. 🕹️🏦
Looking at just pnl or just win-rate is useless.
If your analytics platform has no overlays, you are actively being misled by your own stats.
Pay attention 👇TradesViz | Trading Performance Analysis (@tradesviz)A blended 50% win rate is a completely useless metric if you don't know where you are winning. 🧩
Break your execution down to the microscopic level. Are you dominating $10-$20 setups but getting absolutely crushed on high-volume large caps?
The integration of AI in analysis violently cross-references your wins and losses against precise price ranges, volume tiers, and specific times of the day.
Find the exact structural variables that print money, and ignore everything else. 🦅📉—
Stop letting market makers hunt your completely arbitrary stop losses. 🎯
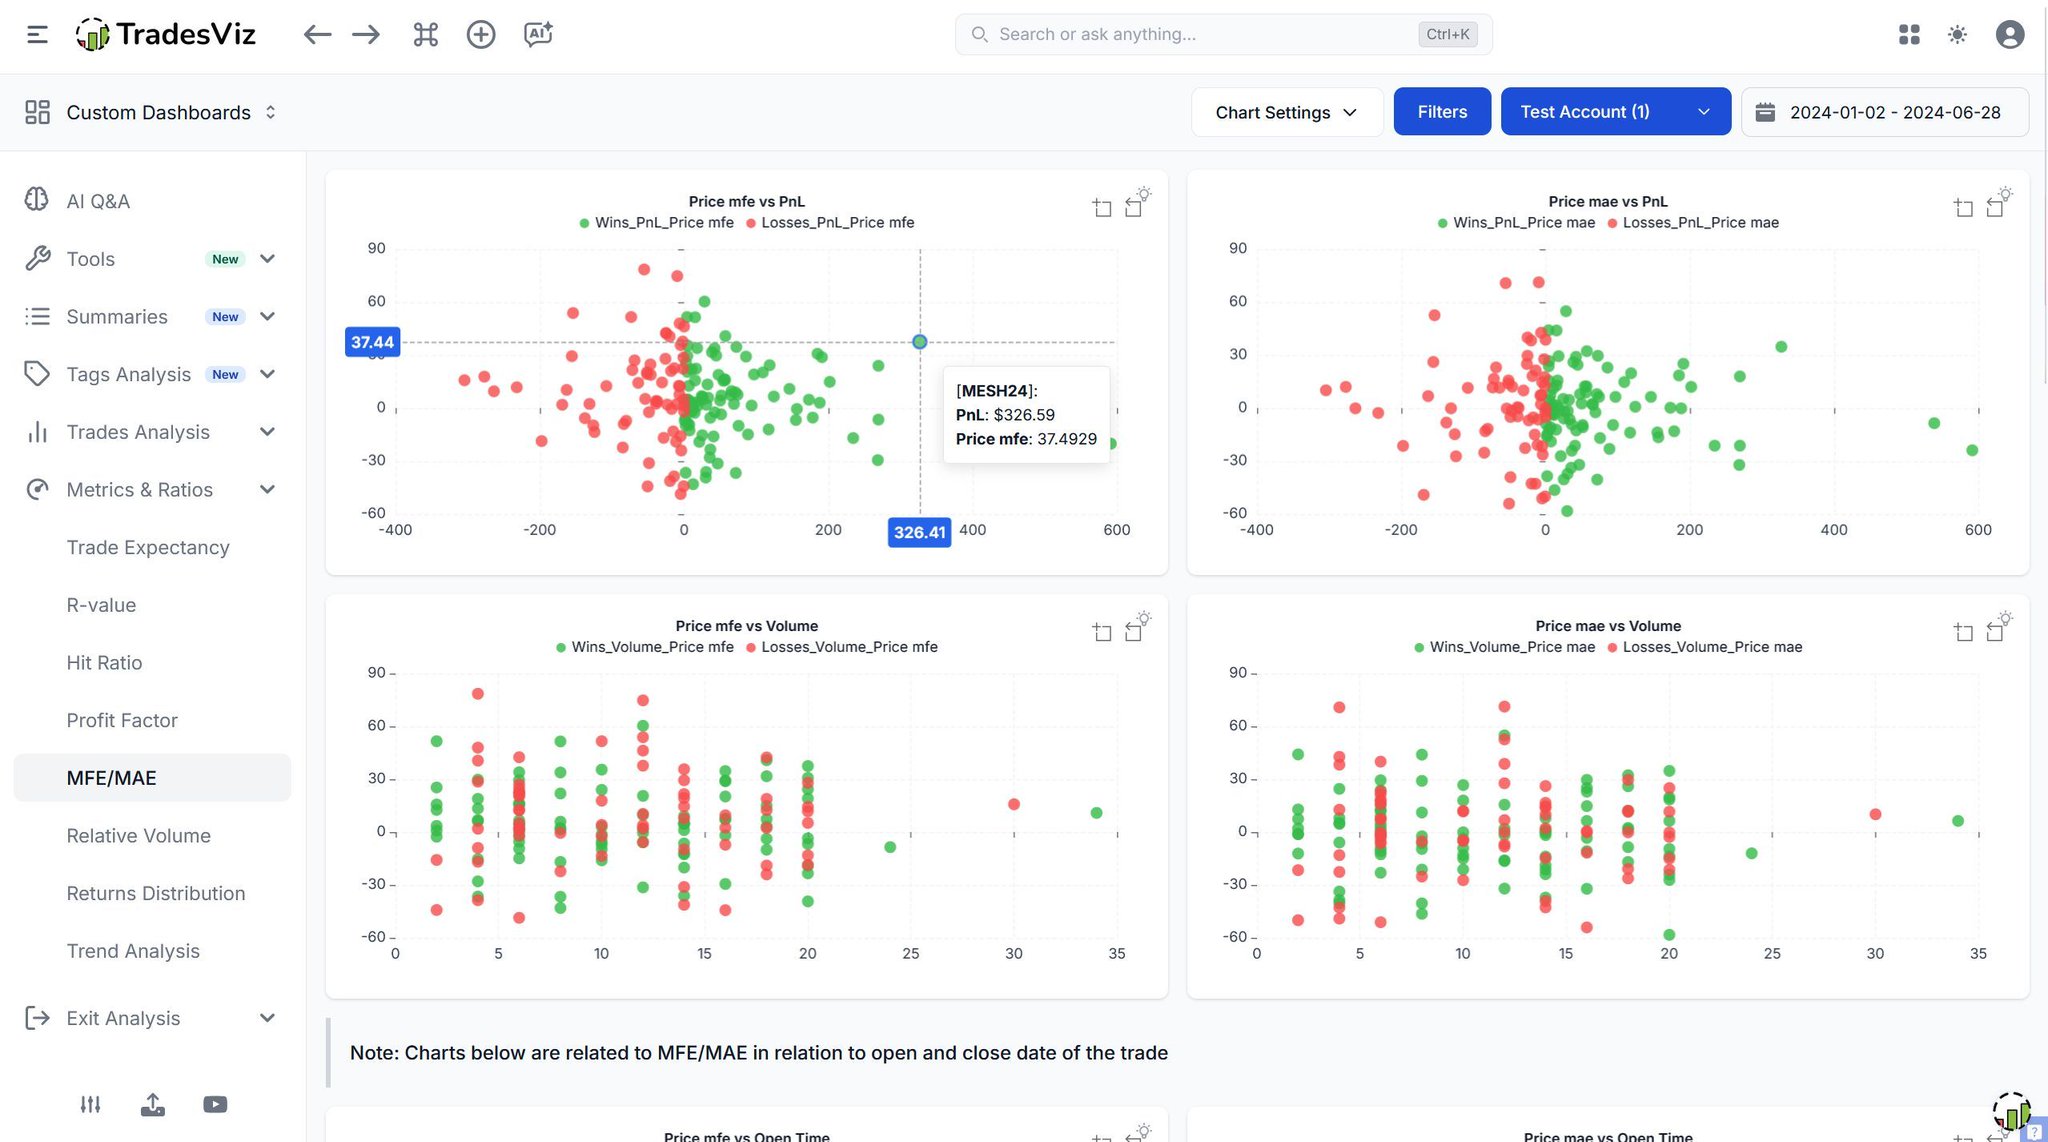
If you are placing stops based on random dollar amounts instead of historical MAE data, you are just providing liquidity to the rest of the market.
This dedicated dashboard brutally reveals the exact threshold where your setups actually invalidate.
Cross-reference your Maximum Adverse Excursion against your realized PnL to see exactly how much structural heat you take before a trade actually works.
Stop getting chopped out of winning trades. Optimize your stop placement based on undeniable historical facts. 🛡️📊
🎉 6th Anniversary Special: Get 50% OFF all yearly plans with code TVYEAR6. 💼⚡
Staring at endless rows of trades won't magically make you profitable. You need to ask the right questions. 🧩
You don't need a data science degree to find your edge anymore.
\The AI Q&A module acts as your personal, on-demand quantitative analyst.
No coding, no complex filter configurations.
Stop guessing and start interrogating your stats.
Have you checked the updated Day Explore tab on TradesViz?
A tab showing you info about day isn't just a list of trades made.
TradesViz's day explore is one of the most used pre-/post- market features.
It shows you your trade plans, charts, market events, running pnl + more
✅ 50% off all yearly - code TVYEAR6 🎉
Staring at your daily PnL will absolutely drive you insane. 🛑
One red day doesn't mean your edge is dead, but a consistently red week means your system is structurally broken.
The Weekly View forces you to step back from the intraday noise and confront your macro consistency.
Stop living trade-to-trade and start managing the bigger picture. 📅📈
Your "A-plus" setup might actually be the exact thing destroying your portfolio. 🩸
Don't assume you know how you perform during a massive multi-day run.
The Technical Analysis suite mathematically maps your long and short exposure directly against technical realities like a 14-day historical price change.
Demand undeniable proof from your indicators before you risk the capital. ⚖️💥
Retail traders get lost in the order flow.
Institutions use algorithms to summarize it. We just leveled the playing field. 🏢
If you are spending 20 minutes trying to figure out if the smart money is leaning bullish or bearish, the setup is already gone.
The newly integrated AI Trade Chat Summary sits directly above your flow table, ruthlessly dissecting massive data blocks.
You don't need a data science degree to track institutional sweeps anymore.
Let the AI do the heavy lifting. 🐋📊