We're excited to announce a powerful new feature using charts: Multi-Chart Grid Layout for the Trade Explore page. This feature allows you to display up to 4 TradingView charts simultaneously, each with its own unique template configuration. Historically, TradesViz has been very active in terms of adding chart features to TradesViz and we feel like this would be a big upgrade for active traders who want to be more efficient in trading analysis.
To sum up, if you've ever wanted to analyze a trade from multiple timeframes or with different indicator setups at the same time, this feature is for you
What is Multi-Chart Grid Layout?
The Multi-Chart Grid Layout feature transforms the single TradingView chart in the Trade Explore tab into a powerful multi-chart workspace. Instead of switching between different chart templates to view your trade with various indicator configurations, you can now view 2 or 4 charts side by side - all showing the same trade with different analysis setups.
Each chart slot can be configured with a different study/indicator template, allowing you to see your executions plotted on charts with completely different technical analysis configurations simultaneously.
How to Enable Multi-Chart Grid
To enable the Multi-Chart Grid feature, follow these steps:
- Navigate to Account Settings
- Scroll down to the Charts section
- Find the Multi-Chart Grid Layout setting and click the Configure button
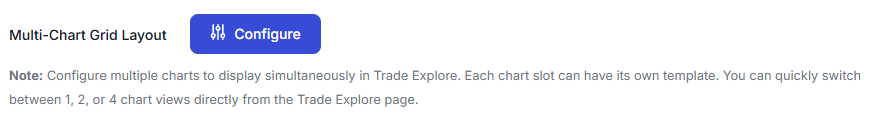
This will open the Multi-Chart Settings modal where you can configure all aspects of the feature.
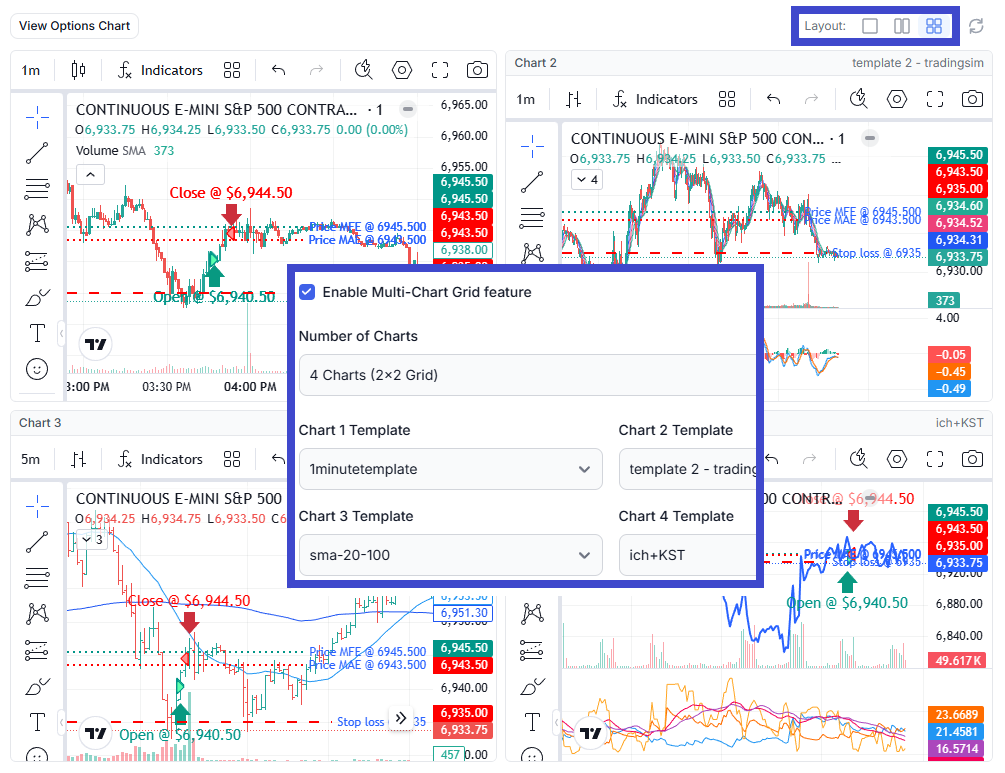
Configuration Options
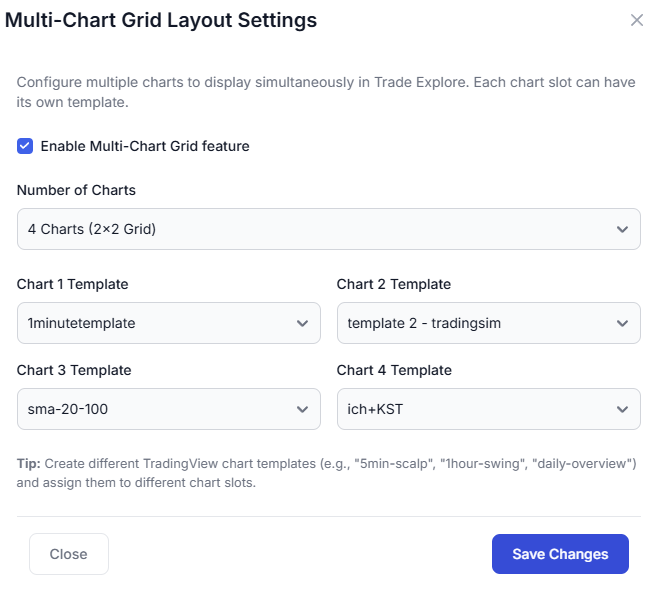
The Multi-Chart Settings modal provides the following configuration options:
Enable Multi-Chart Grid feature: A simple checkbox to turn the feature on or off. When disabled, the Trade Explore page will display the traditional single chart view.
Number of Charts: Choose how many charts you want to display -
- 1 Chart (Single) - Traditional single chart view
- 2 Charts (Side by Side) - Two charts displayed horizontally
- 4 Charts (2x2 Grid) - Four charts in a 2x2 grid layout
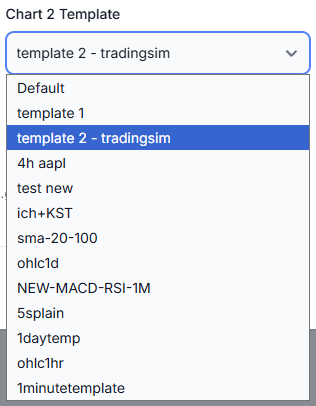
Chart Templates
For each chart slot (1-4), you can assign a different TradingView study template. These are the same templates you create and save using the TradingView chart's template feature (see Global TradingView Templates for more info on creating templates).
- Chart 1 Template - Template for the first (primary) chart
- Chart 2 Template - Template for the second chart
- Chart 3 Template - Template for the third chart (only visible in 4-chart mode)
- Chart 4 Template - Template for the fourth chart (only visible in 4-chart mode)
If you select "Default" for any chart slot, it will use the main template you have set globally in your TradingView chart settings.
Using Multi-Chart in Trade Explore
Once you've enabled and configured the Multi-Chart Grid feature, navigate to any trade's Trade Explore page. You'll notice a new Layout selector in the chart toolbar area (near the refresh button on the right side).
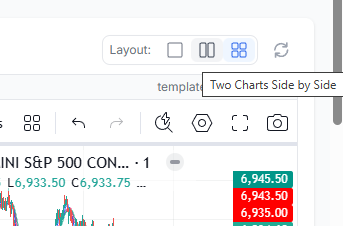
The Layout selector provides three buttons:
- Single rectangle icon - Switch to single chart view
- Two rectangles icon - Switch to 2-chart side-by-side view
- Four rectangles icon - Switch to 4-chart 2x2 grid view
Click on any layout button to instantly switch between views. The active layout is highlighted with a blue background.
Chart Layout Views
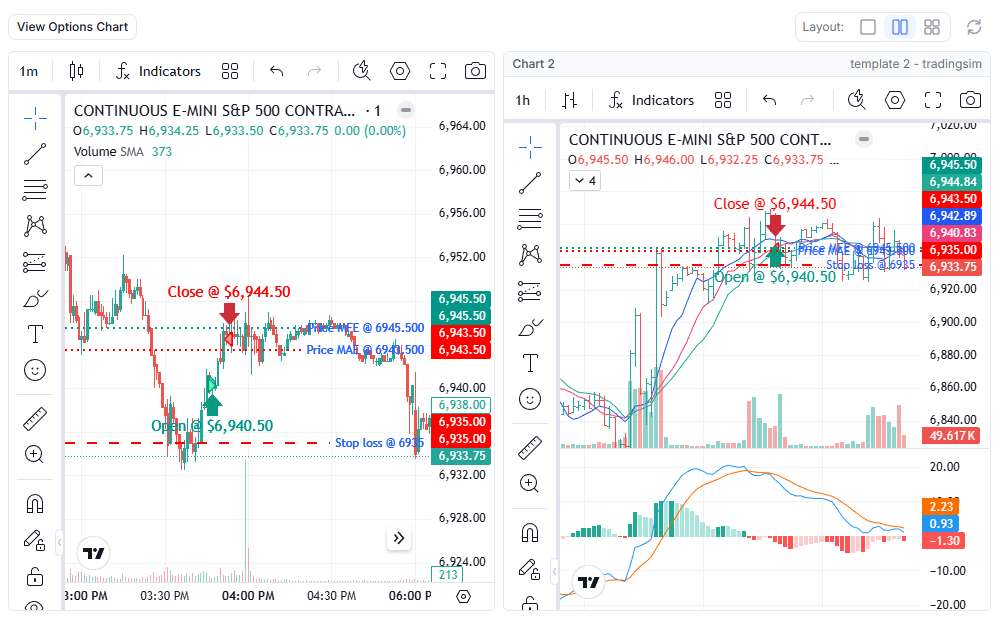
Two Charts (Side by Side)
In 2-chart mode, charts are displayed horizontally next to each other. This is ideal for comparing two timeframes or two different indicator setups.
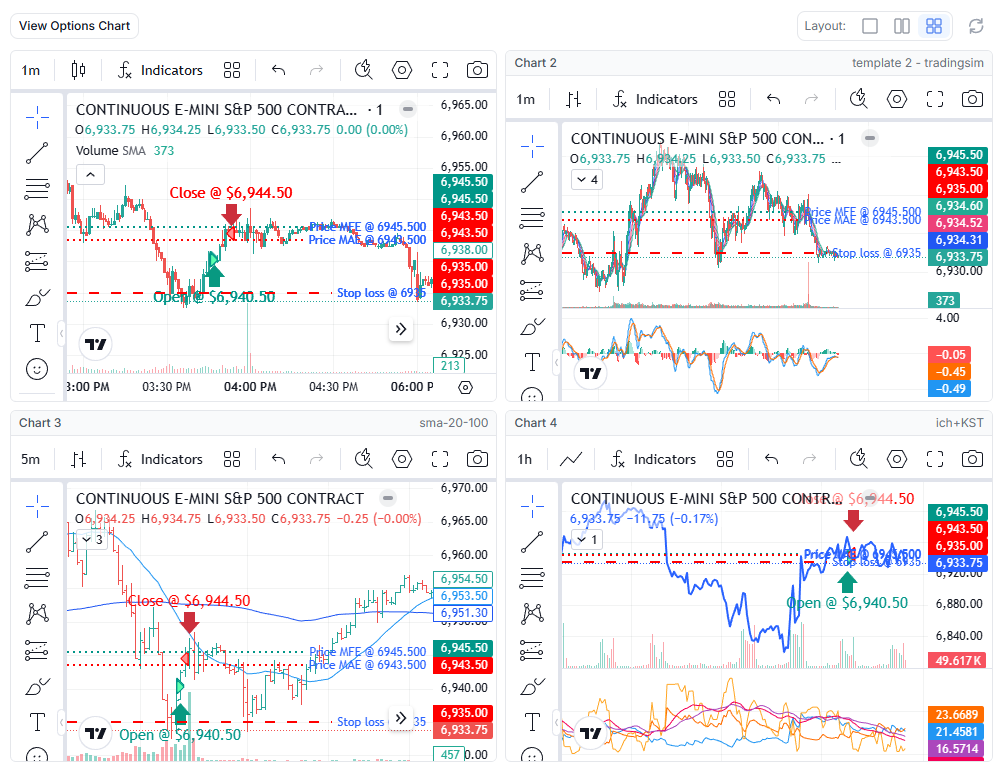
Four Charts (2x2 Grid)
In 4-chart mode, charts are arranged in a 2x2 grid (as shown at the top of the blog post). This gives you a comprehensive view of your trade from four different analytical perspectives.
Practical Use Cases
Here are some powerful ways to use the Multi-Chart Grid feature:
1. Multi-Timeframe Analysis
Create templates for different timeframes and view your trade across all of them simultaneously:
- Chart 1: 1-minute chart for precise entry/exit analysis
- Chart 2: 5-minute chart for short-term trend context
- Chart 3: 15-minute chart for intraday structure
- Chart 4: Daily chart for overall trend direction
2. Different Indicator Strategies
Compare how your trade looks with different indicator combinations:
- Chart 1: Moving averages (SMA 20, 50, 200)
- Chart 2: Momentum indicators (RSI, MACD)
- Chart 3: Volume analysis (VWAP, Volume Profile)
- Chart 4: Volatility indicators (Bollinger Bands, ATR)
3. Strategy Validation
If you use multiple trading strategies, set up templates for each:
- Chart 1: Scalping setup (short EMAs, tick charts)
- Chart 2: Swing trading setup (longer MAs, daily levels)
- Chart 3: Support/Resistance setup (horizontal levels, pivots)
- Chart 4: Clean price action (minimal indicators)
4. Learning and Review
When reviewing past trades for learning purposes:
- Chart 1: Your actual setup used during the trade
- Chart 2: Alternative setup you're testing
- Chart 3: Market context (SPY correlation)
- Chart 4: Raw candlestick pattern analysis
Creating Chart Templates
Before you can use the Multi-Chart feature effectively, you'll need to create some TradingView study templates. Here's a quick refresher on how to do this:
- Open any TradingView chart in TradesViz (e.g., in Trade Explore)
- Add your desired indicators and configure their settings
- Click on the Indicators button in the chart toolbar
- Click the Templates dropdown
- Select Save As... and give your template a descriptive name
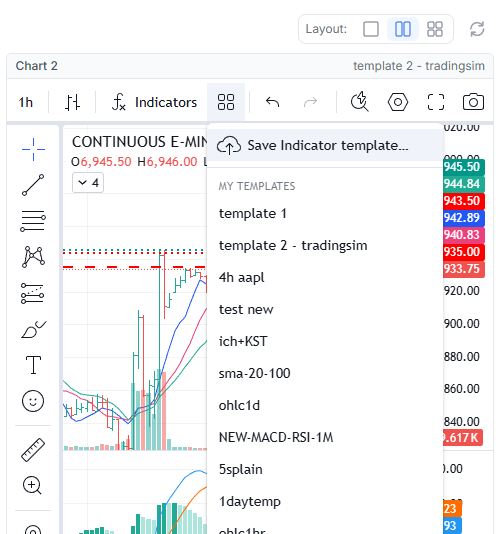
Tip: Use clear, descriptive names for your templates like "5min-scalp", "1hour-swing", "daily-overview", or "ichimoku+KST". This makes it easy to identify them in the Multi-Chart Settings dropdown.
Tradingview templates help you in setting indicators and their settings - this does not affect the bar type or the colors/styles of the underlying chart.
Performance Considerations
Loading multiple TradingView charts requires more resources than a single chart. To ensure optimal performance:
- Lazy Loading: Secondary charts (2, 3, 4) are loaded after the primary chart to prevent blocking the initial page load.
- Template Caching: Once loaded, templates are cached for faster switching. Meaning, if you edit a template, please refresh your page to see the updated templates.
- Responsive Design: On smaller screens, the grid automatically adjusts to maintain usability.
If you experience any performance issues, you can always switch back to single-chart mode using the Layout selector or disable the feature entirely in your settings.
Tips for Best Results
- Start with 2 charts if you're new to multi-chart analysis, then expand to 4 once you're comfortable
- Create purpose-specific templates - don't overload each template with too many indicators
- Use contrasting indicator types across charts for maximum analytical value
- Keep one chart "clean" with minimal indicators for pure price action reference
- Review and refine your template selections based on what provides the most actionable insights
Summary
The Multi-Chart Grid Layout feature brings professional-grade multi-chart analysis to your TradesViz Trade Explore experience. By viewing the same trade through multiple analytical lenses simultaneously, you can:
- Gain deeper insights into your trade entries and exits
- Validate your trading decisions across multiple timeframes
- Compare different indicator strategies on the same trade
- Accelerate your learning and trade review process
Combined with the existing global TradingView templates and technical analysis charts features, this makes TradesViz the most comprehensive charting and analysis platform for trade journaling.
As always, if you have any questions, feedback, or feature requests, please reach out to us at [email protected]!