Every trader has a different preference when it comes to charting. Some prefer static image-based charts as it offers a quick view of the snapshot of the chart when you traded an asset and it's also easily sharable and some prefer a fully detailed bar-by-bar interactive chart with indicators etc.,
We have always tried to accommodate as many preferences of traders as possible so that TradesViz is a platform that can be used by any type of trader. With this goal, today we introduce TradingView charts for all trades in TradesViz with auto-plotted executions and more!
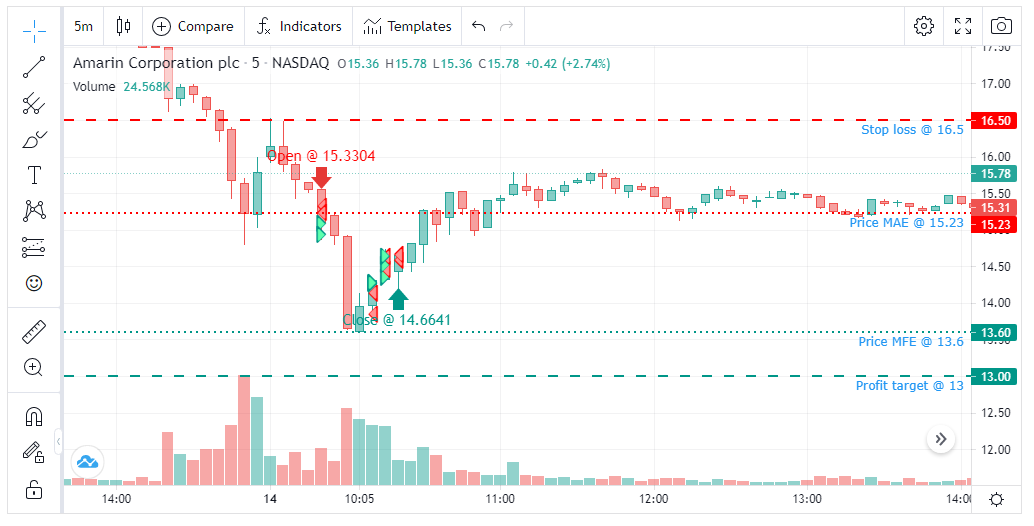
You will see a chart like the above on every trade explore page from today. Here's a quick overview of auto-plotted indicators/stats/icons:
- Right- and Left- facing triangles are the execution (non-option) that are plotted exactly at the price of the execution.
- Large green/red arrows indicate the entry and exit of the trade respectively.
- Arrow-inside-circle icon is for options trade that is plotted at the extremes of the candle.
- Thinly dotted green/red line represents the MAE/MFE of the trade (if present and MAE/MFE is already generated)
- Dashed green/red line represents the stop and profit targets of the trade (if entered via the trade explore page)
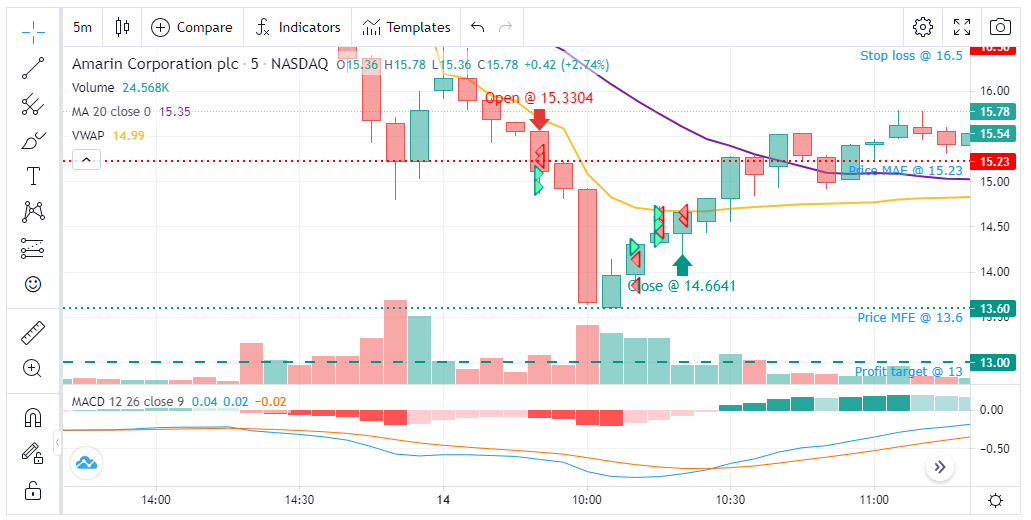
You can draw on any of these charts and it will be saved to your account and every time you access the trade, it will be displayed - i.e, all your technical analyses are always editable and saved safely.
It is also possible to create custom study templates and save them (again, saved to your account) so that you can apply these study templates to any TradingView chart in any trade.
We hope this makes your journaling process easier and more integrated!
If you have any suggestions, feature requests, questions, or issues, please don't hesitate to contact us at [email protected]!