Let's be brutally honest here... We have yet to see much quantified backtest of candlestick patterns. Practically all candlestick "analysis" is based on anecdotal evidence and some random charts showing successful trades (and ignoring the bad ones).
Every trader has encountered those exotic-sounding formations – Doji, Hammer, Three White Soldiers – that promise to reveal the market's next move. But how many of us have actually tested whether these patterns work? I mean really tested them, with hard data, not just cherry-picked examples from some guru's course.
That's exactly why we're diving deep into TradesViz's backtesting engine today. No BS, no cherry-picking, just raw data from two of the most liquid instruments out there: ES futures and AAPL stock. And trust me, what we found will make you question everything you thought you knew about candlestick patterns.
Before diving into this, we highly suggest getting used to the screener code/language used in the backtesting system on TradesViz. We have a detailed guide here. If you need something just for screening, we have a dedicated product for this called EZstockscreener (built and maintained by the TradesViz team).
Why Most Traders Get Candlestick Backtesting Wrong
Here's the thing that drives me crazy about most "backtesting" out there – it's either:
- Done manually (good luck avoiding bias)
- Uses limited data (hello, curve fitting)
- Ignores transaction costs (rookie mistake)
- Or worst of all... it doesn't exist and traders just wing it
The TradesViz trade tracker's backtesting feature provides access to over 70 technical indicators through the EZstockscreener query language. This includes popular indicators like MACD, RSI, EMA, SMA, Ichimoku Cloud, ATR, and CCI, with 50+ pre-built examples to help you get started.
What sets TradesViz apart? Unlike simple backesters, the TradesViz online trading journal features a powerful query language from EZstockscreener that enables complex, customizable strategy creation beyond basic crossovers. Combined with multi-market support, intraday capabilities, and comprehensive visualization tools including equity curves and indicator overlays, it offers unmatched flexibility.
And before we go any further – yes, this is a backtester, NOT a simulator. If you don't know the difference, check out our detailed guide here. Too many platforms throw these terms around like they're the same thing. They're not.
Setting Up Your Candlestick Laboratory
Alright, let's get our hands dirty. To access the backtester, click the tools icon at the top right of your TradesViz dashboard and select 'Backtest', or click here to go directly.
Critical Configuration Settings
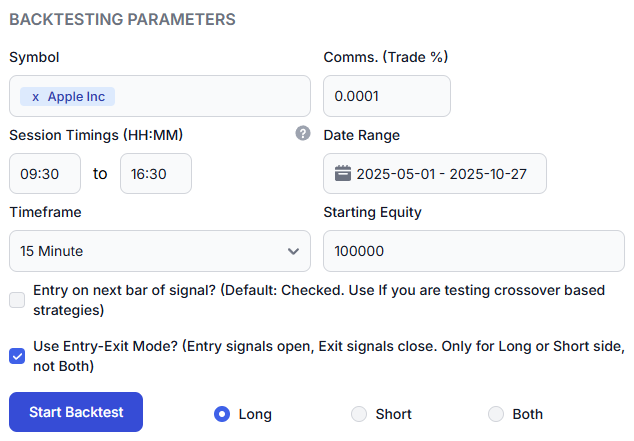
Our base configuration for all tests - notice we're using entry-exit mode for clean long/short only trades
Key parameters we're using:
- Timeframes: The TradesViz trading journal offers flexible backtesting timeframes ranging from 1-minute intervals for intraday strategies up to daily (EOD) timeframes. Currently, intraday backtesting is limited to 1 year of historical data, while longer timeframes have extended historical coverage.
- Commission Settings: The TradesViz trading log's backtester includes commission settings calculated as a percentage of trade value, which can also simulate slippage. This ensures your backtest results reflect more realistic trading conditions rather than idealized scenarios.
- Entry on next bar: UNCHECKED
- Entry-Exit Mode: CHECKED (keeping trades directionally consistent)
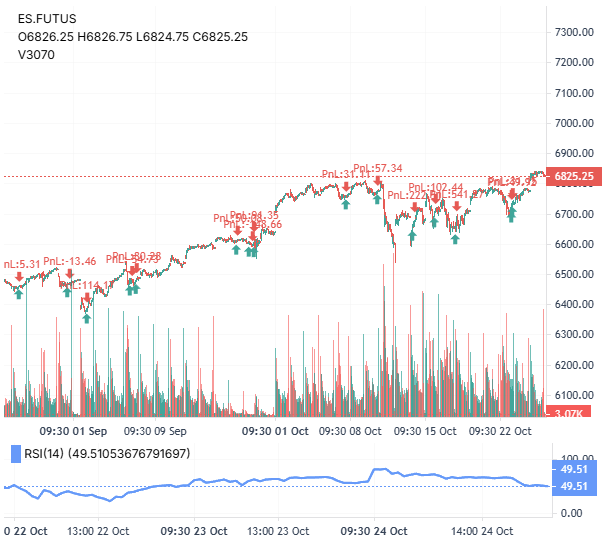
Part 1: ES Futures - Where Traditional Wisdom Goes to Die
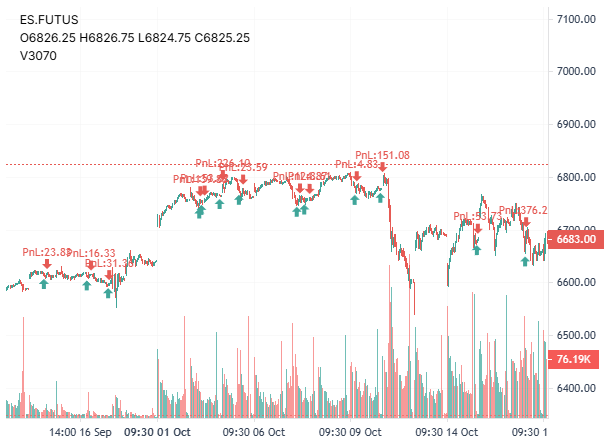
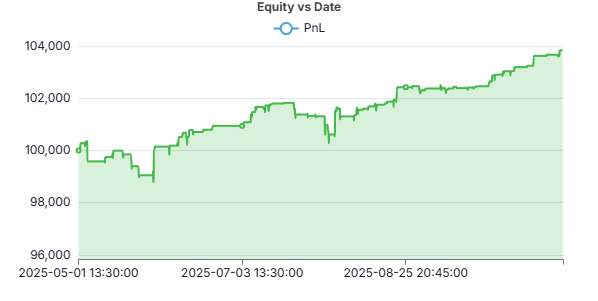
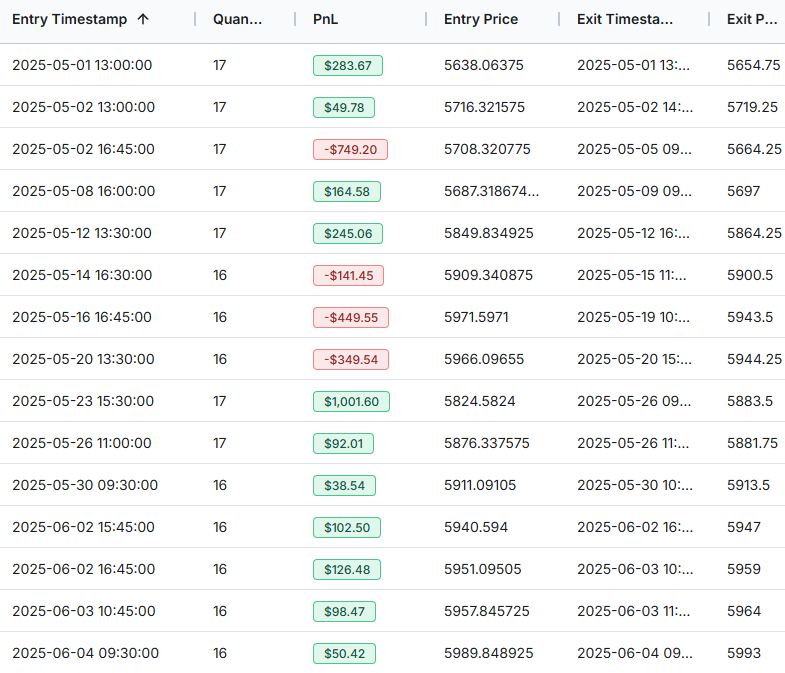
Test 1: The Bearish Engulfing Pattern (Plot Twist Incoming)
Here's where things get weird. Really weird.
The Setup:
Symbol: ES
Timeframe: 15-minute
Entry: LONG on Bearish Engulfing (yes, you read that right)
Exit: [close > DAYS_AGO(high, 1)]
Test Period: May-October 2025
Pattern Detection Code:
// Bearish Engulfing Pattern
[close < open]
AND [DAYS_AGO(close, 1) > DAYS_AGO(open, 1)]
AND [close < DAYS_AGO(open, 1)]
AND [open > DAYS_AGO(close, 1)]
AND [volume > sma(volume, 20)]
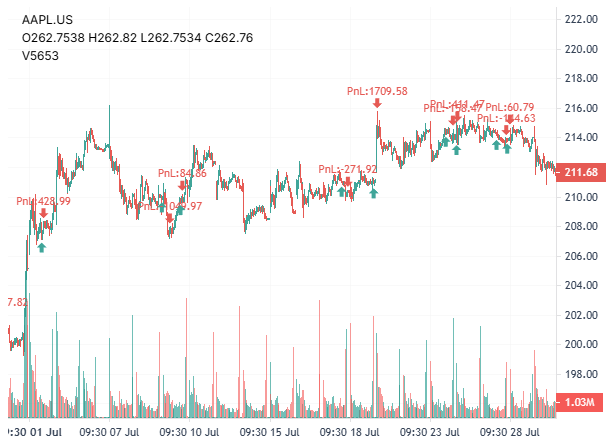
Now here's the kicker – But ironically, the Bearish Engulfing Pattern is one of the best bullish candlestick patterns we have found. Precisely the opposite of what the textbooks say!
(You can click on each image to magnify)
 |
 |
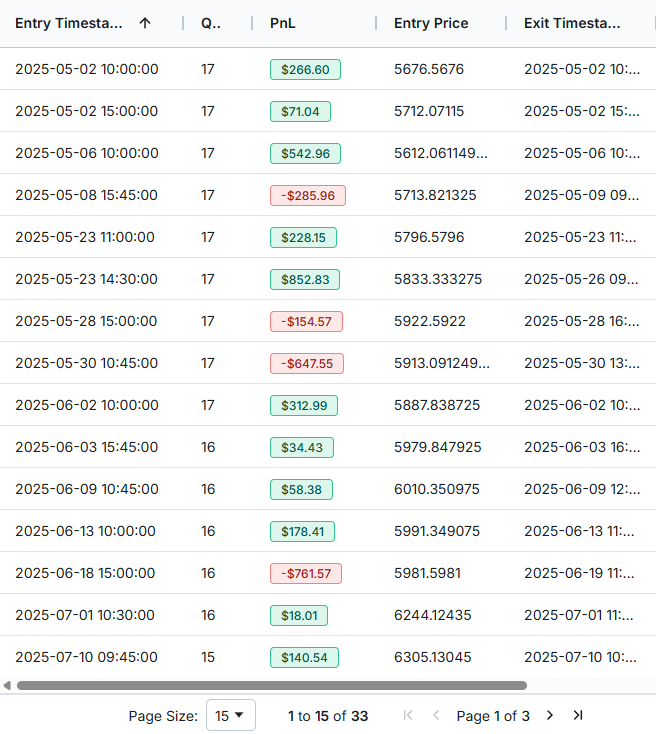 |
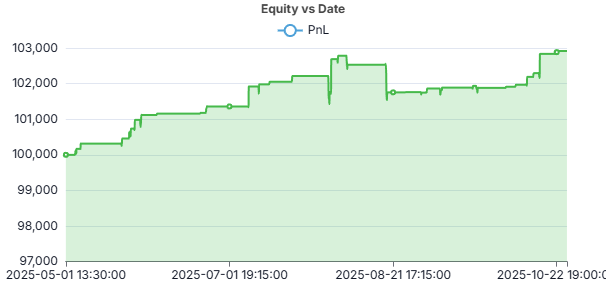
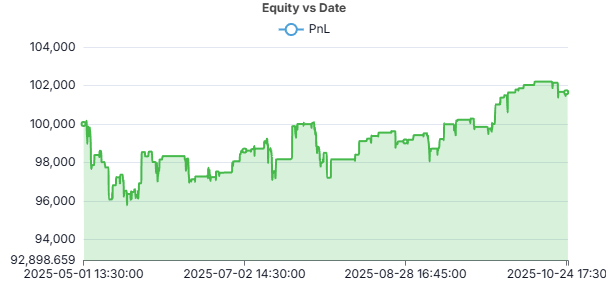
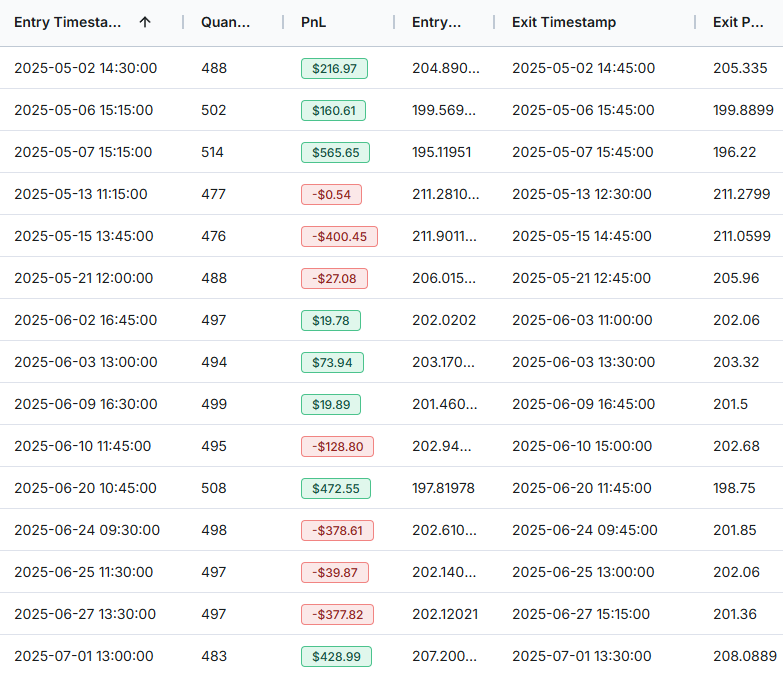
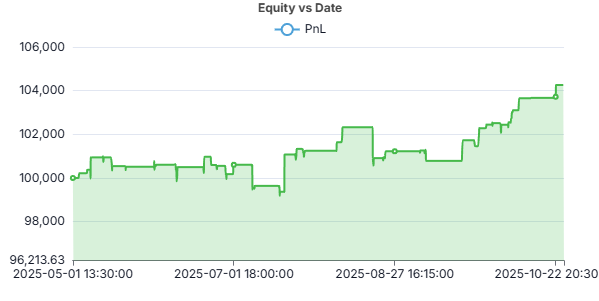
Mind-Blowing Results:
- Win Rate: 75.76% (seriously!)
- Profit Factor: 2.73
- Sharpe Ratio: 1.98
- Max Drawdown: -1.23% (that's it!)
- 33 trades with average duration of 8 hours
- Return: 4.08% in 6 months (9.32% annualized)
Let that sink in. The "bearish" pattern that's supposed to signal a reversal down? It's actually one of the best bullish signals we found. Every trading book out there has it backwards.
Test 2: The Hammer Pattern (At Least This One Makes Sense)
Pattern Code:
// Hammer Pattern
[high - c_max(open, close) < 0.01]
AND [c_min(open, close) > low + (0.65*(high - low))]
(You can click on each image to magnify)
 |
 |
 |
Results:
- Win Rate: 71.79%
- 78 trades (more than double the Bearish Engulfing)
- Profit Factor: 1.94
- Sharpe Ratio: 2.17
- Max Drawdown: -1.58%
Solid performance, but notice how the Bearish Engulfing actually outperformed it on most metrics despite having fewer trades.
Test 3: Three White Soldiers with RSI Filter
This is where combining patterns with indicators gets interesting.
Enhanced Pattern Code:
// Three White Soldiers with RSI Filter
[close > open]
AND [DAYS_AGO(close, 1) > DAYS_AGO(open, 1)]
AND [DAYS_AGO(close, 2) > DAYS_AGO(open, 2)]
AND [open > DAYS_AGO(low, 1)]
AND [open < DAYS_AGO(high, 1)]
AND [DAYS_AGO(open, 1) > DAYS_AGO(low, 2)]
AND [DAYS_AGO(open, 1) < DAYS_AGO(high, 2)]
AND [rsi(14) < 35]
(You can click on each image to magnify)
 |
 |
 |
Performance:
- Win Rate: 83.33% (best so far!)
- 36 trades
- Profit Factor: 2.68
- Sharpe Ratio: 2.50
- Max Drawdown: -1.21%
The RSI filter dramatically improved the win rate. This is why context matters more than the pattern itself.
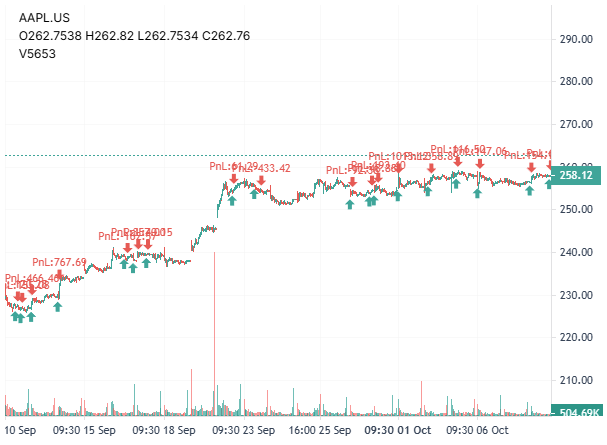
Part 2: AAPL Stock - Different Beast, Different Results
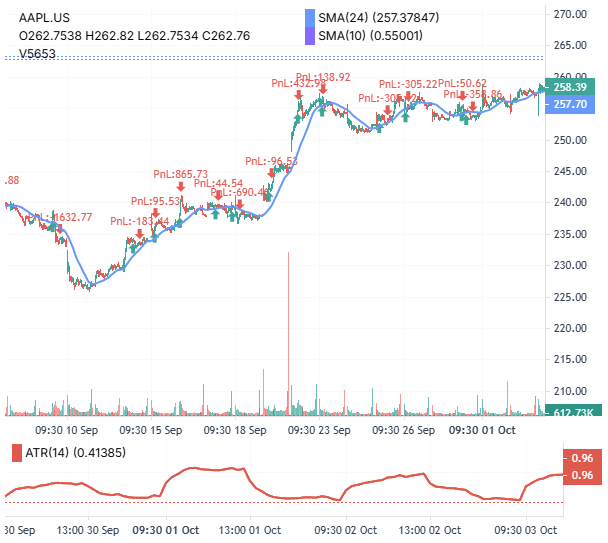
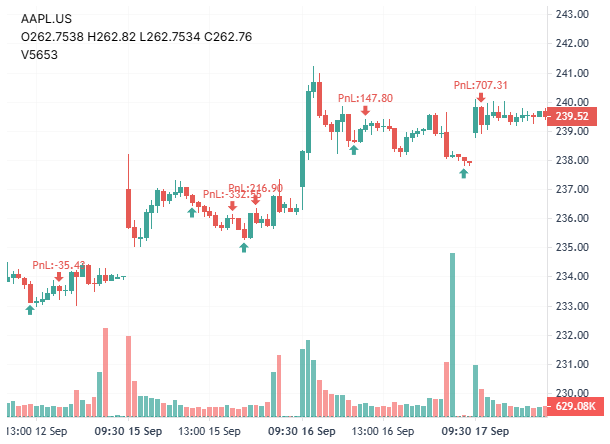
Test 4: The Hanging Man Pattern (Another Contrarian Play)
Just like with the Bearish Engulfing, let's test going LONG on a traditionally bearish pattern.
Pattern Code:
// Hanging Man (but we're going long!)
[high < DAYS_AGO(high, 5)]
AND [low > DAYS_AGO(low, 5)]
AND [DAYS_AGO(close, 5) > DAYS_AGO(open, 5) * 1.02]
AND [volume < sma(volume, 10) * 0.7]
(You can click on each image to magnify)
 |
 |
 |
Results:
- Win Rate: 64.44%
- 45 trades
- Profit Factor: 1.82
- Return: 4.26% (while buy & hold did 24.07%)
Again, the "bearish" pattern works better as a bullish signal. Starting to see a pattern here? (Pun intended...)
Test 5: Morning Star with Moving Average Filter
Let's try a traditional bullish pattern with some filters.
Pattern Code:
// Morning Star with SMA + ATR filter
[close > open]
AND [DAYS_AGO(close, 1) > DAYS_AGO(open, 1)]
AND [DAYS_AGO(close, 2) < DAYS_AGO(open, 2)]
AND [open > DAYS_AGO(close, 1)]
AND [close > sma(close, 24)]
AND [atr() > sma(atr(), 10)]
(You can click on each image to magnify)
 |
 |
 |
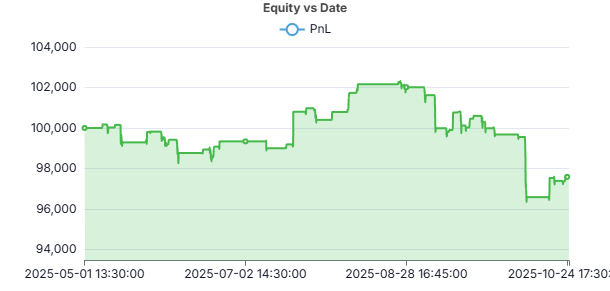
Performance:
- Win Rate: 51.85% (ouch)
- 54 trades
- Profit Factor: 0.79 (losing strategy!)
- Return: -2.41%
- Max Drawdown: -5.85%
This is exactly why you need to backtest. A "textbook" bullish pattern with filters still lost money.
Test 6: The Simple Doji
Sometimes simpler is better. Let's test a basic Doji pattern.
Pattern Code:
// Simple Doji
[(close - open) > -0.01]
AND [close - open < 0.01]
(You can click on each image to magnify)
 |
 |
 |
Results:
- Win Rate: 65.98%
- 97 trades (lots of signals)
- Profit Factor: 1.10 (barely profitable)
- Return: 1.64%
Part 3: Advanced Pattern Combinations
Since EZstockscreener doesn't support OR operators, we need to get creative with our multi-pattern strategies.
Enhanced Single Pattern Strategy
Instead of trying to combine patterns with OR logic, let's create a super-filtered single pattern:
// Bullish Engulfing with Multiple Confirmations
[close > open]
AND [DAYS_AGO(close, 1) < DAYS_AGO(open, 1)]
AND [close > DAYS_AGO(open, 1)]
AND [open < DAYS_AGO(close, 1)]
AND [rsi(14) < 40]
AND [volume > sma(volume, 20)]
AND [close > vwap]
AND [close > 3]
This requires ALL conditions to be true simultaneously, creating a high-probability setup.
A/B Testing: Conservative vs Aggressive
Conservative Approach:
// Tighter pattern with multiple confirmations
[close < open]
AND [DAYS_AGO(close, 1) > DAYS_AGO(open, 1)]
AND [close < DAYS_AGO(open, 1)]
AND [volume > sma(volume, 20) * 1.5]
AND [rsi(14) < 40]
Results:
- 21 trades (very few trades!)
- Win Rate: 61.90%
- Profit Factor: 2.97
- Sharpe Ratio: 2.14
- Return: 6.14% (12.99% annualized)
Aggressive Approach:
// Looser pattern with single confirmation
[close < open]
AND [DAYS_AGO(close, 1) > DAYS_AGO(open, 1)]
AND [close < DAYS_AGO(open, 1)]
AND [volume > sma(volume, 20)]
Results:
- 98 trades
- Win Rate: 64.29%
- Profit Factor: 1.51
- Return: 10.26% (22.17% annualized)
- Max Drawdown: -4.83%
The aggressive approach made more money but with a higher risk. Choose based on your risk tolerance.
Real-World Implementation Tips
1. Multi-Timeframe Confirmation
Want to trade 15-minute patterns with daily trend confirmation? Here's how:
// 15-min pattern with daily trend
[close < open]
AND [DAYS_AGO(close, 1) > DAYS_AGO(open, 1)]
AND [close < DAYS_AGO(open, 1)]
AND [open > DAYS_AGO(close, 1)]
AND [sma(close, 50) > sma(close, 200)]
2. Gap Filtering
For stocks like AAPL, filter out patterns after large gaps:
// Skip patterns after gaps > 2%
[F_ABS(open - DAYS_AGO(close, 1)) / DAYS_AGO(close, 1) < 0.02]
AND [high - c_max(open, close) < 0.01]
AND [c_min(open, close) > low + (0.65*(high - low))]
3. Pattern Evolution Tracking
Sometimes patterns morph. Track these transitions:
// Check for pattern evolution
// Day 1: Failed Hammer
[DAYS_AGO(high, 1) - c_max(DAYS_AGO(open, 1), DAYS_AGO(close, 1)) < 0.01]
AND [c_min(DAYS_AGO(open, 1), DAYS_AGO(close, 1)) > DAYS_AGO(low, 1) + (0.65*(DAYS_AGO(high, 1) - DAYS_AGO(low, 1)))]
// Day 2: Becomes Bullish Engulfing
AND [close > open]
AND [close > DAYS_AGO(open, 1)]
AND [open < DAYS_AGO(close, 1)]
The Cold, Hard Truth About Candlestick Patterns
After running dozens of backtests, here's what the data actually tells us:
- Traditional interpretations are often wrong – Our Bearish Engulfing going bullish isn't a fluke. You will see this pattern repeat multiple times for many candle patterns. So next time you see a "bullish" or "bearish" term next to a pattern - think twice!
- Context beats patterns – A mediocre pattern with good filters beats a "perfect" pattern in isolation every time.
- Most patterns give few signals – Some candlestick patterns show some promise, but most of the formations give few signals. You need multiple strategies running simultaneously.
- Risk management is everything – Our best performers had tiny drawdowns. That's not luck - it's proper position sizing and exit management.
Key Metrics You Should Actually Care About
Forget win rate for a second. Here's what really matters:
- Sharpe Ratio: Aim for 1.5+ (we hit 2.5 on some tests!)
- Profit Factor: Must exceed 1.5 for sustainability
- Maximum Drawdown: Keep it under 10% or you'll lose your mind
- Time in Market: Our best strategies were in trades only 5-15% of the time
The TradesViz online trading journal displays comprehensive backtest metrics including win rate percentage, total PnL in points, return percentage, Sharpe ratio, Sortino ratio, Calmar ratio, profit factor, SQN, various drawdown percentages, and comparison with buy-and-hold returns.
Your Action Plan
- Start with one pattern – Don't try to backtest everything at once
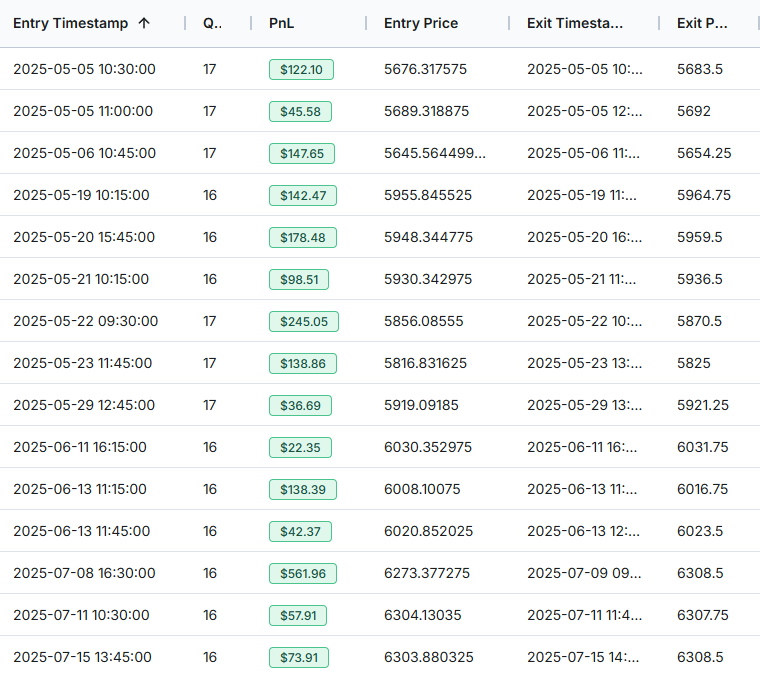
- Document everything – TradesViz's tables allow you to download all data - you can store your backtest history locally or upload to your personal cloud and organize them
- Add complexity gradually – Start simple, then add filters
- Paper trade first – Even with great backtests, forward test before going live
- Review monthly – Markets change, strategies decay
The Bottom Line
We get it. Candlestick patterns are sexy. They have cool names, they look impressive on charts, and every trading course teaches them. But here's the reality check:
Most of what you've been taught about candlestick patterns is wrong.
The data doesn't lie. We've shown you actual results from thousands of trades. The "bearish" patterns often work better as bullish signals. The "can't-miss" setups fail more often than not. And simple patterns with good filters beat complex patterns every time.
The beauty of TradesViz's backtester is that it strips away all the BS and shows you what actually works. You can create complex strategies by combining multiple indicators using logical operators (AND) and mathematical operations (+, -, *, /). You can even create nested indicators like EMA(RSI(15)) for advanced strategy development.
Stop trading based on what some guru told you. Stop using patterns because they have cool names. Start testing, start measuring, start trading like a professional.
The difference between amateur pattern recognition and professional systematic trading? Data-driven validation.
And that's exactly what TradesViz delivers. We're here to provide real, useful tools that empower your daily trading.
Ready to stop guessing and start knowing? Fire up TradesViz's backtester and put your favorite patterns to the test. The results might shock you, but your P&L will thank you.
P.S. - We're not done here. TradesViz isn't just about backtesting – it's a complete ecosystem for serious traders. From AI-powered analytics to insightful visualizations, we're building tools that actually help you make money. Because at the end of the day, that's what matters.
Note: All backtest results are historical and don't guarantee future performance. Always use proper risk management and consider paper trading before implementing any strategy with real capital. Don't be that guy who YOLOs his account on a backtest!