
TradesViz
🍫Hershey Co - $HSY - Our seasonality of the day! Up ~23% this year so far 👀 Is this on your watchlist?... We found this using the TradesViz seasonality practice mode 👇

TradesViz
🍫Hershey Co - $HSY - Our seasonality of the day! Up ~23% this year so far 👀 Is this on your watchlist?... We found this using the TradesViz seasonality practice mode 👇
TradesViz
"History Repeats Itself." Are you paying attention? 📅 You are staring at a 1-minute chart trying to find an edge, completely ignoring the macro context. "Does the company actually make money? What did this exact stock do during this exact same week for the last 5 years?" Trading in a vacuum is financial suicide. Understand the asset before you buy the ticker.

TradesViz
Stop blaming your lack of coding skills for your lack of insight. The Artificial Intelligence Q&A feature acts as your personal, on-demand data scientist. Type your question in plain English, exactly how you think it. In this example: "list down net premium flow across top traded stocks over the past quarter year". Instantly, the engine builds a custom data table and plots a corresponding bar chart. No spreadsheets. No formulas. If you still aren't finding your edge, it's because you aren't asking the right questions.

TradesViz
Did your system fail, or did you ignore the macro? Trading in a vacuum is financial suicide. Our Month View doesn't just show your PnL; it overlays the market's schedule directly onto your performance. Use the top toggles to instantly populate your calendar with Economic Events, Earnings, IPOs, and Stock Splits. Did that massive red day happen because your technical setup was flawed, or because you were holding size through an unannounced fundamental catalyst?. Stop guessing why you lost. Add the context.

TradesViz
Which account is the anchor, and which is the sail? ⚓ If you are running multiple accounts or strategies, blending their PnL together is a great way to hide your failures. The Accounts Statistics dashboard pits your portfolios against each other in a ruthless side-by-side audit. If you only looked at your overall net worth, you wouldn't realize that one specific account is bleeding you dry. Isolate the data. Cut the dead weight.

TradesViz
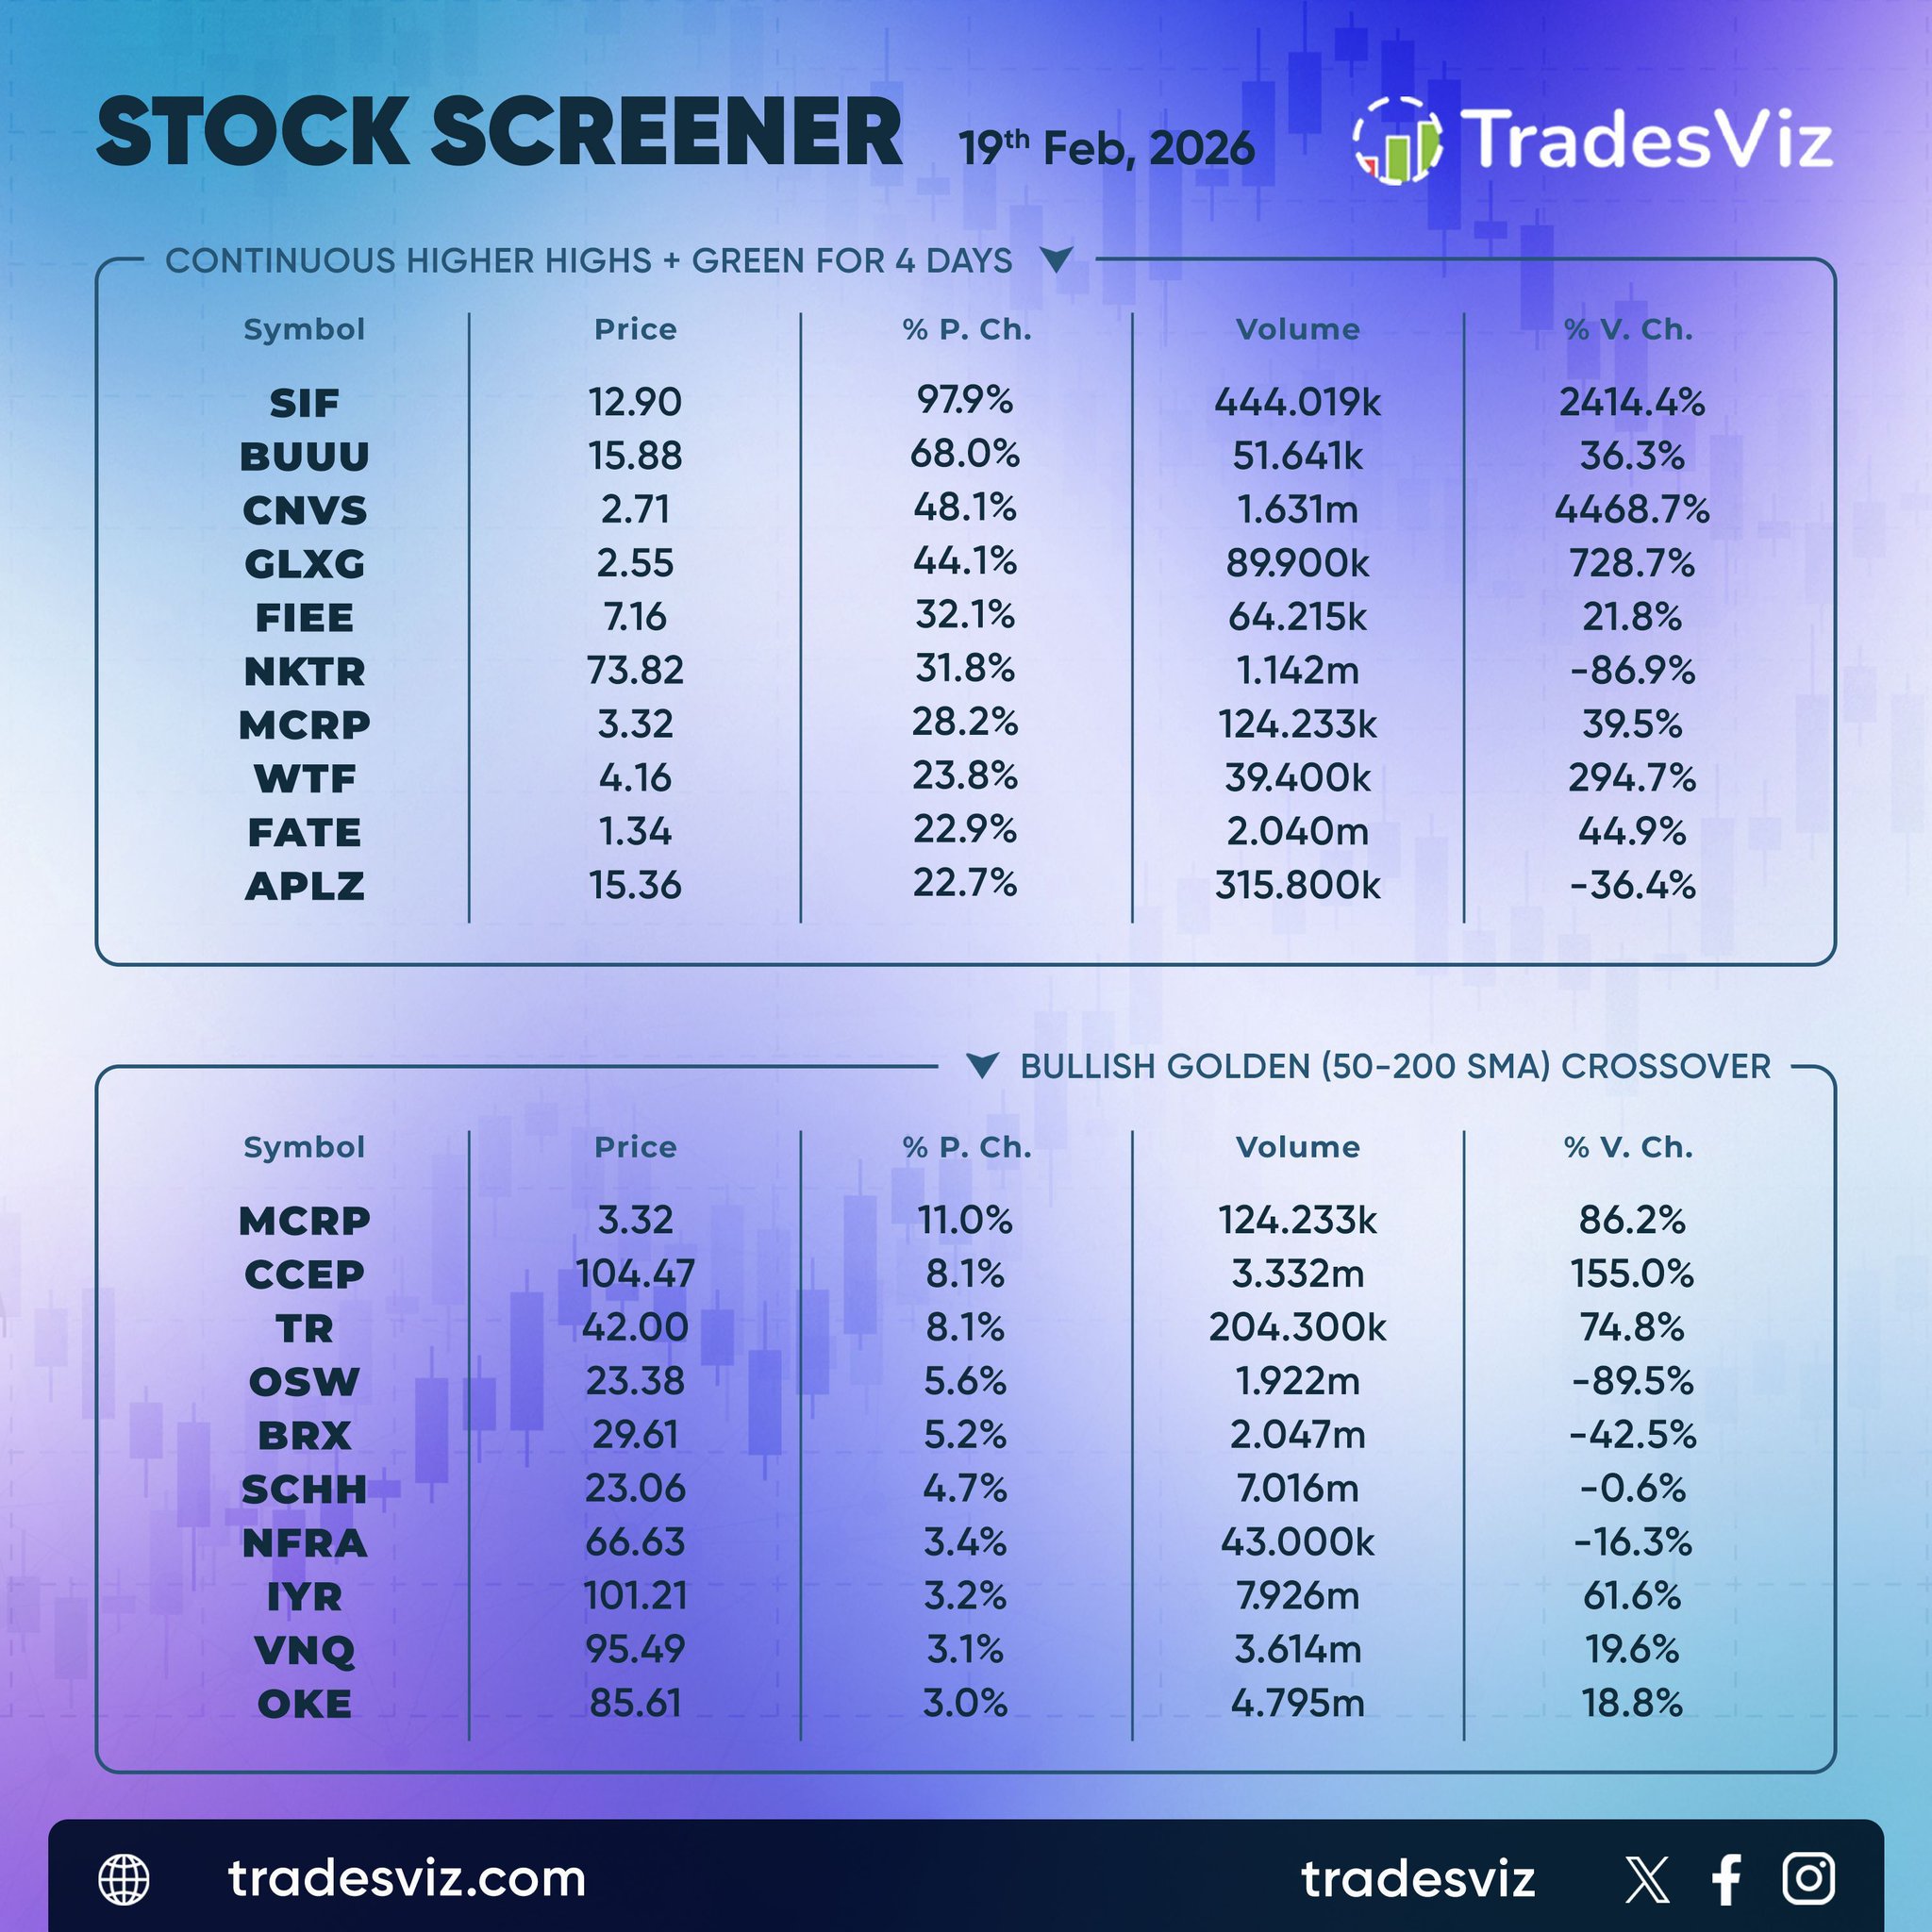
The February 19 technical screener reflected broad momentum continuation across mid‑cap and trend‑based names, with strong performers extending multi‑day rallies and multiple fresh bullish crossovers appearing in infrastructure, real estate, and communication sectors. In the continuous higher highs and green for four days category, $SIF led with a 97.9 percent jump and a steep 2,414 percent rise in volume, confirming sustained buying pressure. $BUUU followed with a 68 percent move and steady volume, while $CNVS and $GLXG advanced 48.1 and 44.1 percent alongside over 4,000 and 728 percent respective volume expansions, showing rapid short‑term accumulation in small‑cap momentum names. $NKTR and $MCRP each gained over 28 percent with solid trading activity, signaling persistent strength within biotech and renewable segments. In the bullish golden (50–200 SMA) crossover list, $MCRP reappeared with an 11 percent rise on 86 percent volume growth, showing trend confirmation. $CCEP and $TR gained 8.1 percent each, backed by strong liquidity and follow‑through volume. Lower‑beta names like $NFRA, $IYR, and $VNQ reflected quieter yet stable advancement between 3 and 3.5 percent, indicative of capital rotation into yield‑sensitive sectors. Overall, the screen highlighted expanding participation from speculative mid‑caps to defensive infrastructure plays, underscoring consistent momentum breadth through the third week of February.
TradesViz
The February 19 options flow screener showed strong sweep‑side buying across large‑cap tech and cyclical sectors, reflecting renewed institutional accumulation over the past two sessions. $AMZN led total volume with a 17 percent increase, trading around 3.7K sweeps as buying accelerated through mid‑day. $PLTR followed with a 71 percent jump and 3.4K total trades, continuing the steady momentum seen in most AI‑linked names. $MU gained 27 percent, while $META rose 42 percent and $MSFT added 8.5 percent, showing consistent, broad tech participation. Chip‑related activity remained firm with $SMH and $TSM both showing positive growth at 4.3 and 7.9 percent respectively, confirming sector‑wide demand. $ORCL saw a notable 65 percent spike, signaling accumulation in enterprise software, while $WMT and $XLE led the cyclical side with surges of 270 and 305 percent, indicating defensive rotation and renewed energy exposure. The chart for $AMZN displayed short‑term volatility before a sharp rebound, matching the uptick in sweep buying. Overall, the data pointed to stable institutional engagement with buyers stepping back into tech and energy, suggesting controlled optimism heading into late‑February trading.

TradesViz
The February 19 options flow showed active institutional participation concentrated in gold, semiconductors, and high‑beta tech, with heavy sweeps signaling directional conviction across multiple expirations. $GLD dominated with large two‑way sweeps on the $475 call expiring March 6 2026 — a $74 million buy followed by a $27 million sell — totaling over 220,000 contracts traded and confirming substantial positioning in precious metals exposure. $TSLA saw repeated split activity at the $190 and $450 call strikes across both 2027 and 2028 expirations, with multiple trades between $17 million and $34 million, reflecting active repositioning and volatility management in high‑growth tech. $TSM printed a $26 million buy sweep at the $310 strike and a smaller $10 million sell at the $360 strike, balancing long and short exposure ahead of next‑quarter projections. $STX and $AMAT showed mid‑range flows between $11 million and $15 million per trade. $STX call sweeps at $250 and $420 imply steady accumulation in storage, while $AMAT featured back‑to‑back buy and sell sweeps across $270 to $280 strikes, signaling neutral premium rotation near expirations.

TradesViz
The February 19 earnings lineup features key reports from retail, energy, and infrastructure leaders, anchored by heavyweight names across multiple sectors. $WMT leads pre‑market with a $1.03 trillion market cap and a $0.73 EPS estimate, setting the tone for retail and consumer spending sentiment. $DE follows at $162 billion and $1.92 EPS, offering a critical view on agricultural equipment and industrial demand. $SO joins the morning list with a $101 billion cap and $0.56 EPS, while $PWR prints $2.77 EPS on $78 billion, underscoring strength in utility and infrastructure services. $CVE adds energy exposure at $38 billion and $0.28 EPS. After hours, $NEM reports with a $133 billion market cap and $2.03 EPS, giving a fresh look at metals and mining. $FIX ($47 billion, $6.77 EPS) and $ED ($41 billion, $0.84 EPS) continue utility and industrial themes, while $TRGP ($48 billion, $2.37 EPS) and $LYV ($36 billion, –$1.02 EPS) represent energy logistics and live entertainment. Key economic events on the same day include Unemployment Claims at 07:30, the Philly Fed Manufacturing Index at 07:30, and Pending Home Sales m/m at 09:00, adding important macro context to an earnings‑heavy session.

TradesViz
Check the option flow dashboard 🌊 every day on TradesViz before you trade. It takes ~3-5 minutes to explore the overall flow, market outliers, and specific info for symbols of your interest. This alone gives you many trade ideas and can also act as a confirmation of your existing ideas. Need something even better? Adjust filters on the left side to find *precise* trade ideas that are purely data-driven. 📊 All of this is already part of your TradesViz trading journal :)
