Another big feature we've been preparing and testing for a while now. Our trading simulator has been very popular among traders as this is the only platform to seamlessly integrate replay, fast simulation, and journaling for stocks, futures, and forex.
Since we launched our original simulator, the biggest feature request has been: how to practice training or see the charts on multiple timeframes. This is finally possible with this update.
Not only can you view a symbol in multiple timeframes, but you can view ANY symbol on ANY timeframe - you have 4 charts for this in the new multi-simulator interface and each chart can have any symbol and any timeframe. All of this is synced so you can easily use the features of the speed-up, time seek, etc.,
While other trading journals have limited functionality of the single view charting itself, all of our solutions are 100% custom and built in-house which allows us to build and extend features easily.
Video walkthrough:
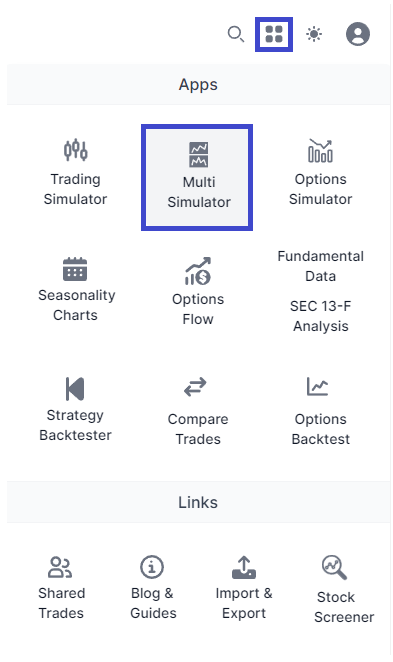
These charts and features are on a completely different dedicated page. Our single-chart simulator is available via the URL: https://tradesviz.com/tradingsimulator/ whereas the multi-chart simulator is available via the URL: https://tradesviz.com/tradingsimulator-multi/. You can also access one from the other by clicking on the button at the top (nav bar). The easiest way to access via GUI is by clicking on the 3-bars icon on the top right corner of your dashboard and clicking on the new "Trading simulator (Multi)" option:
Here's a video of the charts in action + a dynamic symbol change:
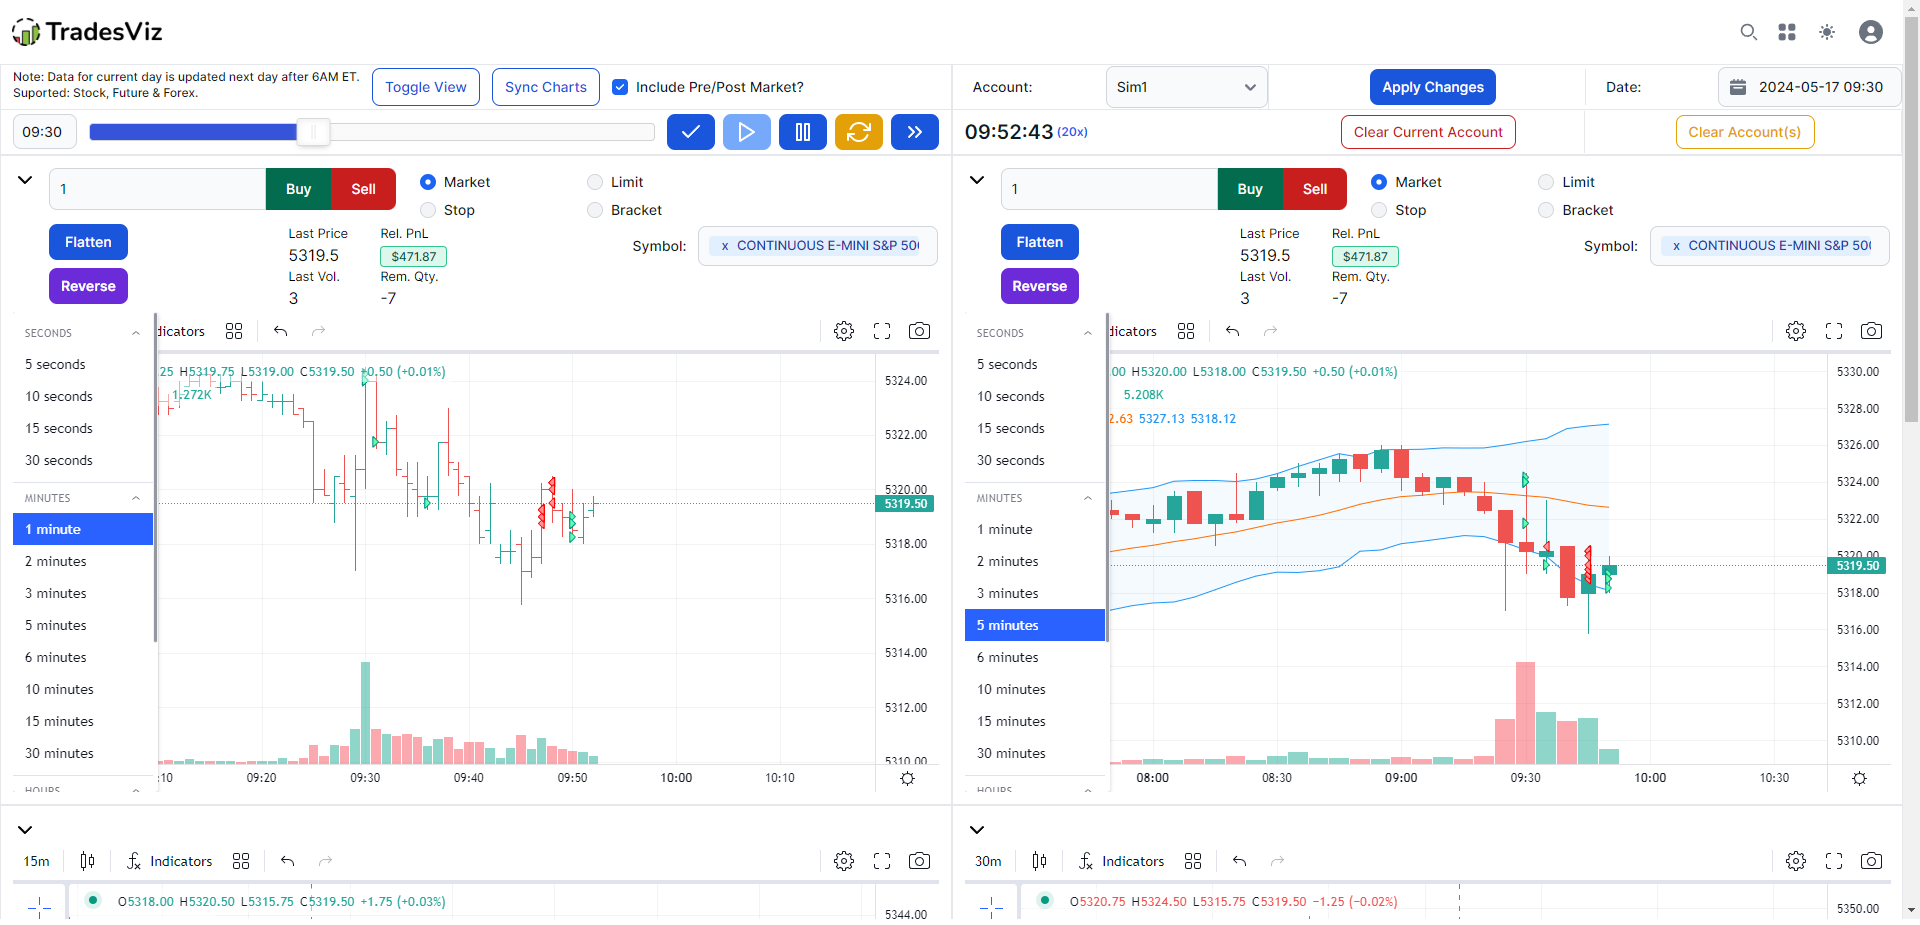
The controls are very similar to our original single chart simulator:
Instead of the controls being on the right side, you have the controls at the top that are common to all charts:
- Time of day
- Play/Pause/Reset
- Speed
- Clear/reset linked (simulator) account
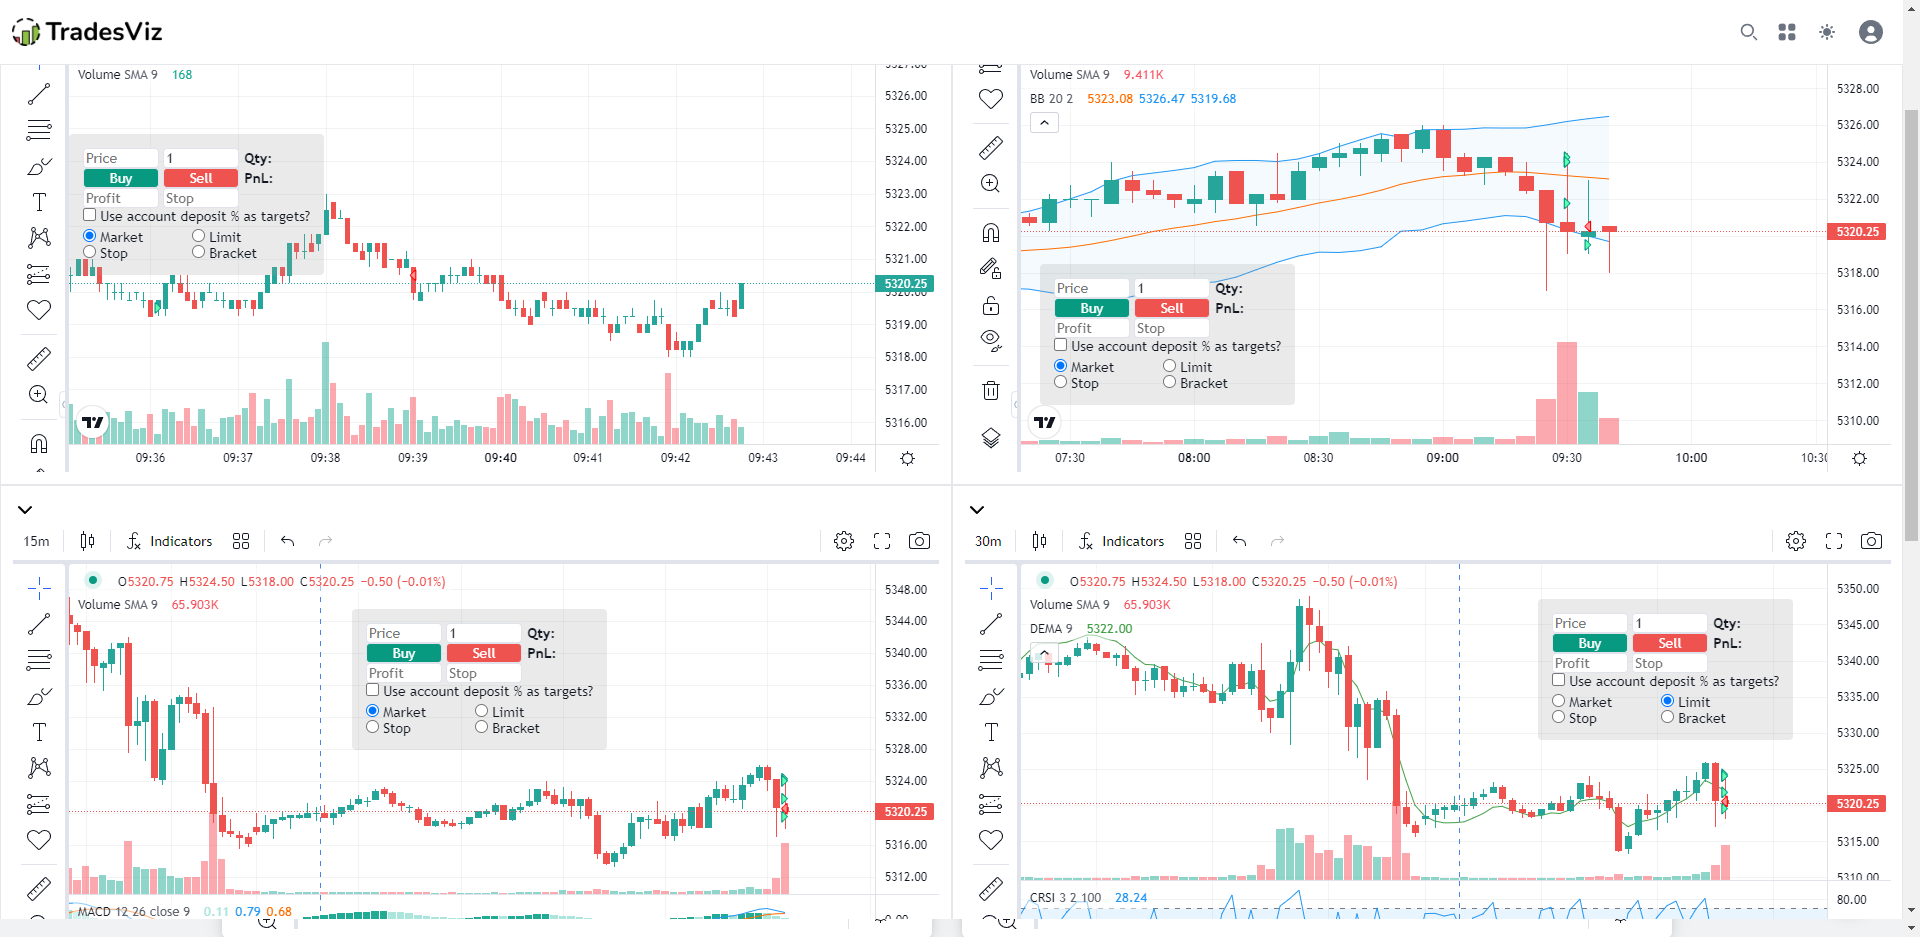
Each of the 4 charts has its own chart-specific controls that you can use when simulating trades.
At the top of every chart, you will see the following controls that are specific to each chart and symbol:
- Order type selection
- Order input (dynamic change based on order type)
- Flatten/Reverse button
- Last price, Last volume, PnL & Remaining Quantity indicators
- Symbol change dropdown
Now, what do we mean by specific to each chart and symbol?
Here's the interesting feature:
All the charts show bar data are synced in time. On top of this, if you say, for example, place a limit order on a 5-minute AAPL chart and you also happen to have a 15-minute chart below it, you will see the limit order appear on both charts!
This gives you the *most* realistic trading simulator expensive - EXACTLY like in your trading dashboard in your broker's platform. So to sum up, you will see the actions executed for a symbol in all the charts that have the same symbol - this includes orders placed, orders executed, etc.,
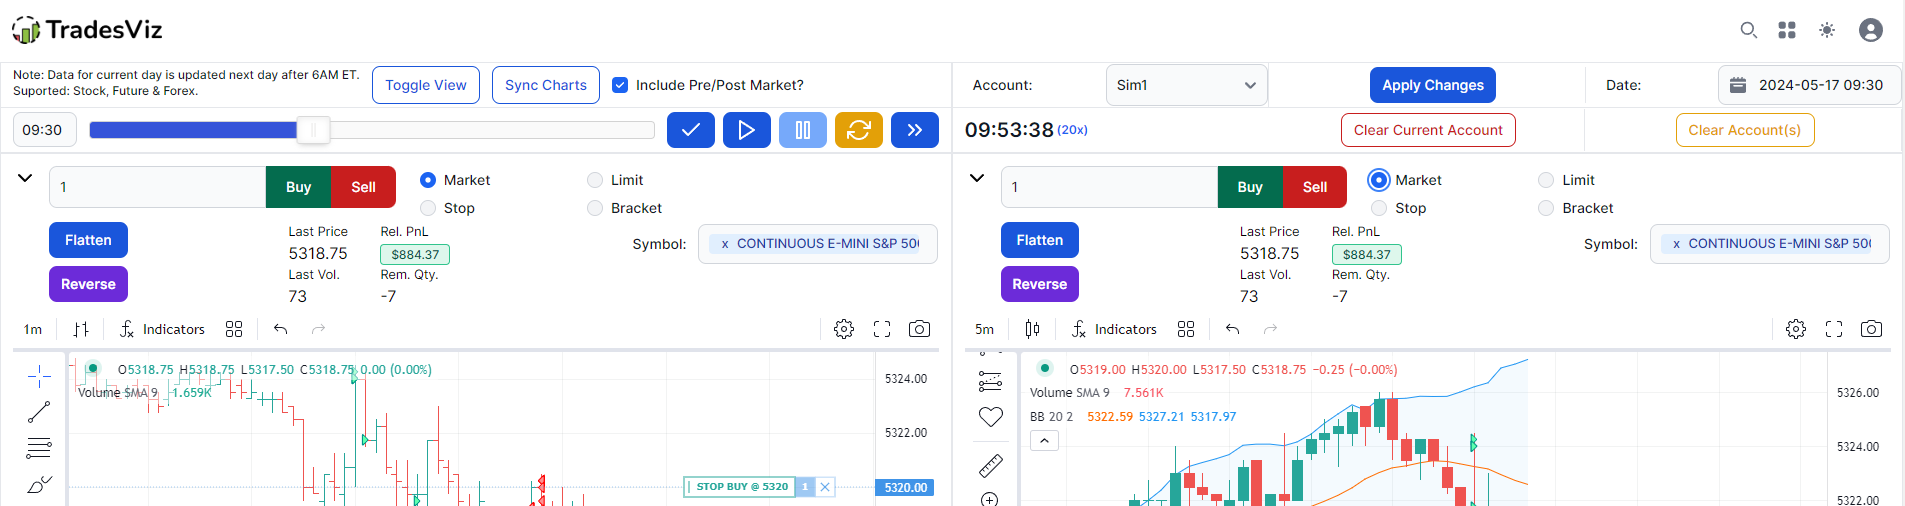
Here's a video of orders being placed at 20x speed on both 1minute and 5minute charts:
Just like the normal single chart trading simulator, we also added the executions list along with the real-time updating trades table at the bottom for your convenience.
Since this system is complex in terms of sync and order matching, there are a few best practices we suggest when using it:
- If you are only going to trade one symbol but need it on multiple timeframes, it's better to set it before you start paying the simulator. The same goes for using multiple symbols.
- You will notice that for each change you made, you are notified of the change on the bottom right as a small popup to make sure you understand what is happening and what data is being loaded.
- Rapidly changing timeframes might cause sync issues or delays so we don't really suggest doing that. Having 4 charts should be ample for most traders to view 4 unique timeframes for a single symbol.
- Trade replay is not available yet on multi charts due to the complexity and flexibility of the charts
Once again, you can mix stocks, futures, and forex in this simulator - the ONLY simulation platform online with this feature at the moment.
All of this comes as part of an extended upgrade to the existing simulator for TradesViz users.
We hope to see more traders effectively using the trading simulator to learn more about their trading patterns rather than just paper trade for paper profits.
The primary goal of the simulator and trade replay is to make sure sure you learn the chart patterns, see them again and again, and consider "what if" scenarios in your mind when doing so.
There is absolutely no point in using the simulator just as an alternative or as a paper trading platform as you are missing out on the BIGGEST and the MOST EFFECTIVE feature of a simulator which is to rewind and relive your decisions, mistakes, and reactions at your own convenience thus making the multi simulator one of the best tools available online for any trader
Update April 2023
- You can now collapse the extra buttons at the top of each chart. This will automatically activate the order box overlay in the chart.
- You can switch to a compact view to view all 4 charts within your viewport so that you can trade without needing to scroll.
Update April 26th 2023:
All the drawings in the chart are now synced. Check the video below for a demonstration!
Update May 2nd 2023:
You can now create a multi-chart at once using the new sync button available in the toolbar. Click on the sync icon button and you will see a popup like below where you can select the symbol and timeframe for each chart along with the date and time.
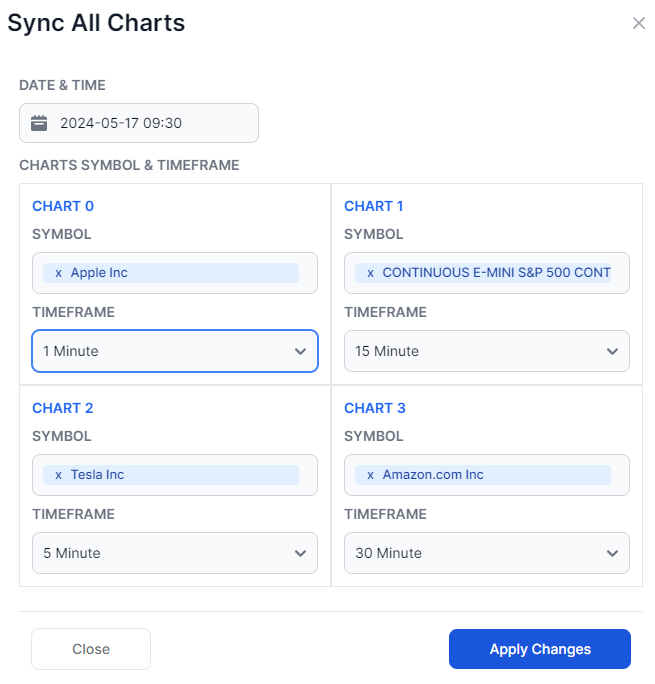
With this, you no longer need to individually select a trade, instead, you can simple set your symbols and timeframes, click apply changes, and start trading!
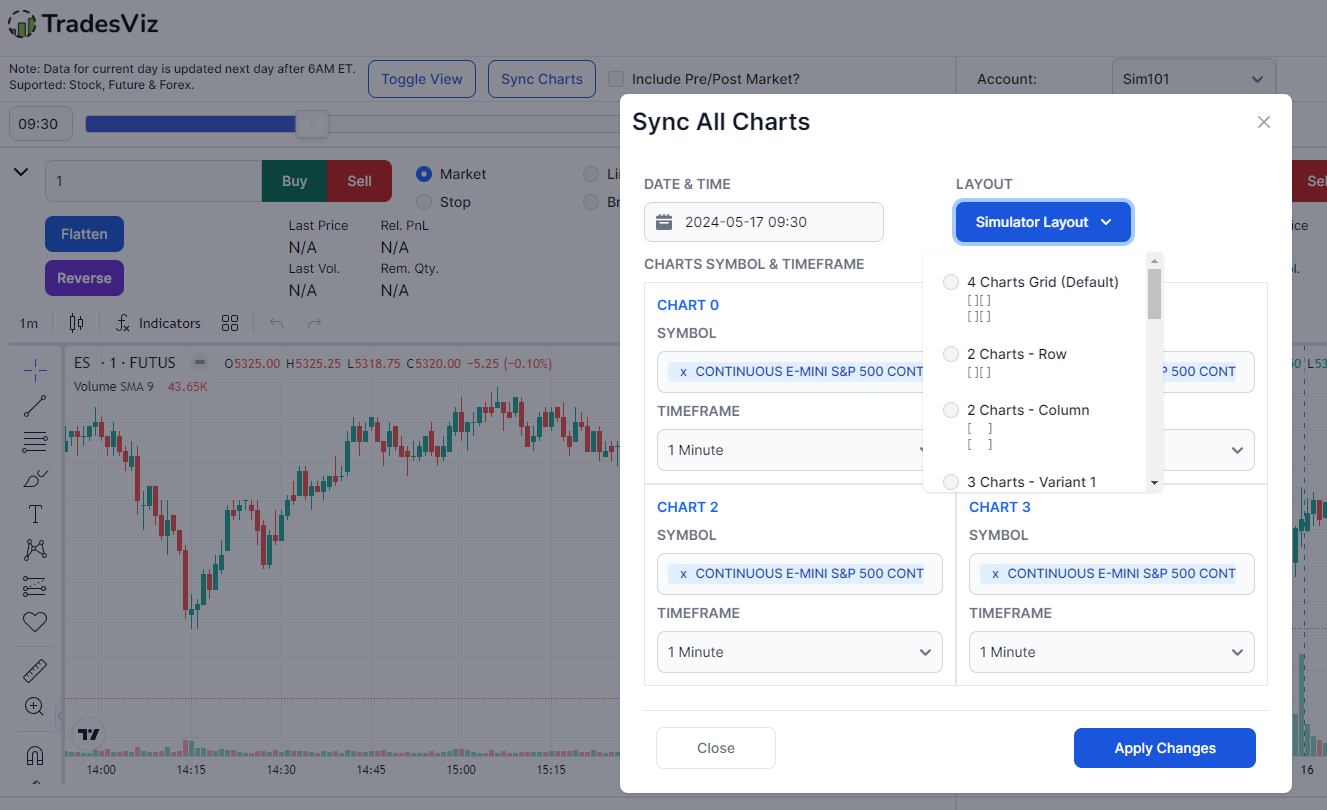
Update May 2024:
You can now choose among 13 unique chart layouts! Learn more here: https://www.tradesviz.com/blog/multi-chart-simulator-layout/
Update July 2024:
- Once a multi-chart layout is selected, it is saved automatically to your local cache so that the next time you open the multi-sim, it will be loaded on start.
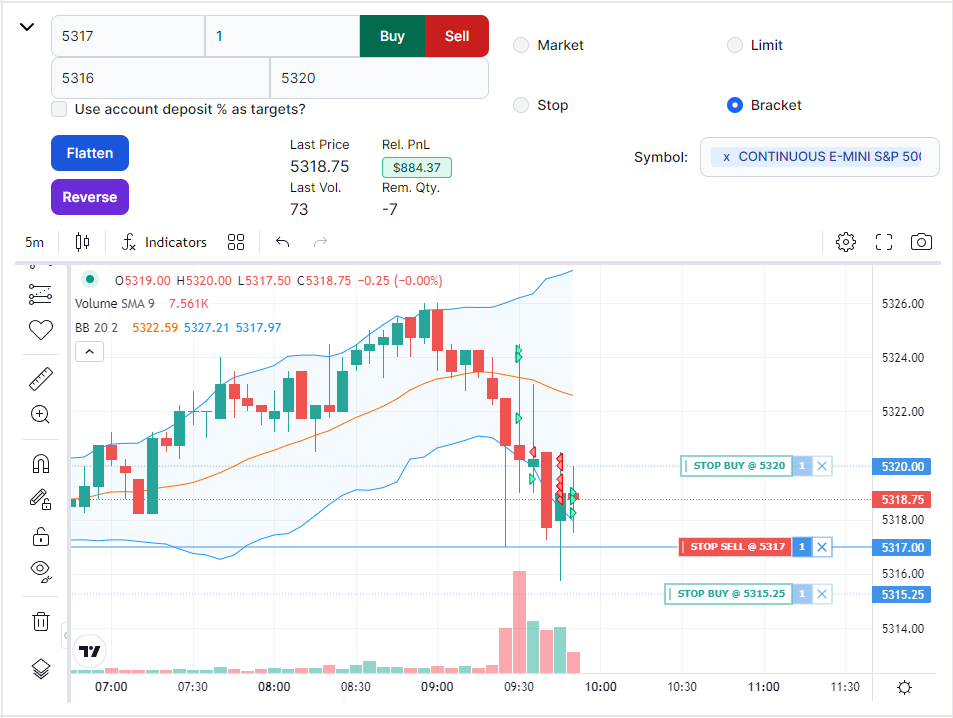
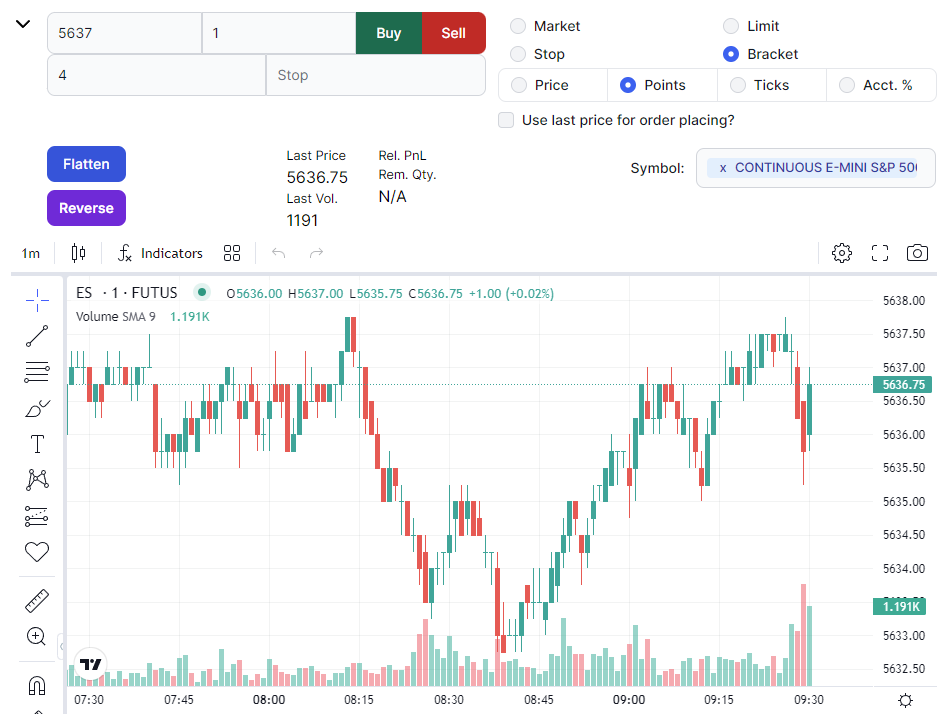
- We also added the single simulator's new improved bracket order system to all the charts of multi-sim!
Update Sep 2025:
You can now resize the multi-chart layout charts by dragging the border lines between the charts. Double-clicking the border will reset the size. Check the video below!
Let us know your questions and feedback by emailing us at [email protected]!